


Abstract
Global mRNA abundance depends on the balance of synthesis and decay of a population of mRNAs. To account for this balance during activation of T cells, we used metabolic labeling to quantify the contributions of RNA transcription and decay over a 4 h time course during activation of leukemia-derived Jurkat T cells. While prior studies suggested more than half of the changes in mRNA abundance were due to RNA stability, we found a smaller but more interesting population of mRNAs changed stability. These mRNAs clustered into functionally related subpopulations that included replicative histones, ribosomal biogenesis and cell motility functions. We then applied a novel analysis based on integrating global protein-RNA binding with concurrent changes in RNA stability at specific time points following activation. This analysis demonstrated robust stabilization of mRNAs by the HuR RNA-binding protein 4 h after activation. Our unexpected findings demonstrate that the temporal regulation of mRNA stability coordinates vital cellular pathways and is in part controlled by the HuR RNA binding protein in Jurkat T cells following activation.
INTRODUCTION
Two major processes in the cell determine the abundance of each mRNA: the rate of its transcription and the rate of its decay. The temporal regulation of these two processes enables global changes in gene expression that drive dynamic cellular responses. For example, in the immune system, T cell responses following activation are driven by the rapid induction of cytokines and chemokines involving both transcriptional and post-transcriptional regulation (1–6). Tight temporal control of expression of these immunoregulatory genes is crucial in order to strike the balance between an immune response that is sufficient to clear an infection yet restrained enough to prevent inflammatory damage. Indeed, control of inflammatory gene expression is increasingly recognized to include global regulation of mRNA decay in T cells. For example, many studies have described the importance of post-transcriptional regulation of cytokines and chemokines that cause major cellular changes in growth, proliferation, differentiation and metabolism (6–10). But in most of these cases, the role of post-transcriptional regulation is unclear. Two distinct approaches have been used to globally assess the involvement of post-transcriptional regulation in activating T cells (2,5). One study compared nuclear run-on assays with total mRNA in the first hour of Jurkat T cell activation and extrapolated that more than one-half of the expressed genes were changed, primarily by mRNA decay (2). An earlier study using transcriptional inhibition of primary human T cells over a 2 h period of activation by co-stimulation identified substantially less regulation by mRNA decay (5). The former study utilized invasive cellular methods that disrupted cell metabolism in addition to binary definitions of change, while the latter only resolved changes for very short-lived mRNAs and could not address transcription-dependent regulation. Therefore, the behavior of and relationship between transcriptional and post-transcriptional contributions to global gene expression changes during T cell activation require further examination.
Recently, methods have been developed that quantitate transcription and stability rates simultaneously using pulsed nucleotide analogues such as 4-thiouridine (4sU) (11–16). This nucleotide analog is efficiently incorporated into nascent mRNAs without perturbing cell metabolism (11). This method uses the analysis of the relationships between total, labeled and unlabeled mRNAs to accurately measure stability, even for stable mRNAs (11). Furthermore, this approach has been effectively used to quantify mRNA synthesis and decay rates during dynamic changes in gene expression (13,15,16). In recent studies, we used 4sU metabolic labeling to assess the transcription and stability in CD8+ T cells responding to HIV antigens (17), and in a model of Hepatitis C virus infection (18). Therefore, 4sU metabolic labeling is an established quantitative procedure that is capable of measuring dynamic changes in both transcription and decay during T cell activation. Moreover, metabolic labeling can serve as a useful platform to quantify how changes in RNA stability correspond with mRNA targeting by specific RNA-binding proteins.
In a previous study, we reported that HuR, an RNA binding protein (RBP) known to stabilize certain mRNAs, substantially changed its RNA targets following Jurkat T cell activation (19). At each time point post-activation, HuR maintained its well-studied preference for binding to U-rich mRNAs (20–24). Groups of these U-rich mRNAs, however, changed in their binding with HuR after activation. These changes were concentrated in functionally related groups of mRNAs that encoded cell cycle, mRNA processing and Wnt signaling proteins (19). A change in RBP binding, however, does not necessarily lead to a change in stability or regulation. In fact, many RBP targeting experiments have clearly shown that RBPs bind some mRNAs that are not regulated. And previous approaches to understanding the impact of RBP binding have typically used measurements of mRNA abundance of the targeted mRNAs after disruption of RBP expression to indicate potential regulatory events at RBP binding sites (1,24,25). Measuring global mRNA decay rates, however, can more directly measure the impact of changes in HuR binding on RNA abundance. Therefore, we quantified changes in mRNA stability during early Jurkat T cell activation, and integrated these changes with data from HuR binding to investigate how HuR affects the stability of its mRNA targets.
To this end, we utilized 4sU metabolic labeling to quantify the dynamics of transcription and decay over a 4 h time course using the Jurkat T cell activation model. We characterized the global transcriptional and post-transcriptional regulatory dynamics and matched the relationships in stability changes with HuR targeting specificity. Contrary to previous reports, we found that a relatively small, but functionally important proportion of activated Jurkat gene regulation depends on changes in mRNA decay. Importantly, these post-transcriptional changes included mRNAs that encode crucial aspects of cellular signaling, replication, protein production, growth and migration. Furthermore, by integrating global RNA stability data with RBP targeting data, we showed that HuR stabilizes condition-specific mRNA targets after activation.
MATERIALS AND METHODS
Cell culture and antibodies
Jurkat cells were cultured in RPMI 1640 supplemented with 10% FBS at 37°C. For activation experiments, Jurkat cells were cultured overnight at a concentration of 106 cells per ml, then activated through addition of 0.5 μg/ml PMA and 2 μg/ml PHA to culture media. Anti-SLBP antibodies were generously provided by Dr. Bill Marzluff for standard western blotting.
4-thiouridine (4sU) labeling
4sU metabolic labeling was performed as outlined in (11) with minor modifications. Brieftly, 200 μg/ml 4-thiouridine was added to the culture 1 h prior to each harvest time point. Cells were lysed in Trizol (Life Technologies) and RNA was extracted using manufacturers recommendations. 4sU labeled and unlabeled RNAs were separated as described in (11,17). Streptavidin MyOne C1 conjugated dynabeads (Invitrogen) were used to bind and select biotinylated RNA. Isolated RNA was prepared for either real time polymerase chain reaction (PCR) using iScript cDNA synthesis kit (Bio-Rad) or prepared for deep sequencing using ScriptSeq RNAseq kit (Illumina).
Deep sequencing & data analysis
Sample libraries were sequenced using an Illumina Hi-Seq 2000 using 50 bp single end settings. Data were mapped using TopHat2 (26), raw counts calculated with HTSeq (27) then counts per million were calculated and normalized for total mRNA and labeled mRNA independently using edgeR (28). From three biological replicates, genes with <1 read per million or >50% standard error at any time point or condition were removed. Subsequently, levels of 4sU incorporation were determined as previously reported (13), observed to be approximately 1 in every 125 uridine bases (data not shown), and accounted for in net transcription levels. Changes in mRNA abundance and net transcription at each time point were calculated relative to unactivated Jurkat cells using edgeR based on a false discovery rate (FDR) of .01. Additionally, a T score continuous metric was calculated for both net transcription and total mRNA abundance. Subsequently, iterative transcription-based modeling calculations were optimized using a linear regression model to maximize absolute correlation between predicted and observed values. This calculation concluded that a coefficient of 0.266 optimally related net transcription abundances to total mRNA abundances. Decay rates were determined using the iterative formula outlined in Figure 2A using observed mRNA abundances and net transcription. For the unactivated time point, because of steady state mRNA levels at rest, this equation simplified to ln(1-.266*(net txn/total)). Significantly different decay rates at any time point were calculated in R using one-way ANOVA and an FDR of 0.1. Subsequently, T scores comparing decay rate at each time point to unactivated decay rates were calculated. These T scores were used as a continuous metric as inputs into Short Time-series Expression Miner (STEM) (29) and for integration with binding data.
Figure 2.
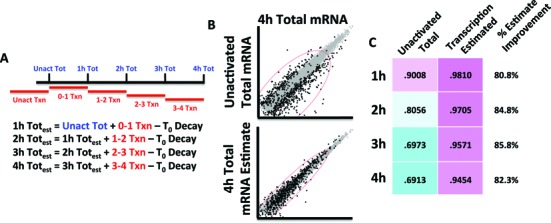
Iterative modeling of metabolic labeling data based on levels of labeled mRNA that estimates mRNA abundances. (A) The formula used to calculate estimated total mRNA abundances. Assuming a constant decay rate, based upon the rate calculated from unactivated Jurkat cells, the abundance at the end of 4 h can be estimated with an initial mRNA abundance and net transcription over each hour. (B) Comparing this estimation of mRNA abundance at 4 h to observed abundances at 4 h shows a tighter correlation than the baseline of initial mRNA abundance for genes that are regulated after activation (>2-fold at any point). (C) This correlation between estimated and observed values is quantified across the entire time course. The estimated model based on transcription improves the correlation with observed values dramatically among regulated genes. The percent improvement calculates the improvement in correlation by including changes in transcription, thus representing the approximate proportion of regulation derived from transcriptional events at each time point.
Actinomycin D labeling and real time PCR
Cells were labeled with 5 μg/ml actinomycin D for a fixed period of time as described in (30). RNA was isolated and cDNA generated using iScript (Bio-Rad). Platinum SYBR Green Super Mix (Invitrogen) was used for real time PCR on a Lightcycler (Roche). Raw Ct values were normalized to GAPDH Ct values and resting Jurkat cells. These ΔΔCt values were analyzed using GraphPad Prism where half-lives were calculated based on one phase decay and statistical significance was determined using one-way ANOVA.
RESULTS
We evaluated gene expression changes in Jurkat T cells by quantifying mRNA levels following the addition of activating mitogenic compounds phorbol myristate acetate (PMA) and phytohemagglutinin (PHA). In order to simultaneously measure changes in RNA abundance, transcription and stability across the transcriptome in this activation model, we used 4sU metabolic labeling (11). Prior to activation, and during each of 4 h after activation, we pulsed 4sU into cells for 1 h. The 4sU was incorporated into nascent RNAs (Figure 1A), then the RNA was extracted and labeled RNA was separated from unlabeled RNA (Figure 1B). Total mRNA and 4sU labeled mRNA from each 1 h interval were sequenced for three biological replicates. After mapping the RNA-seq data to the genome, the mapped RNA-seq reads were characterized according to their genomic origin. 4sU labeled mRNA contained substantially more intronic reads than total mRNA (Figure 1C), indicating an enrichment of pre-mRNA that demonstrated that the approach captured recently transcribed mRNAs. Having validated the methodology, we measured mRNA levels of each sample using HTSeq-count (27) followed by edgeR normalization (28) and removed genes with low expression or high variation between replicates. We observed significant changes in mRNA abundance and/or 4sU labeled mRNA in 1747 genes across the first 4 h after stimulation. These changes clustered into similar functional groups in both the mRNA abundance and 4sU labeled mRNA (Figure 1D). The earliest responding messages, during the first hour, encoded apoptotic and transcriptional factors. In the second hour, the list grew to include additional transcription-related factors. Finally, in the last 2 h, many mRNAs encoding cell maturation and immune response factors were regulated. Interestingly, several of these same functional groups were enriched in the 4sU labeled mRNA population earlier than in total mRNA, reflecting the greater sensitivity obtained by measuring net transcription rather than total mRNA abundance (Figure 1D).
Figure 1.
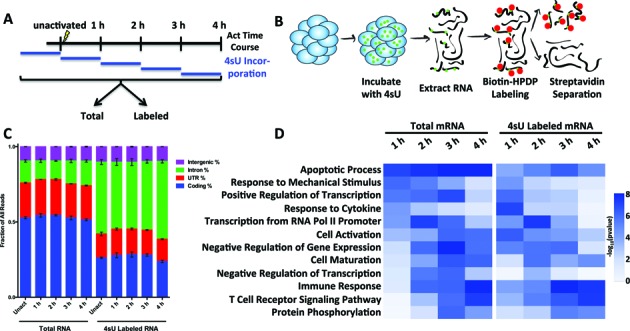
4sU metabolic labeling measures transcription and mRNA abundance during Jurkat T cell activation. (A) Experimental design. 4-thiouridine (4sU) was pulsed for 1 h for each of the first 4 h after addition of PMA and PHA to Jurkat T cells. Cells were harvested at the end of each hour, then separated into total mRNA, labeled mRNA and unlabeled mRNA populations using a 4sU separation protocol originally described in Dolken et al. (2008). (B) Schematic of 4sU separation protocol. After incubation of cells with 4sU, RNA was extracted, labeled with biotinylation of incorporated 4sU and separated using streptavidin into total, labeled and unlabeled populations. (C) Distribution of mapped reads obtained from sequencing total mRNA and 4sU labeled mRNA populations. Error bars represent ±SEM for three biological replicate RNA-seq experiments. The increased proportion of reads mapping to introns (green) from labeled mRNA indicates that, as expected, the isolation of labeled RNA captures nascent mRNA transcripts. (D) Gene Ontology (GO) biological processes with changes after activation in total and labeled mRNA fractions are shown over the 4 h time course. Note that for several GO Categories, including Cell Activation, Immune Response and T Cell Receptor Signaling Pathway, labeled mRNA revealed enrichment in these categories earlier than observed for the total mRNA.
The advantage of a metabolic labeling approach is the ability to assign proportional changes in mRNA abundance to transcription and decay. To investigate this relationship, we started with the simple equation that mRNA abundance equals previous abundance, plus net transcription, minus the amount of decay (Figure 2A). Utilizing a model based off of ‘Dynamic Transcriptome Analysis’ (13), we calculated the unactivated decay rate and assumed it remained constant throughout the time course. Assuming constant decay, we could estimate the abundance at 4 h using only the unactivated mRNA abundance and the 4sU labeled mRNA abundance for each hour (Figure 2A). This transcription-only model estimated the abundances of regulated mRNAs well; genes that changed more than 2-fold in abundance at any point in the experiment correlated well (R = 0.945) with the observed abundances relative to the baseline of unactivated abundances (R = 0.691) (Figure 2B,C). The increase in predictive power using net transcription demonstrates that transcription accounts for approximately 80–85% of the changes in mRNA abundance observed (Figure 2C). This calculation agreed reasonably well with a simple correlation of mRNA abundance and net transcription at each hourly interval (R = ≈0.75–0.8 across all time points, data not shown). Overall, this suggested transcription was the major driver of changes in mRNA abundance.
On the other hand, the remaining ≈15–20% of genes were poorly explained by this model that assumed constant mRNA decay. Two clear examples were RNF145 (Figure 3A) and DDX3X (Figure 3B). When the time course of observed mRNA abundance (blue line) was plotted against the estimated mRNA abundance (dashed line), the mRNA abundance changed more dramatically than the transcriptional changes (red line) would predict in many cases. This finding suggests that these genes are regulated post-transcriptionally, with RNF145 mRNA less stable and DDX3X mRNA more stable after activation. We confirmed these predictions using real time PCR measurements of both 4sU metabolic labeling (data not shown) and transcriptional inhibition at different times after activation. When Actinomycin D was added at any point after activation, RNF145 mRNA decayed more rapidly and DDX3X mRNA decayed less rapidly than prior to activation (Figure 3C, D).
Figure 3.
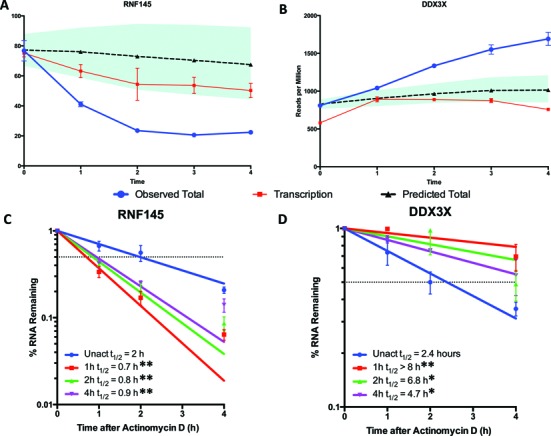
Changes in mRNA abundance of many mRNA messages are not due to transcription alone. Two prime examples of mRNAs whose transcriptional changes do not explain their mRNA abundance changes are the downregulated (A) RNF145 and upregulated (B) DDX3X. Observed mRNA abundance (blue line) changes much more dramatically than estimated (dashed line) based on transcriptional changes (red line). Thus, the data suggest these mRNAs are destabilized and stabilized, respectively. The shaded region represents the 95% confidence interval of the estimated abundance while error bars represent standard deviation. (C, D) We confirmed these observations using Actinomycin D transcriptional inhibition over the same time course of Jurkat cell activation. Half-life was calculated by using one phase decay and significant differences calculated using one-way ANOVA; (*) represents P-value < 0.05 and (**) represents P-value < 0.01. Error bars represent ±SEM.
Therefore, to identify all the genes that undergo quantitative changes in mRNA decay, we used the observed values of mRNA abundance and net transcription to solve the model relating transcription and decay for the decay rate. These values represent the decay rate necessary to balance the observed net transcription and mRNA abundance at each time point. Using the variance between replicates, we then calculated T scores for changes in decay rate relative to unactivated cells over the first 4 h of activation. Of the 1747 mRNAs that were regulated after activation, 425 of them had significantly altered decay rates at some point after activation based on a false discovery rate of 0.1. We confirmed decay rates changes using independent methods in several genes that represented a spectrum of direction and magnitude of decay rate regulation observed. These mRNAs measured by global 4sU RNA-seq and real time PCR after transcriptional inhibition were largely consistent (data not shown).
To explore the role of mRNA decay in Jurkat T cell activation, we used the decay rate T scores to evaluate the temporal dynamics of post-transcriptional regulation. Decay rate T scores were clustered into regulatory patterns using Short Time-series Expression Miner (STEM) (29). Three of the clusters were particularly striking in their functional relationships, suggesting coordinated post-transcriptional regulation (31,32) (Figure 4A). The first cluster consisted of a set of mRNAs stabilized in the first hour after activation. This subset of mRNAs was enriched for RNA regulatory factors, namely for the production of ribosomes (Figure 4B). Increased ribosome production would be a sensible early step to prepare for the additional translation required for growth. The third cluster was enriched for a set of mRNAs encoding factors related to cell migration and motility (Figure 4D). The migration of T cells is a crucial step after activation in order to spread the immune response out of the lymphatic tissue and into the areas of primary infection (33). Therefore, these cell migration and motility mRNAs appear to have been stabilized during the later wave of T cell activation to promote and support this increase in cellular movement.
Figure 4.
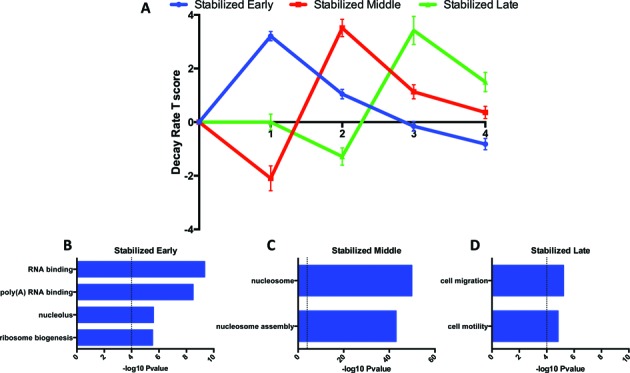
Coordinated changes in mRNA decay involve functionally related protein products. (A) The dynamic changes in three clusters in decay rate T score after activation are examples that are characteristic of post-transcriptional RNA operons and regulons. Error bars represent standard error. (B) The first cluster (blue) is stabilized in the first hour after activation and is enriched for GO categories relating to RNA binding proteins, including proteins involved in RNA regulation and ribosome biogenesis. The second cluster (red) is rapidly destabilized, then stabilized. (C) This coordinated cluster is highly enriched for histone mRNAs. (D) The third cluster (green), that is stabilized late, is enriched for cell migration and motility mRNAs, suggesting a post-transcriptional role for the onset of cellular movement in response to activation.
The most enriched cluster of mRNAs, however, was strongly destabilized at 1 h, then rapidly stabilized at 2 h post-activation. This cluster was highly enriched for histone mRNAs; 28 replication dependent histones were contained in this cluster. A compilation of the decay rate T scores of all expressed replication dependent histones demonstrated that nearly all followed a similar pattern of regulation (Figure 5A). We evaluated this observation by real time PCR. Because the dynamics of this regulation occurred so rapidly, we assessed post-transcriptional events in 15 min intervals after activation by both 4sU metabolic labeling (data not shown) and Actinomycin D transcriptional inhibition. With higher temporal resolution, we observed a decrease in the stability of HIST1H2AB, HIST1H2BG, HIST1H1B and HIST1H4D immediately upon activation (Figure 5C–F). This destabilization recovered starting at 30 min and was not dependent on transcription. Histone mRNAs are a highly unique class as they are the only mRNAs that are not polyadenylated (34,35). Their expression is tightly controlled and they are only upregulated, through both transcriptional and post-transcriptional mechanisms, in S phase (36). Their coordinated regulation is one of the clearest examples of a post-transcriptional regulon discovered to date (31,37). The major protein that coordinates histone mRNA stability is the stem loop binding protein (SLBP), via binding to a stem loop that is only found in the 3′ UTR of histone mRNAs (34,35). Therefore, we examined SLBP protein levels after T cell activation and observed that after 1 h of activation, SLBP protein was significantly decreased (Figure 5B), consistent with the decrease in stability of histone mRNAs. Interestingly, however, while SLBP protein abundance recovered somewhat in the second hour, it did not increase above baseline as histone mRNA stability did. Overall, the coordinated responses of several different crucial groups of mRNAs at the post-transcriptional level indicate that changes in decay rate play an important role in regulating mRNAs following the activation of Jurkat cells.
Figure 5.
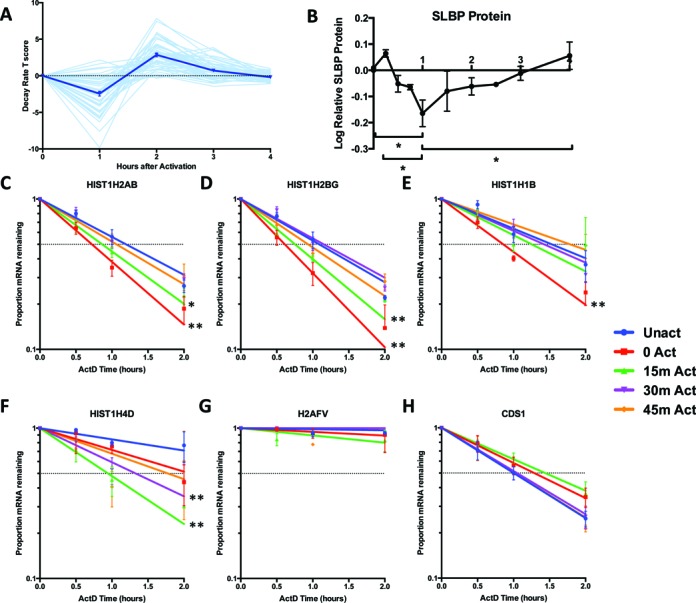
Histone mRNA regulation after Jurkat cell activation. (A) Change in T scores of mRNA stability of each individual replication dependent histone mRNA (light blue) over the entire 4 h time course from three biological replicates. Dark blue line represents the average of all histones and error bars represent ±SEM. (B) Change in SLBP protein levels over the 4 h time course as quantified by western blot image analysis in three biological replicates. Error bars represent ±SEM. (C–H) Actinomycin D validation of histone mRNAs using transcriptional inhibition at different points after activation. Real time PCR of different histones reveals a coordinated transient destabilization for the first half-hour after activation among a broad representation of replication dependent histone family members (C) HIST1H2AB, (D) HIST1H2BG, (E) HIST1H1B, (F) HIST1H4D. (G) H2AFV is a non-replication dependent control that does not significantly change in stability and (H) CDS1 is an unstable mRNA which also does not significantly change in stability. Half-life was calculated by using one phase decay and significant differences calculated using one-way ANOVA, (*) represents P-value < 0.05 and (**) represents P-value < 0.01. Error bars represnent ±SEM.
Having calculated both changes in transcription and changes in decay, we explored the relationship between the two processes in Jurkat T cell dynamics. Selecting mRNAs with significantly altered abundance at each time point, we plotted the change in transcription against the change in mRNA stability (Figure 6A–D). Across the time course, we observed that transcription and stability cooperate to maximize regulatory potential. Relatively few genes were transcriptionally increased and destabilized, or vice versa, as shown by the relative lack of mRNAs in the upper left or lower right quadrants of each time point. This suggests that transcription and stability cooperate to minimize counterproductive regulatory changes, thereby maximizing the speed and efficiency of T cell responses.
Figure 6.
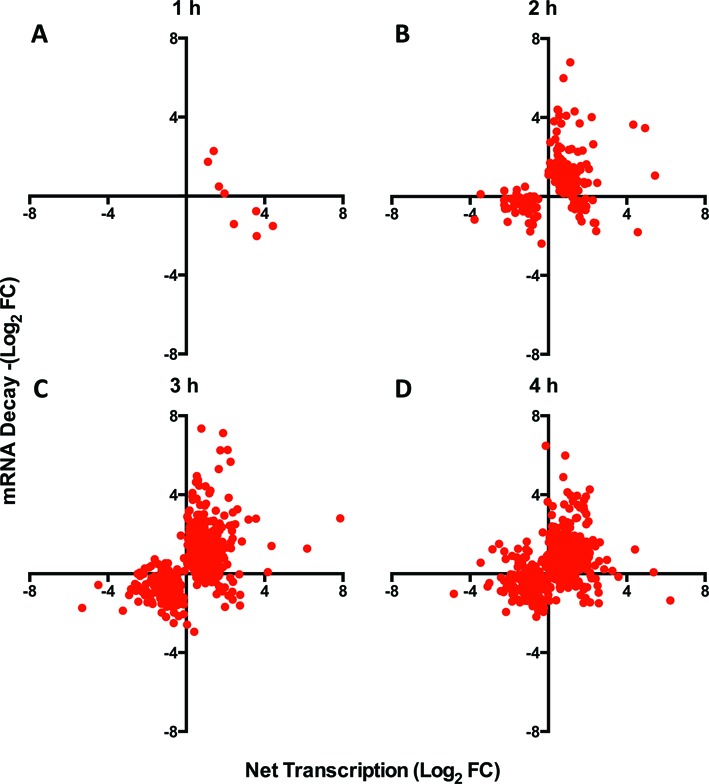
Changes in stability and transcription cooperate to maximize changes in mRNA abundance during Jurkat T cell activation. (A-D) Among genes that reproducibly changed in total mRNA abundance at (A) 1 h, (B) 2 h, (C) 3 h and (D) 4 h, the log fold change in net transcription was plotted against the log fold change in mRNA stability. Overall, changes in mRNA stability and net transcription appear to cooperate as indicated by the lack of genes with opposing changes (top left and bottom right quadrants).
Finally, previous studies have not integrated global mRNA stability data with RBP target data to examine the relationship between binding and regulation. However, we previously demonstrated that mRNA targets of HuR, a well-characterized promoter of mRNA stability, change significantly after Jurkat activation (19). Therefore, we analyzed the changes in mRNA stability after 4 h of activation in three different categories of mRNAs: targets of HuR at 4 h of Jurkat activation, targets of HuR in Jurkat cells but not at 4 h after activation, and non-HuR targets. We observed a significant stabilization of mRNAs bound by HuR at 4 h after activation that was not true of non-targets or non-four hour HuR targets (Figure 7, left of dashed line). The integration of HuR binding data suggests that binding of HuR to mRNAs after activation strongly influences the stability of those messages.
Figure 7.
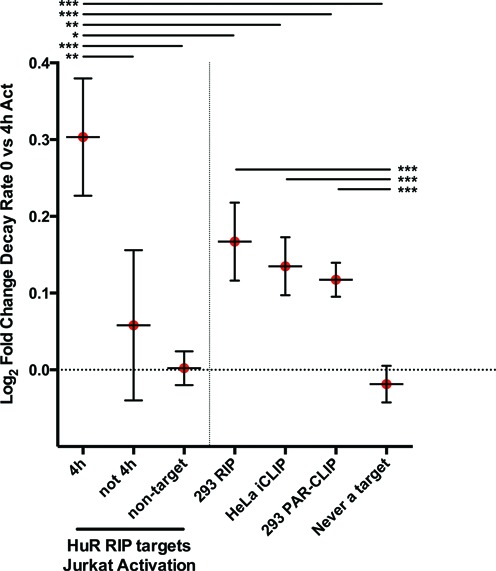
Changes in regulation are most closely correlated with effects of HuR mRNA binding when RNA binding is defined under identical conditions. (Left of Dashed Line) HuR mRNA binding correlates with increases in stability. HuR targets were previously identified at different stages of Jurkat activation (19). Targets that were bound by HuR at 4 h after activation (HuR Jkt target 4h) were significantly more stabilized in than HuR targets identified only at other time points (HuR Jkt target, not 4h) or non-HuR targets (non-target HuR Jkt). This suggests that HuR plays an important role in dynamically stabilizing groups of mRNAs after Jurkat activation. (Right of Dashed Line) Comparisons of HuR targets identified through a number of different approaches suggest cellular conditions are important for identifying functional regulation. HuR targets identified using 293 RIP and PAR-CLIP (11,24), and HeLa iCLIP (28,38)) were additionally compared to changes in mRNA stability between unactivated Jurkat cells and 4 h activated Jurkat cells. Though targets from all experiments were significantly more stabilized than non-targets, by far the strongest stabilization was seen in HuR targets identified in Jurkat cells 4 h after activation. This indicates the closest relationship between binding and function can be observed when both are measured in equivalent cellular conditions. Error bars represent 95% confidence interval. Significant differences calculated by one-way ANOVA, (***) P-value < 0.001.
Given that we saw a significant difference in stabilization based on the HuR-binding state of mRNAs, we wondered how experiments that previously defined HuR targets using different cell types would relate to mRNA stability in Jurkat activation. Thus, we identified HuR mRNA targets defined in previous studies encompassing several different cell lines and techniques, including RIP-chip, PAR-CLIP and iCLIP (19,24,38). We assessed the changes in the stability of these mRNA targets at 4 h after activation (Figure 7). The mRNA targets of HuR identified in each of the published mapping experiments was significantly stabilized relative to non-targets, but nonetheless were significantly less stabilized than the targets identified in Jurkat cells at 4 h. Therefore, while targets identified using HuR RIP or CLIP experiments in different cell types indicated a relationship between HuR binding targets and regulation of stability, the strongest relationships were apparent when both the HuR RNA targets and the global stability changes were determined under identical conditions.
DISCUSSION
Our data indicate that Jurkat cells undergo substantial transcriptional and post-transcriptional regulatory dynamics following activation that coordinately influences the abundance of important functional groups of mRNAs. Using this dynamic model system, we found that both mRNA transcription and stability cooperate to maximize the efficiency of regulation. Moreover, the responses to HuR binding under identical conditions in these cells suggests a potential cause and effect relationship leading to the stabilization of specific mRNAs encoding proteins important to Jurkat cell activation.
We found that the regulation of mRNA stability occurs among functionally related groups, the core of the post-transcriptional regulon hypothesis previously proposed from our group (37). Interestingly, this regulation occurred in functional groups that are crucial to major cellular processes such as cell replication, protein translation and cellular movement. This expands greatly on the previously established immune regulatory factors studied in the context of T cell activation. Post-transcriptional events are important for tuning or ‘fine tuning’ the expression of these genes to meet cell requirements, an observation previously noted (16). One of these vital functional groups found to be quite robust is the histone mRNAs, a classical post-transcriptional regulon (34) (Figure 5). Histone mRNAs require coordinated regulation to promote cell replication, and therefore contain similar sequences and structural characteristics to engage binding by a common Stem-Loop Binding Protein, SLBP, that controls its export, stabilization and translation (35). The stability of histone mRNAs is tightly coupled to DNA replication and S phase (36), thus, a pause in Jurkat cellular replication may occur through a signaling cascade immediately upon mitogenic stimulation. Since activation is to some extent a proliferative process, the response could be rapidly reversed in the second hour to drive the production of histones. The decrease in SLBP protein during the first hour, as shown in Figure 5, supports this model. During the second hour, however, histone mRNAs are more stabilized than the recovering abundance of SLBP appears to indicate. This potentially hints that another mechanism may contribute to histone stabilization. This mechanism may include SLBP phosphorylation, localization or binding by another RBP factor. Overall, however, these histone mRNAs exemplify the coordinated regulation of mRNA stability by RBPs in this system.
Similar published examples of tight coupling between RBP binding and functional RNA regulation have been relatively sparse in this era of global targeting studies of RBPs. However, we demonstrate another example of tight coupling in this study. We integrated our direct calculations of mRNA stability with the targeting of HuR from replicated RIP experiments under the identical conditions (19). We observed strong functional correlations with targets bound to HuR at the same time point. In fact, the data suggest binding by HuR imparts ≈25% greater stability, on average, for these specific targets (Figure 7). Importantly, we did not find that HuR mRNA targets identified in Jurkat cells at time points other than 4 h were significantly stabilized. These regulatory dynamics in HuR occurred despite no change in protein abundance (unpublished observations) or localization (19). It is likely post-translational modifications such as phosphorylation play a role in these regulatory dynamics, as has been shown for HuR in other cell models (39,40).
Additionally, we were able to integrate other published HuR target data sets from other cell types using a variety of methods, including RIP, iCLIP and PAR-CLIP studies, none of which involved T cell activation. Each technique defined a set of targets that, while U-rich, varied in number and composition of their genes of origin. For example, previous studies using HEK293 cells have shown that genes that overlap between multiple technical approaches have the strongest functional relationship under HuR knockdown (24). However, data in this study further show that cellular context is very important in interpreting the relationship between binding and function. In other words, the best correlation between global binding and regulation occurred when using identical temporal and biological conditions.
Previous studies have emphasized a larger and wide-spread role of post-transcriptional regulation in T cell activation systems than we observed (2,5,10). One major factor may be the T cell type used; indeed, other reports have indicated differences in global RNA stability between primary T cells and malignant T cell lines (41). It is unclear, however, whether the discrepancies between this study and other is primarily because of differences in cell type (Jurkat T cells versus primary T cells), time course studied or methodological approaches. One previous study utilizing the same Jurkat T cells with chemical activation reported a much broader influence of post-transcriptional regulation than we observe even though a shorter time frame was used (2). In this case, methodological differences seem to underlie much of this discrepancy. First, the array technology used did not include genes we found important such histones. Second, ‘newly transcribed’ RNA was isolated using a nuclear run-on assay, a cell invasive method that strips the cell of its native context. Furthermore, post-transcriptional changes were defined as varying between nuclear run-on and total mRNA. The 4sU metabolic labeling approach is advantageous in that cells remain unperturbed until RNA harvest and modeling of the interaction between transcribed and total mRNA discerns post-transcriptional differences with high sensitivity. Additional studies have measured decay of mRNA with inhibition of transcription (5). One major difference in analyzing transcriptional inhibition and metabolic labeling-based approaches as we have done here is that metabolic labeling is retrospective while transcriptional inhibition is prospective. For example, a 1 h time point in 4sU metabolic labeling measures transcription during the first hour of activation, while inhibiting transcription at 1 h measures the decay of mRNAs present over the following 2–4 h. This can lead to major differences among mRNAs in which decay rate varies over these intervals. For these reasons, clear switches in decay rate, such as we observed for RNF145 and DDX3X, represent the most consistent examples of post-transcriptional regulation (Figure 3, Supplementary Table S1). We observed several other examples of transient changes in RNA decay rate using 4sU metabolic labeling that were more difficult to replicate through inhibition of transcription, including the rapid transitions observed in histone mRNAs (Figure 5, Supplementary Table S1 and data not shown). These discrepancies may also result from the possibility that post-transcriptional events depend on the transcriptional induction of post-transcriptional factors such as RBPs or miRNAs (42).
There are several important caveats to consider when interpreting data using the 4sU metabolic labeling that are consistent with our study being conservative in defining post-transcriptional regulation. First, it is important to recognize that some labeled RNA decays over the 1 h period of labeling. As such, the true transcription rate requires a correction for decay, which is the reason labeled mRNA is carefully termed ‘net transcription’. This fact can bias results slightly toward favoring changes in transcription rate over RNA stability changes, and is overall conservative for attribution of gene expression changes to mRNA stability. For example, the moderate decline in net transcription in RNF145 (Figure 3) may be, in part, a result of the increased decay rate. However, this is not likely to be a large factor in our global analysis demonstrating cooperation between transcription and decay for two reasons: first, the effect is modest, and second, previous studies in yeast using the same 4sU metabolic labeling approach identified the opposite phenomenon in osmotic shock (13). One biological rationale for these contrasting relationships between transcription and decay, other than a major species difference, may be that osmotic shock is a transient cellular stress while mitogenic stimulation of Jurkat cells causes a permanent developmental change in cellular growth, behavior and morphology.
Additionally, analysis of 4sU metabolic labeling requires accurate measurement of gene expression, and therefore, we have omitted genes that varied substantially between replicates. The major reason for this variation was low expression at any of the time points. As expected, this included many highly induced genes and immunoreactive genes with low baseline expression that have been the focus of many prior candidate studies of post-transcriptional regulation (6–10). Indeed, highly inducible mRNAs have been identified as a class that are subject to dynamic regulation of mRNA stability (15). Furthermore, differences in decay rates between genes have long been understood to affect regulatory dynamics, because the rate with which gene expression can change depends on how rapidly the mRNA is turned over (43). Thus, we would expect that the most highly inducible genes are the most likely to undergo post-transcriptional regulation. However, because of low expression prior to their induction, we were unable to draw conclusions about their post-transcriptional regulation during Jurkat activation. A candidate approach is likely the best way to characterize these genes, as has already been done in many cases (6–10).
This study focused on describing one aspect of the post-transcriptional regulatory code, the regulation of mRNA stability by RBPs or combinations of RBPs. We observed the coordinated post-transcriptional regulation of functional groups crucial to the activation process. The post-transcriptional regulon model hypothesizes different combinations of RBPs and noncoding RNAs regulate these distinct functional groups. In this study, we highlighted one RBP, HuR, that significantly correlated with stabilization of mRNA. Undoubtedly, activation of Jurkat cells is a highly complex process that involves regulation by many different RBPs. Indeed, our evidence suggests that a number of other RBPs must be involved in mRNA stabilization in activated Jurkat cells, as HuR interacted with a minority of mRNAs that were significantly stabilized (31 of 143 comparable genes). Extrapolating more broadly, most other post-transcriptional processes such as destabilization, splicing, export and translation are likewise regulated by combinations of multiple RBPs.
Our experimental design in this study is an appealing approach with which to discover the novel involvement of RBPs in a given system, i.e. correlation of the RBP's targets with measurement of global post-transcriptional responses of mRNAs. By cross-referencing a database of RBPs and their targets to post-transcriptional regulatory changes such as RNA stability, one could imagine identifying RBP candidates with strong correlations to specific regulatory processes. We showed in this study that in the case of HuR, RBP binding significantly correlates with mRNA stabilization across a variety of techniques to identify bound mRNAs. Importantly, and not unexpectedly, we also showed that by a significant margin, the strongest correlation occurs with targets identified at identical time points. When we attempted to predict novel stability regulation by RBPs using published RIP, CLIP and PAR-CLIP data that were obtained under differing biological cell types or conditions, we obtained inconclusive results (data not shown). One observation from this effort was that the inability to meaningfully stratify RBP target data using CLIP and PAR-CLIP hindered the approach, suggesting that quantitative measurements that stratify binding sites may improve these comparisons. Ultimately, however, it is not at all surprising that the relationship between binding and functional regulation was strongest under identical cellular conditions. Therefore, with current techniques, it is difficult to reach meaningful biological conclusions by integrating post-transcriptional data from different cellular conditions. While this potentially limits the application of the experimental design demonstrated in this study as a discovery tool, on the contrary, this approach is highly advantageous for quantifying the impact of specific candidate RBPs in dynamic systems.
DATA AVAILABILITY
Full raw data to the Gene Expression Omnibus (GEO) database and can be accessed using accession number GSE71382. Full processed data are available as a Supplementary Table.
Supplementary Material
Acknowledgments
We would like to thank Matt Friedersdorf for discussions of experimental design and critique of the manuscript. We would also like to thank Neelanjan Mukherjee, Marshall Thompson and Kyle Mansfield for helpful discussions. Finally, we acknowledge Bill Marzluff for helpful consultations and providing samples of anti-SLBP antibody.
SUPPLEMENTARY DATA
Supplementary Data are available at NAR Online.
FUNDING
Duke Interdisciplinary Research Training Program in AIDS [5T32AI007392 to J.B.]; National Cancer Institute [R01 CA157268 to J.D.K.]; National Science Foundation [0842621 to J.D.K.]. Funding for open access charge: Duke Compact for Open Access Publishing Equity or Self.
Conflict of interest statement. None declared.
REFERENCES
- 1.Beisang D., Rattenbacher B., Vlasova-St Louis I.A., Bohjanen P.R. Regulation of CUG-binding protein 1 (CUGBP1) binding to target transcripts upon T cell activation. J. Biol. Chem. 2012;287:950–960. doi: 10.1074/jbc.M111.291658. [DOI] [PMC free article] [PubMed] [Google Scholar]
- 2.Cheadle C., Fan J., Cho-Chung Y.S., Werner T., Ray J., Do L., Gorospe M., Becker K.G. Control of gene expression during T cell activation: alternate regulation of mRNA transcription and mRNA stability. BMC Genomics. 2005;6:75–90. doi: 10.1186/1471-2164-6-75. [DOI] [PMC free article] [PubMed] [Google Scholar]
- 3.Lam L.T., Pickeral O.K., Peng A.C., Rosenwald A., Hurt E.M., Giltnane J.M., Averett L.M., Zhao H., Davis R.E., Sathyamoorthy M., et al. Genomic-scale measurement of mRNA turnover and the mechanisms of action of the anti-cancer drug flavopiridol. Genome Biol. 2001;2 doi: 10.1186/gb-2001-2-10-research0041. RESEARCH0041. [DOI] [PMC free article] [PubMed] [Google Scholar]
- 4.Martinez N.M., Lynch K.W. Control of alternative splicing in immune responses: many regulators, many predictions, much still to learn. Immunol. Rev. 2013;253:216–236. doi: 10.1111/imr.12047. [DOI] [PMC free article] [PubMed] [Google Scholar]
- 5.Raghavan A., Ogilvie R.L., Reilly C., Abelson M.L., Raghavan S., Vasdewani J., Krathwohl M., Bohjanen P.R. Genome-wide analysis of mRNA decay in resting and activated primary human T lymphocytes. Nucleic Acids Res. 2002;30:5529–5538. doi: 10.1093/nar/gkf682. [DOI] [PMC free article] [PubMed] [Google Scholar]
- 6.Taylor G.A., Carballo E., Lee D.M., Lai W.S., Thompson M.J., Patel D.D., Schenkman D.I., Gilkeson G.S., Broxmeyer H.E., Haynes B.F., et al. A pathogenetic role for TNF alpha in the syndrome of cachexia, arthritis, and autoimmunity resulting from tristetraprolin (TTP) deficiency. Immunity. 1996;4:445–454. doi: 10.1016/s1074-7613(00)80411-2. [DOI] [PubMed] [Google Scholar]
- 7.Chang C.-H., Curtis J.D., Maggi L.B. Jr, Faubert B., Villarino A.V., O'Sullivan D., Huang S.C.-C., van der Windt G.J.W., Blagih J., Qiu J., et al. Posttranscriptional control of T cell effector function by aerobic glycolysis. Cell. 2013;153:1239–1251. doi: 10.1016/j.cell.2013.05.016. [DOI] [PMC free article] [PubMed] [Google Scholar]
- 8.Stoecklin G., Tenenbaum S.A., Mayo T., Chittur S.V., George A.D., Baroni T.E., Blackshear P.J., Anderson P. Genome-wide analysis identifies interleukin-10 mRNA as target of tristetraprolin. J. Biol. Chem. 2008;283:11689–11699. doi: 10.1074/jbc.M709657200. [DOI] [PMC free article] [PubMed] [Google Scholar]
- 9.Leppek K., Schott J., Reitter S., Poetz F., Hammond M.C., Stoecklin G. Roquin promotes constitutive mRNA decay via a conserved class of stem-loop recognition motifs. Cell. 2013;153:869–881. doi: 10.1016/j.cell.2013.04.016. [DOI] [PubMed] [Google Scholar]
- 10.Schott J., Stoecklin G. Networks controlling mRNA decay in the immune system. WIREs RNA. 2010;1:432–456. doi: 10.1002/wrna.13. [DOI] [PubMed] [Google Scholar]
- 11.Dölken L., Ruzsics Z., Rädle B., Friedel C.C., Zimmer R., Mages J., Hoffmann R., Dickinson P., Forster T., Ghazal P., et al. High-resolution gene expression profiling for simultaneous kinetic parameter analysis of RNA synthesis and decay. RNA. 2008;14:1959–1972. doi: 10.1261/rna.1136108. [DOI] [PMC free article] [PubMed] [Google Scholar]
- 12.Friedel C.C., Dolken L., Ruzsics Z., Koszinowski U.H., Zimmer R. Conserved principles of mammalian transcriptional regulation revealed by RNA half-life. Nucleic Acids Res. 2009;37:e115. doi: 10.1093/nar/gkp542. [DOI] [PMC free article] [PubMed] [Google Scholar]
- 13.Miller C., Schwalb B., Maier K., Schulz D., Dumcke S., Zacher B., Mayer A., Sydow J., Marcinowski L., Dölken L., et al. Dynamic transcriptome analysis measures rates of mRNA synthesis and decay in yeast. Mol. Syst. Biol. 2011;7:458–470. doi: 10.1038/msb.2010.112. [DOI] [PMC free article] [PubMed] [Google Scholar]
- 14.Paulsen M.T., Veloso A., Prasad J., Bedi K., Ljungman E.A., Tsan Y.-C., Chang C.-W., Tarrier B., Washburn J.G., Lyons R., et al. Coordinated regulation of synthesis and stability of RNA during the acute TNF-induced proinflammatory response. Proc. Natl. Acad. Sci. U.S.A. 2013;110:2240–2245. doi: 10.1073/pnas.1219192110. [DOI] [PMC free article] [PubMed] [Google Scholar]
- 15.Rabani M., Levin J.Z., Fan L., Adiconis X., Raychowdhury R., Garber M., Gnirke A., Nusbaum C., Hacohen N., Friedman N., et al. Metabolic labeling of RNA uncovers principles of RNA production and degradation dynamics in mammalian cells. Nat. Biotechnol. 2011;29:436–442. doi: 10.1038/nbt.1861. [DOI] [PMC free article] [PubMed] [Google Scholar]
- 16.Rabani M., Raychowdhury R., Jovanovic M., Rooney M., Stumpo D.J., Pauli A., Hacohen N., Schier A.F., Blackshear P.J., Friedman N., et al. High-resolution sequencing and modeling identifies distinct dynamic RNA regulatory strategies. Cell. 2014;159:1698–1710. doi: 10.1016/j.cell.2014.11.015. [DOI] [PMC free article] [PubMed] [Google Scholar]
- 17.Payne T.L., Blackinton J., Frisbee A., Pickeral J., Sawant S., Vandergrift N.A., Freel S.A., Ferrari G., Keene J.D., Tomaras G.D. Transcriptional and posttranscriptional regulation of cytokine gene expression in HIV-1 antigen-specific CD8+ T cells that mediate virus inhibition. J. Virol. 2014;88:9514–9528. doi: 10.1128/JVI.00802-14. [DOI] [PMC free article] [PubMed] [Google Scholar]
- 18.Moon S.L., Blackinton J.G., Anderson J.R., Dozier M.K., Dodd B.J.T., Keene J.D., Wilusz C.J., Bradrick S.S., Wilusz J. XRN1 stalling in the 5′ UTR of Hepatitis C virus and Bovine Viral Diarrhea virus is associated with dysregulated host mRNA stability. PLoS Pathogens. 2015;11:e1004708. doi: 10.1371/journal.ppat.1004708. [DOI] [PMC free article] [PubMed] [Google Scholar]
- 19.Mukherjee N., Lager P.J., Friedersdorf M.B., Thompson M.A., Keene J.D. Coordinated posttranscriptional mRNA population dynamics during T-cell activation. Mol. Syst. Biol. 2009;5:288–301. doi: 10.1038/msb.2009.44. [DOI] [PMC free article] [PubMed] [Google Scholar]
- 20.Levine T.D., Gao F., King P.H., Andrews L.G., Keene J.D. Hel-N1: an autoimmune RNA-binding protein with specificity for 3′ uridylate-rich untranslated regions of growth factor mRNAs. Mol. Cell. Biol. 1993;13:3494–3504. doi: 10.1128/mcb.13.6.3494. [DOI] [PMC free article] [PubMed] [Google Scholar]
- 21.Gallouzi I.E., Russ B.E., Stenberg M.G., Swanson M.S., Eversole A., Maizels N., Steitz J.A. HuR binding to cytoplasmic mRNA is perturbed by heat shock. Proc. Natl. Acad. Sci. U.S.A. 2000;97:3073–3078. doi: 10.1073/pnas.97.7.3073. [DOI] [PMC free article] [PubMed] [Google Scholar]
- 22.Gao F.B., Carson C.C., Levine T., Keene J.D. Selection of a subset of mRNAs from combinatorial 3′ untranslated region libraries using neuronal RNA-binding protein Hel-N1. Proc. Natl. Acad. Sci. U.S.A. 1994;91:11207–11211. doi: 10.1073/pnas.91.23.11207. [DOI] [PMC free article] [PubMed] [Google Scholar]
- 23.Tenenbaum S.A., Carson C.C., Lager P.J., Keene J.D. Identifying mRNA subsets in messenger ribonucleoprotein complexes by using cDNA arrays. Proc. Natl. Acad. Sci. U.S.A. 2000;97:14085–14090. doi: 10.1073/pnas.97.26.14085. [DOI] [PMC free article] [PubMed] [Google Scholar]
- 24.Mukherjee N., Corcoran D.L., Nusbaum J.D., Reid D.W., Georgiev S., Hafner M., Ascano M., Tuschl T., Ohler U., Keene J.D. Integrative regulatory mapping indicates that the RNA-binding protein HuR couples pre-mRNA processing and mRNA stability. Mol. Cell. 2011;43:327–339. doi: 10.1016/j.molcel.2011.06.007. [DOI] [PMC free article] [PubMed] [Google Scholar]
- 25.Mukherjee N., Jacobs N.C., Hafner M., Kennington E.A., Nusbaum J.D., Tuschl T., Blackshear P.J., Ohler U. Global target mRNA specification and regulation by the RNA-binding protein ZFP36. Genome Biol. 2014;15:R12. doi: 10.1186/gb-2014-15-1-r12. [DOI] [PMC free article] [PubMed] [Google Scholar]
- 26.Kim D., Pertea G., Trapnell C., Pimentel H., Kelley R., Salzberg S.L. TopHat2: accurate alignment of transcriptomes in the presence of insertions, deletions and gene fusions. Genome Biol. 2013;14:R36. doi: 10.1186/gb-2013-14-4-r36. [DOI] [PMC free article] [PubMed] [Google Scholar]
- 27.Anders S., Pyl P.T., Huber W. HTSeq–a Python framework to work with high-throughput sequencing data. Bioinformatics. 2015;31:166–169. doi: 10.1093/bioinformatics/btu638. [DOI] [PMC free article] [PubMed] [Google Scholar]
- 28.Robinson M.D., McCarthy D.J., Smyth G.K. edgeR: a Bioconductor package for differential expression analysis of digital gene expression data. Bioinformatics. 2010;26:139–140. doi: 10.1093/bioinformatics/btp616. [DOI] [PMC free article] [PubMed] [Google Scholar]
- 29.Ernst J., Bar-Joseph Z. STEM: a tool for the analysis of short time series gene expression data. BMC Bioinformatics. 2006;7:191. doi: 10.1186/1471-2105-7-191. [DOI] [PMC free article] [PubMed] [Google Scholar]
- 30.Rattenbacher B., Bohjanen P.R. Evaluating posttranscriptional regulation of cytokine genes. Methods Mol. Biol. 2011;820:71–89. doi: 10.1007/978-1-61779-439-1_5. [DOI] [PMC free article] [PubMed] [Google Scholar]
- 31.Keene J.D. RNA regulons: coordination of post-transcriptional events. Nat. Rev. Genet. 2007;8:533–543. doi: 10.1038/nrg2111. [DOI] [PubMed] [Google Scholar]
- 32.Blackinton J.G., Keene J.D. Post-transcriptional RNA regulons affecting cell cycle and proliferation. Semin. Cell Dev. Biol. 2014;34:44–54. doi: 10.1016/j.semcdb.2014.05.014. [DOI] [PMC free article] [PubMed] [Google Scholar]
- 33.Masopust D., Schenkel J.M. The integration of T cell migration, differentiation and function. Nat. Rev. Immunol. 2013;13:309–320. doi: 10.1038/nri3442. [DOI] [PubMed] [Google Scholar]
- 34.Townley-Tilson W.H.D., Pendergrass S.A., Marzluff W.F., Whitfield M.L. Genome-wide analysis of mRNAs bound to the histone stem-loop binding protein. RNA. 2006;12:1853–1867. doi: 10.1261/rna.76006. [DOI] [PMC free article] [PubMed] [Google Scholar]
- 35.Marzluff W.F., Wagner E.J., Duronio R.J. Metabolism and regulation of canonical histone mRNAs: life without a poly(A) tail. Nat. Rev. Genet. 2008;9:843–854. doi: 10.1038/nrg2438. [DOI] [PMC free article] [PubMed] [Google Scholar]
- 36.Marzluff W.F., Duronio R.J. Histone mRNA expression: multiple levels of cell cycle regulation and important developmental consequences. Curr. Opin. Cell Biol. 2002;14:692–699. doi: 10.1016/s0955-0674(02)00387-3. [DOI] [PubMed] [Google Scholar]
- 37.Keene J.D., Tenenbaum S.A. Eukaryotic mRNPs may represent posttranscriptional operons. Mol. Cell. 2002;9:1161–1167. doi: 10.1016/s1097-2765(02)00559-2. [DOI] [PubMed] [Google Scholar]
- 38.Uren P.J., Burns S.C., Ruan J., Singh K.K., Smith A.D., Penalva L.O.F. Genomic analyses of the RNA-binding protein Hu antigen R (HuR) identify a complex network of target genes and novel characteristics of its binding sites. J. Biol. Chem. 2011;286:37063–37066. doi: 10.1074/jbc.C111.266882. [DOI] [PMC free article] [PubMed] [Google Scholar]
- 39.Yoon J.-H., Abdelmohsen K., Srikantan S., Guo R., Yang X., Martindale J.L., Gorospe M. Tyrosine phosphorylation of HuR by JAK3 triggers dissociation and degradation of HuR target mRNAs. Nucleic Acids Res. 2014;42:1196–1208. doi: 10.1093/nar/gkt903. [DOI] [PMC free article] [PubMed] [Google Scholar]
- 40.Doller A., Akool E.-S., Huwiler A., Müller R., Radeke H.H., Pfeilschifter J., Eberhardt W. Posttranslational modification of the AU-rich element binding protein HuR by protein kinase Cdelta elicits angiotensin II-induced stabilization and nuclear export of cyclooxygenase 2 mRNA. Mol. Cell. Biol. 2008;28:2608–2625. doi: 10.1128/MCB.01530-07. [DOI] [PMC free article] [PubMed] [Google Scholar]
- 41.Vlasova I.A., McNabb J., Raghavan A., Reilly C., Williams D.A., Bohjanen K.A., Bohjanen P.R. Coordinate stabilization of growth-regulatory transcripts in T cell malignancies. Genomics. 2005;86:159–171. doi: 10.1016/j.ygeno.2005.04.013. [DOI] [PubMed] [Google Scholar]
- 42.Mansfield K.D., Keene J.D. The ribonome: a dominant force in co-ordinating gene expression. Biol. Cell. 2009;101:169–181. doi: 10.1042/BC20080055. [DOI] [PMC free article] [PubMed] [Google Scholar]
- 43.Hao S., Baltimore D. The stability of mRNA influences the temporal order of the induction of genes encoding inflammatory molecules. Nat. Immunol. 2009;10:281–288. doi: 10.1038/ni.1699. [DOI] [PMC free article] [PubMed] [Google Scholar]
Associated Data
This section collects any data citations, data availability statements, or supplementary materials included in this article.
Supplementary Materials
Data Availability Statement
Full raw data to the Gene Expression Omnibus (GEO) database and can be accessed using accession number GSE71382. Full processed data are available as a Supplementary Table.