


Abstract
Synthetic biology seeks to envision living cells as a matter of engineering. However, increasing evidence suggests that the genetic load imposed by the incorporation of synthetic devices in a living organism introduces a sort of unpredictability in the design process. As a result, individual part characterization is not enough to predict the behavior of designed circuits and thus, a costly trial-error process is eventually required. In this work, we provide a new theoretical framework for the predictive treatment of the genetic load. We mathematically and experimentally demonstrate that dependences among genes follow a quantitatively predictable behavior. Our theory predicts the observed reduction of the expression of a given synthetic gene when an extra genetic load is introduced in the circuit. The theory also explains that such dependence qualitatively differs when the extra load is added either by transcriptional or translational modifications. We finally show that the limitation of the cellular resources for gene expression leads to a mathematical formulation that converges to an expression analogous to the Ohm's law for electric circuits. Similitudes and divergences with this law are outlined. Our work provides a suitable framework with predictive character for the design process of complex genetic devices in synthetic biology.
INTRODUCTION
The construction of genetic devices able to perform complex tasks and decision-making processes is a major challenge of synthetic biology. In a building-up approach, synthetic devices are composed of several interconnected modules that must be designed in order to work coherently with the rest of the system. Following an engineering perspective, synthetic biology pursues the implementation of complex genetic behaviors by means of a rational design according to principles of abstraction, standardization and modularity (1). Based on these principles, the behavior of a genetic device should be predictable from the individual characterizations of their composing parts (2–7). However, increasing evidence suggests that knowledge of the whole system cannot be inferred only from the sum of their parts. This fact makes it difficult to achieve the desired predictability in the engineering process (8,9) giving rise to one of the major limitations that hinders the advance of synthetic biology.
Among the possible causes limiting the development of synthetic and biotechnological applications, the so-called metabolic burden is a usual suspect (9–12). Mounting evidence shows that the expression of a foreign gene causes a cellular stress that negatively affects the expression of the other genes, as well as the growth rate of the cell (12–17). According to this, by increasing the genetic load the expected behavior of a given genetic part would be affected by the addition of other parts, even when there are no direct interactions among them.
Gene expression depends on a common pool of cellular resources that must be shared with all of the cell's genetic demands (15,18). Recent experimental and theoretical evidence (13,17,19,20) indicates that this constraint introduces a higher order of dependencies in gene expression. In consequence, the design of reliable genetic devices must take into account this effect in the characterization of the composing parts. However, a general theoretical framework accounting for the effects of limited cellular resources in gene expression is still lacking.
Our work presents a new mathematical formalization of gene expression constrained by cellular resources. Our results demonstrate that when the demand of cellular resources grows due to an increasing number of modules involved in a genetic device, the reduction in the response levels of these modules is governed by equations similar to those of the so-called Ohm's law. In electric circuits, this law describes the dependence between electric loads (i.e. resistances) and voltage. Analogously, we show that the dependence between genetic loads and gene expression is governed by the same principle in genetic systems. For an experimental validation of our theoretical results, we built a library of genetic circuits using the parts registry repository (http://parts.igem.org/Main_Page) (21–23). In order to directly monitor the expression levels, our circuits are composed of different modules expressing fluorescent proteins. Even though circuits were designed to be orthologous, our results reveal that they are linked by the effect of the genetic load as predicted by the theoretical framework presented here.
MATERIALS AND METHODS
Bacterial strains and growth conditions
Cloning and expression experiments were performed in Escherichia coli Top10 (F- mcrA Δ(mrr-hsdRMS-mcrBC) φ80lacZΔM15 ΔlacX74 nupG recA1 araD139 Δ(ara-leu)7697 galE15 galK16 rpsL(StrR) endA1 λ−; from Invitrogen, USA) except the experiment of Figure 3C that was performed in E. coli ZN1 (LacIq PN25-tetR SpR F− endA1 glnV44 thi-1 recA1 relA1 gyrA96 (NacR) deoR nupG Φ80dlacZΔM15 Δ(lacZYA-argF)U169, hsdR17(rK− mK+), λ−; from Espressys, Germany) due to its constitutive expression of Tet receptor. Bacterial strains containing the constructs were preserved in Lysogeny Broth (LB) glycerol 20% (v/v) at −80°C. Plates with the colonies used in the experiments were obtained from the growth of the glycerol stocks on LB agar plates at 37°C overnight and selected with appropriate antibiotics (chloramphenicol 340 μg/ml; kanamycin 250 μg/ml; or ampicilin 100 μg/ml; Sigma, USA) (7).
Figure 3.

Linear dependence between two genetic loads at the transcriptional level. Three scenarios that were explored: (A) increasing gene copy number from one up to eight copies of rfp gene together with increasing promoter strength using a library of promoters; (B) Lux-inducible system; and (C) Tet-On-inducible system. Correlations between RFP and GFP (GFP/RFP charts) are shown in the larger plots, together with a schematic representation of the transcriptional tuning scenario implemented. Transfer functions (e.g. expression levels for different number of gene copies, promoter strengths and inducer concentrations) for both fluorescent proteins are presented in the smaller rectangular plots of each scenario. In GFP/RFP charts, mean values are represented in black circles with s.d. bars. Individual replicates are depicted by either white circles (B and C) or in brown and yellow ones (A, for different gene copy number and promoter strength respectively). Linear correlations calculated with the least squares method are shown and correlation coefficients (R2) are included, as well as the linear equation in (A).
Building of the genetic constructs
Cloning was carried out using the Biobrick assembly method and the parts from the Spring 2010 iGEM distribution. The Biobrick parts used in this study and its characteristics are shown in Supplementary Table S2. All the constructs analyzed in this paper were built by combining these parts. Biobrick cloning was performed using an assembly kit (Ginkgo Bioworks, USA) (22,23). Constructs used in Figure 2 were built by adding an increasing number of copies of a red fluorescent protein (RFP) reporter gene (see Supplementary Table S3, constructs cp1–8). The rest of constructs used in this paper are comprised of two reporters, the green fluorescent protein (GFP) and the red fluorescent one. On one hand, the gfp expression is kept constant under a constitutive promoter (pm100) expressing a GFP modulated by a medium RBS (R32), and this part is shared for all the constructs. Thus, GFP expression is the control variable that we monitor in order to see how changes in RFP expression (the tuneable reporter) affect this a priori independent part of the circuit. On the other hand, we have several types of the other tuneable reporter (RFP) depending on the way in which we want to tune the expression of the rfp gene (see the rest of the constructs in Supplementary Table S3 and the different approaches to tune RFP expression in Figures 2–4). Among these tuning mechanisms, a library of promoters and RBSs from the PartsRegistry repository (23) was used, as well as metabolite-inducible systems such as the Lux and the Tet-ON.
Figure 2.

Experimental evidences of genetic loads behaving as electric loads do when connected in a series in electric circuits. (A) Schematic representation of the experimental setup. (B) Top: Analysis of plasmid and insert sizes done by gel electrophoresis after restriction digestion corresponding to the synthetic constructs involving an increasing number of rfp genes (i.e. identical units of constitutive promoter + RBS + ORF codifying RFP) up to eight copies. Band at 3.1 Kbp corresponds to the linearized pSB1AK3 plasmid of all constructs. The second band corresponds to the insert sizes according to the increasing number of rfp copies (see ‘Mathematical appendix’ section, Supplementary Table S3 and Supplementary Figure S2 for further details). Bottom: Experimental RFP fluorescence measurements (open circles) at the steady state fairly agrees (R2 = 0.9926) with the model (solid line). (C) Analogous electric circuit involving an increasing number of identical resistances connected in a series. (D) Response of an equivalent electric circuit and its general mathematical expression.
Figure 4.

Dependence between two genetic loads at the translational level. Two different scenarios were implemented: (A) Library of circuits with RBSs with different strengths. Larger plot depicts the GFP-RFP non-linear correlation together with the fitting obtained according to model equation (5) and a schematic representation of the scenario implemented. Smaller plots depict levels of RFP and GFP expression for each of the five constructs tested. (B) Transcriptional–translational combined scenario based on two versions of a lactone-inducible systems differing in their RBS modulating the RFP (Lux(32) and Lux(33)). Linear correlations for the two lactone-inducible systems studied are presented, exhibiting different slope (larger plot). Transfer functions for the two reporters of each construct are shown. Mean values are represented in filled circles with s.d. bars and individual replicates in open circles. Linear correlations calculated with the least squares method are shown and correlation coefficients (R2) are included.
All constructs were included in the Biobricks high copy number plasmids (7) (pSB1AK3 and pSB1AC3) and transformed by chemical method. The pSB1AK3 was the plasmid used for virtually all the experiments, with the sole exception of the experiments tuning RBS (Figure 4A), which were done using a pSB1AC3. In all the experiments, cells bearing either pSB1AK3 or pSB1AC3 plasmids were used as negative controls for fluorescence measurements. All the constructs were verified by analytical gel digestion and confirmed by Sanger sequencing. In the case of the constructs with many copies of rfp, the single copy was sequenced and the other constructs with more than one copy were confirmed by analytical gel digestion (see Supplementary Figure S2). Further information regarding the constructs and its main characteristics is also included in Supplementary Table S3.
Fluorescence assays for gene expression determination
Experiments started from colonies grown in LB agar plates. A high dilution (106-fold) of the colony was grown overnight in LB ampicillin in a 200 μl well, at 37°C and with continuous shaking. In the experiments with signal induction, LB ampicillin was supplemented with the desired inducer concentrations, either lactone 3OC6HSL (N-[β-ketocaproyl]-L-homoserine lactone; Cayman Chemical Company, USA) or Anhydrotetracycline hydrochloride (aTc: C22H22N2O7-HCl; Sigma-Aldrich, USA). Then, a 50-fold dilution from the overnight culture was grown until exponential phase (OD660 ≈ 0.3–0.6) in the same conditions but with the other antibiotic to which cells were resistant, either chloramphenicol or kanamycin, in order to avoid any possible contamination. Finally, incubation for in vivo measures was carried out by transferring 50 μl of the diluted cultures and 150 μl of fresh LB ampicillin into a flat bottom 96-well microplate (Nunc, Thermo Fisher Scientific, USA). In the induction experiments this fresh LB ampicillin was supplemented again with the appropriate induction signal concentrations: 3OC6HSL for the Lux transcriptional induction and aTc for the Tet-ON induction system. LB without cells was included in the incubation as a background control for both fluorescence and absorbance.
Gene expression was monitored over time by measuring the two reporters (fluorescent proteins) used in this study. Incubation and measures of bacterial cultures during characterization were performed on a Synergy MX microplate reader (BioTek Instruments, USA) every 10 min for 14 h. Fluorescence measures for RFP (ex: 578 ± 9 nm, em: 616 ± 9 nm) and GFP (ex: 478 ± 9 nm, em: 516 ± 9 nm) with gain 75 were carried out, as well as optical density (OD at 660 nm) measures. Incubation was done at 37°C with continuous orbital shaking. 3OC6HSL concentration conditions were prepared from an initial stock at 10−2 M (3:1, phosphate buffered saline (PBS):ethanol). Serial dilutions in LB ampicillin (or kanamycin or chloramphenicol when needed) ranging from 10−4 to 10−10 M were prepared for every step of the protocol just before the experiment. aTc concentrations were also prepared from an initial stock at 10−2 M in PBS and dilutions from this stock were prepared the same way as in the case of 3OC6HSL.
Data transformation
Sample absorbance and fluorescence readings (OD660 (S), f(S)) were corrected using signal background control (OD660(B), f(B)). The output signal (Fi) was calculated according to
 |
where Fi corresponds, with a factor of proportionality, to the concentration of the fluorescent protein i (GFP or RFP) per cell. Mean values and the standard deviation were determined from the results obtained from different single colonies.
Time series and signal variation computation
Linear regression of the correlation between GFP and RFP was calculated at every time step. Its evolution converges toward a steady state point at ∼600 min. In this work, in accordance to what has been done in previous works (22) and considering that a stabilization of R2 is observed (see Supplementary Figure S3a), the window for the final experiments acquisition was chosen at 600 min, although the behavior remained stable for several hours. Furthermore, the evolution of the slope and the intercept were also monitored over time and, as it can be seen in Supplementary Figures S3b and c, both also stabilized at a similar time step, thus reinforcing the 600 min as the more appropriate choice.
RESULTS
In our theoretical formalism—detailed in the ‘Mathematical appendix’ section—genes are represented as loads in the cell, defined by their genetic traits and also conditioned by the limited cellular resources (Figure 1A). For the sake of simplicity, we assume that genes are transcribed into mRNAs, which in turn are translated into proteins (Figure 1B). The demand for resources is reflected by the occupation of transcriptional and translational machineries. This demand is defined by the gene sequence, in terms of its promoter strength, the number of gene copies and the ribosome binding site (RBS), among other factors. According to these premises, our mathematical model and its experimental validation are presented below.
Figure 1.

The biology of the mathematical model and its connections with the electric circuit theory. (A) A cellular system with limited number of transcriptional and translational resources, Q and S, respectively. Cell genes represent a cellular genetic load that competes for the transcriptional and translational machinery. A tunable synthetic gene (rfp) is used to introduce a new genetic load monitored by fluorescence protein (FRFP). Genetic loads are represented by β. (B) Reactions considered in this model and its respective equilibrium constants defined at the steady state. Notation: concentration of gene i (gi), mRNA concentration (mi), protein concentration (pi). Definition of β and γ parameters in terms of kinetic constants (see ‘Mathematical appendix’ section for derivation details). In red, those parameters experimentally changed in this study. (C) The diagram representing an electric circuit with a variable resistor Ri and real power supply with internal resistance R0 in a series. The difference of potential between the ends of Ri, i.e. Vi, behaves according to the Ohm's law. (D) Equivalent genetic circuit expressing a tunable rfp gene, represented with electric symbology. Protein concentration at the steady state (i.e. FRFP) depends on the total genetic load of the cell.
A genetic circuit in response to an increasing number of genetic loads behaves analogously to an electric circuit with resistances in a series connected to a real power supply
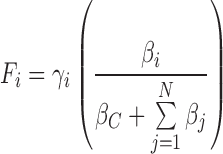
Our first goal was to develop an analytically tractable model describing gene expression at steady state, based on the competition for the limiting cellular resources. In a general scenario, we consider an organism that has a pool of available transcriptional and translational resources (QT and ST respectively) dedicated to express its M cellular genes and N foreign genes (see ‘Mathematical appendix’ section for derivation details). As a result of our mathematical formalization, given a gene of interest (gi), its expression (Fi) is described by:
 |
(1) |
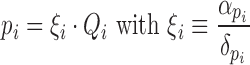
Here, γi is a constant that depends on several aspects, such as the total amount of cellular resources and the gene (gi) structure and other non-biological parameters such as fluorescence reader efficiency and gain. The term βi is the genetic load imposed by the gene gi on the cell, as determined by the promoter strength, the RBS and the coding sequence of the gene. Moreover, βC represents the genetic load associated with the M cellular genes of the host cell, which, for simplicity, can be considered invariant given a physiological state. Interestingly, Fi is proportional to the ratio between the genetic load of the gene of interest (βi) and the sum of the genetic loads of the M cellular genes (βC) and the N foreign genes ( ), including gi (see Figure 1B and ‘Mathematical appendix’ section).
As we shall demonstrate, Equation (1) is fairly similar to the Ohm's law expression applied to electric circuits, when electric loads are connected in a series to a real power supply (24). In electric circuits, the most commonly used formalization of the Ohm's law is:
 |
(2) |
This equation describes the relationship between Vi, i.e. the potential difference between the two ends of an electric load with resistance Ri, and the electric intensity, I. It should be noted that Ohm's law, when applied to a circuit in a series, can be rewritten as:
 |
(3) |
(see Figure 1C and ‘Mathematical appendix’ section). Here, Vi is a fraction of the maximum potential difference VT, defined by the relative contribution of the resistance Ri with respect to the total load of the circuit. In this equation, R0 represents the internal electric load of the real power supply (24) (see Figure 1A).
A desirable feature in the design of electric circuits is the existence of a linear dependence between Vi and Ri. However, carefully looking at Equation (3) it is easy to observe that for large Ri values the linear dependence is not satisfied, giving rise to a sub-linear behavior (see Figure 1C). Comparing the genetic Equation (1) and the electric Equation (3), notable similarities can be easily appreciated.
According to our model, and inspired by Ohm's law when applied to circuits in a series, we claim that the total genetic load of a given circuit should be the sum of the loads of each individual gene. In order to experimentally validate our claim, particularly formalized in the Equation (1), we shall consider a circuit comprising multiple copies of a reporter gene (rfp) with identical genetic loads. In this particular scenario, the expected response is given by:
 |
(4) |
(detailed derivation of Equation (4) is presented in the ‘Mathematical appendix’ section). Here,  refers to the total amount of RFP fluorescence, N is the number of copies and βRFP is the genetic load associated with a single rfp gene (see Figure 2A).
The experimental results in Figure 2B show a sub-linear dependence of gene expression when the number of copies is increased, as predicted by Equation (4). The same behavior is observed in electric circuits with N identical resistances in a series, connected to a real power supply (see Figure 2C and D and ‘Mathematical appendix’ section). Our results demonstrate that genetic load is an additive property that allows the predictability of the whole system's behavior. Furthermore, and according to Equation (3), in electric circuits the internal resistance of the real voltage source (R0) is a factor that determines the range on which the linear dependence between the potential difference (Vi) and resistance (Ri) is valid. Interestingly, βC plays the same role in genetic circuits according to Equation (4).
Our mathematical model predicts the dependence in the expression of orthologous genes similar to Ohm's law for electric loads
Going beyond the previous case, we shall now study a new scenario involving different genes with different genetic loads. Let us now consider how the expression level of a given gene is affected by the genetic load associated with other genes. As a proof of principle, we will consider a minimal scenario involving two different genes. However, a general formalization of the model that accounts for an arbitrary number of different genes is detailed in the ‘Mathematical appendix’ section. According to Ohm's law, in a circuit containing two different electric loads, R1 and R2, the potential difference between the ends of R1 depends on the potential difference between the ends of R2, following a linear relation (see ‘Mathematical appendix’ section). Therefore,
 |
(5) |
where m = VT and n = 1 in electric circuits. Remarkably, a linear relationship can also be derived from Equation (1) for the genetic counterpart when we consider a genetic circuit expressing two independent gene reporters, in our case the fluorescent proteins GFP (FGFP) and RFP (FRFP) (see ‘Mathematical appendix’ section), i.e.
 |
(6) |
where,
 |
(7) |
Equation (6) describes the relationship between the expressions of two genes that are not genetically connected. In order to assess whether changes in the genetic load of one of the genes affect the other, we shall consider a scenario in which one genetic load is kept fixed (FGFP, constitutively expressed) while the other is tuneable (FRFP). This tuning can be achieved through different transcriptional and translational mechanisms. It should be noted that the parameter a is invariant, regardless of the type of mechanisms used to tune the rfp expression. However, the slope b can be tuned via changes in translation (Equation (7)). More specifically, it depends on γRFP, which only relies on translational mechanisms (see Figure 1B). Hence, it is only when translational changes are used to tune rfp expression (e.g. modifying RBS strength) that changes in the slope can be expected.
The model predicts that transcriptional tuning of the genetic load of one gene affects in a linear way the expression of a second gene
Focusing on transcription, we tuned the rfp expression levels (FRFP) using different experimental genetic implementations. In particular, four types of circuits were constructed and characterized, namely: (i) constructs with increasing number of rfp gene copies from one up to eight, (ii) constructs with an increasing promoter strength expressing rfp, (iii) a Lux-inducible system (6,7) expressing rfp upon lactone (3OC6HSL) addition and (iv) a Tet-On inducible system (25) that also expresses rfp upon Anhydrotetracycline (aTc) addition. These different genetic implementations have a direct mapping with some key model parameters. The first one, (i), corresponds to variations in gRFP, whereas the others (ii–iv) modify ωRFP (see Figure 1B).
The experimental results for transcriptional tuning (Figure 3) reveal a strong linear correlation between FGFP and FRFP (R2 > 0.9) for all of the analyzed cases, according to Equation (6). Furthermore, the temporal evolution of R2 (Supplementary Figure S3) demonstrates that this behavior is consistent over time, up to 14 h of incubation. These results confirm that the linear correlation does not depend on the specific genetic implementation, thus suggesting the existence of a subjacent common regulatory principle.
According to Equation (6) our model predicts a linear relationship between RFP and GFP fluorescence that does not depend on the transcriptional genetic features of the tuneable gene (rfp). This prediction is confirmed by the experimental results shown in Figure 3A where two different genetic systems, namely increasing the gene copy number and different promoter strengths, exhibit the same linear behavior with the same slope and intercept. The other two inducible systems (by lactone and aTc) cannot be directly compared with the previous results due to the fact that they have a different genetic background. This is because they are either hosted by a different strain (i.e. ZN1 in the Tet-On system instead of Top10) or because of the presence of an additional gene (i.e. luxR in the lactone-inducible system) introducing a new genetic load included in the βC parameter. These genetic background differences, which in our model are translated into different βC, result in different slope and intercept values (see Figure 3B and C).
Finally, regarding the values of βRFP it is worth mentioning that these values are a function that depends on the tuning mechanism used. For instance, in the lactone inducible system, each lactone concentration corresponds to a different βRFP value. The same reasoning also applies to the aTc inducible system and to the different promoter strength system, where for each promoter sequence there is a different βRFP value. The only case where βRFP value remains constant despite the tuning on the RFP fluorescence levels is the gene copy number system, where an increase on the number of copies allows increasing the RFP fluorescence levels without modification on the βRFP.
In this scenario, our model allows the quantification of several parameters from the experimental data. This quantification does not provide the βRFP, βGFP and βRFP values but the ratios between them, i.e. βC/βRFP and βRFP/βGFP. Furthermore, parameters γRFP and γGFP can also be estimated. Nevertheless, it is important to consider that γRFP and γGFP are constant parameters involving biological aspects but also non-biological ones such as the detection efficiency of the reader or the gain used, as mentioned before. In ‘Parameters estimation and data fitting’ section in the ‘Mathematical appendix’ section, a detailed explanation about the methodology used for the quantification of these parameters is presented, as well as the parameter values.
The model predicts that translational tuning of the genetic load of one gene has a non-linear effect on the expression of a second gene
Next, we explored the effect of modifying the genetic load of the tuneable reporter rfp at the translational level by changing the RBS sequence, thus modifying translation efficiency. Our model accounts for these modifications in the expressions (6) and (7) at two different levels: (i) through changes on RFP fluorescence levels (FRFP, experimentally measurable) and (ii) by changing γRFP parameter that affects the slope. Here, it is worth noting that upon transcriptional changes only FRFP is affected trough changes on βRFP, and so the slope remains unaltered. On the contrary, translational modifications imply both changes in the FRFP fluorescence and the slope. As a consequence, the dependence between FGFP and FRFP exhibits a non-linear relationship, shown in Figure 4A. In this non-linear relationship each point corresponds to a different RBS sequence that is associated to a different γRFP value. According to our model, using the experimental data it is possible to calculate the ratio
 |
(8) |
for each RBS sequence. Here  corresponds to the strongest RBS sequence, and hence
  = 1. A notable fit between the model and the experimental data (R2 > 0.99) is shown in Figure 4A (see ‘Parameters estimation and data fitting’ section in the ‘Mathematical appendix’ section for details about the fitting).
Finally, to study the effect of combining transcriptional and translational tuning, we built two variants of the Lux inducible system, which was previously described (Figure 3B). The two variants differed only in the RBS modulating rfp translation. Our model indicates that γRFP increases with RBS strength due to its dependence on the parameter μRFP (as noted in Figure 1B), that is: the stronger the RBS, the flatter the slope. The results in Figure 4B are in accordance with model's predictions.
DISCUSSION
In this work, we provide a mathematical formalization and experimental validation of how gene expression of orthologous genes in bacteria is affected by the genetic load. Our formalization considers gene expression as a process conditioned by the availability of the cell machinery and resources required for transcription and translation (RNA polymerase, ribosomes and related factors, among others). The consequence of such a limitation is therefore the emergence of a process of competition among the different genetic requirements of the cell, namely, the genetic loads. This results in interdependence in the expression of the participant genes even when they are assumed to be orthogonal. Despite our model is focused on the competition for cellular resources, the dependences between orthologous gene expressions could also be affected by other potential interactions, for example those derived from high gene expression levels or other unknown effects. However, the predictive capability of the model with respect to the experimental results reinforces competition for cellular resources as a dominant mechanism driving gene expression.
Such a scenario of competition is not unique in cells expressing genes. Interestingly, it has also seen in electric circuits with different resistors. In our work, we show that there are strong similarities between electric circuits, governed by Ohm's law and genetic circuits. Looking at the mathematical formalization, electric systems show a sub-linear dependence between difference of potential and electric load (Equation (3)). Our formalization reveals an analogous behavior between gene expression and genetic load (Equation (1)) in genetic systems. Moreover, another shared characteristic is the existence of dependences in the response of one load, either genetic or electric, whit respect to the other ones, despite the fact that these loads are independent (Figures 3 and 4). Furthermore, an analogy between the internal resistance (R0) in electric circuits and the internal genetic load (βC) of bacterial cells can be established. In electric circuits the internal resistance of the power supply play an important role in the dependence between difference of potential and resistance. In genetic devices, our model indicates that the interdependence in the expression of orthologous genes is modulated by βC. This result suggests that these dependences can be affected (enhanced or reduced) depending on the internal genetic background of the specific strain used. Future research should be focused on the analysis of the role of the internal genetic load βC on the behavior of a given device.
However, looking closely at our model we have to note that competition in the genetic system takes place at two different levels, transcription and translation, and therefore the resulting equation is more complex than the one derived in electricity. In fact, this is reflected in the parameter γi that should correspond to VT for electric circuits. It is worth noting that in electric circuits VT can be assumed constant and independent from the characteristics of the electric loads connected, while this is not the case for γi in the genetic counterpart. The difference relies on the fact that γi depends on genetic parameters such as the copy number of plasmids or the translational parameters. This represents a significant difference with respect to Ohm's law in electric circuits. We can speculate that these limits on the analogy between electric and genetic systems are related with the circumstance that in genetic systems there are two levels of process, transcription and translation, instead of a single one as happens in electric systems. Future work should be devoted to address this issue in detail.
Our results suggest the existence of a more fundamental principle that may emerge in systems where there is competition for shared limited resources needed to perform different activities of regulation. Such systems may include the electric and the genetic one, as we have showed, but could also comprise, for instance, very different transportation systems, such as hydraulic systems (26), blood circulatory system (27) and body heat dissipation (28) that have also been described according to Ohm's law. Bearing all of this in mind, we suggest that Ohm's law could be a more general principle that goes beyond the electric metaphor.
It is worth stressing that the model has been experimentally tested in different genetic (inducible and constitutive) implementations. In all of them, despite the simplicity of the model, the agreement with the experimental data is remarkable. In consequence, our model provides a qualitative understanding of the genetic behavior, but also for a quantitative estimation of the relation between the genetic load of the different genetic parts present in the host cell. However, a word of caution must be taken into account for the comparability of results obtained in different days for parameter estimation. Future work should be devoted to develop a quantitative methodology that allows measuring the genetic load of each genetic component, in order to predict the impact of the genetic load of the whole device on the host cell.
Finally, previous evidence regarding the genetic load in eukaryotic systems (29–31) suggests that gene expression being affected by genetic load may not be exclusive to bacteria. Further experimental and mathematical research should be devoted to clarifying this issue. In this context, the development of predictive mathematical models to improve the design of genetic circuits should account for the effects related to the load, especially when large load is expected.
SUPPLEMENTARY DATA
Supplementary Data are available at NAR Online.
Acknowledgments
Authors thank Ricard Solé for useful comments, Salva Duran-Nebreda for its help on genetic devices cloning and Daniel Rodriguez Amor and the rest of the Complex Systems Lab members for fruitful discussions. C.R.C. also thanks Jose Rioja-Villodres for useful discussions about electricity.
Author contributions: M.C.B., C.R.C. and J.M. conceived the experimental design, result's interpretation and writing the manuscript. M.C.B., E.G.R., C.R.C. and R.M. performed the experiments. J.M. and C.R.C. developed the mathematical model.
MATHEMATICAL APPENDIX
Mathematical Model of gene expression dependences based on competition for cellular resources
Let us consider a gen i, noted as gi, as a transcriptional unit able to be transcribed into a messenger RNA mi that is translated into a protein pi. The processes of transcription and translation are balanced by the degradation mechanisms of the cell, giving rise a constant population of mi and pi species at the steady state. The transcription and translation processes can be described as a set of biochemical reactions.
Transcription reactions:
 |
(S.1) |
 |
(S.2) |
 |
(S.3) |
Here, Q represents the total amount of free translational resources, e.g. RNA polymerase (RNAP), whereas Qi denotes the fraction of translational resources temporary involved in the transcription of gene gi, and mi is the messenger RNA produced (mRNA). It is worth mentioning that  is a function that depends on the RNAP affinity, which in turns depends on the promoter sequence and, eventually, on the presence of other external effectors. Moreover,
  ,
,  and
and  are kinetic constants.Translation reactions:
 |
(S.4) |
 |
(S.5) |
 |
(S.6) |
Similarly, S represents the total amount of free transcriptional resources, e.g. ribosomes, whereas Si is the fraction of resources temporary compromised in protein synthesis. Here, kinetic parameter  depends on the specific ribosomal binding site (RBS) sequence and the rest are kinetic constants. Applying the law of mass action, the resulting Ordinary Differential Equations are:
 |
(S.7) |
 |
(S.8) |
 |
(S.9) |
 |
(S.10) |
at the steady state,
 |
(S.11) |
 |
(S.12) |
 |
(S.13) |
 |
(S.14) |
we get,
 |
(S.15) |
 |
(S.16) |
Parameters and variables are defined in Supplementary Table S1.We assume that the total amount of transcriptional (QT) and translational (ST) resources remain constant during time, i.e.
 |
(S.17) |
 |
(S.18) |
here, QC and SC are the transcriptional and translational resources devoted to the expression of the rest of the cellular genes (except for a gene of interest gi) i.e.
 |
(S.19) |
 |
(S.20) |
Combining Equations (S.11) and (S.12) with (S.17) and (S.18) we obtain:
 |
(S.21) |
 |
(S.22) |
By using (S.22), the protein concentration pi can be expressed as:
 |
(S.23) |
Introducing Equation (S.21) and after some algebra we get:
 |
(S.24) |
Now, we can define,
 |
(S.25) |
and Equation (S.24) can be rewritten as:
 |
(S.26) |
Defining Fi as the levels of gene expression measured experimentally, e.g. fluorescence if gene gi encodes a fluorescent protein, we assume that Fi depends linearly with the total amount of proteins pi, i.e.  . Hence, we get
 |
(S.27) |
being τi a constant.
Gene expression dependences behave analogously to Ohm's law
Expression of a gene demands for a different amount of cellular resources (energy and raw materials) depending on the gene sequence but also on the transcriptional regulations. For a given gene gi, βi characterizes this gene in terms of the required cellular resources for its expression. Changes in gene transcription rates, for instance due to the existence of a protein that represses or enhances the expression of the gene, are translated into changes on βi values, which in turn are translated into changes in the final gene expression, according to Equation (S.27). In this sense, βi can be interpreted as an indicator of the genetic load associated to a gene gi. In consequence, the expression level Fi depends on the gene requirements characterized by βi and on the requirements of the rest of the genes βj. Considering a synthetic genetic circuit formed by N different genes embedded in a host cell containing M genes in its genome, we can rewrite expression (S.27) as:
 |
(S.28) |
where,
 |
(S.29) |
Here, the sum is extended over all (M) genes of the host cell. Assuming that the cellular conditions are stable in terms of temperature, pH, nutrients, etc., we can consider that βC is constant under a physiological state.
Electric and genetic dependence for circuits in a series
Interestingly, the relationship between expression of Fi and β's in Equation (S.28) is similar to the relation between the difference of potential and the electric load in an electric circuit where all electric loads are connected in a series. Ohm's Law defines this dependence. More specifically, considering an electric circuit formed by a real voltage source and N electric loads connected in a series (see Figure 1A), the energy provided by the power supply is devoted to move electric charges through the different electric loads connected. Each electric load could require a different amount of energy to allow moving electric charges through it. The difference of potential Vi between the ends of the i-st electric load is a measure of this energy required, described by Ohm's Law as:
 |
(S.30) |
where Ri is the electric resistance of the i-st electric load. A real voltage source can be considered as the combination of an ideal voltage source VT (with internal resistance zero) with an internal resistance R0 connected in a series. Considering a circuit formed by a real voltage source and N load resistances connected in a series, this circuit is equivalent to a circuit with a single resistor Req connected to the same ideal source (32), where,
 |
(S.31) |
In consequence, the difference of voltage VT between the ends of Req is
 |
(S.32) |
and hence,
 |
(S.33) |
According to previous expressions, Ohm's Law of electric circuits with resistors connected in a series can be rewritten as
 |
(S.34) |
Equation (S.34) indicates that the energy devoted to move electric charges Vi through a resistor Ri is a fraction of the total energy available VT. This fraction is calculated as the ratio between the resistance Ri and the total resistance of the circuit.
Interestingly, the counterpart in genetic circuits behaves in a similar manner. The host cell can be envisioned as a resources supply for gene expression. These resources must be devoted to cell maintenance as well as to expression of the foreign genes introduced. In this context, we can interpret βi in the same terms as Ri. In this scenario, the metabolic load associated to the expression of gene gi, i.e. the amount of cellular resources that are withdrawn from the host cell for maintenance and expression of the foreign gene (11), is a fraction of the total cellular resources available. This fraction is determined by the ratio between the gene load βi and the total gene load hosted by the cell in a similar way than the ratio between resistances determines the fraction of electric resources (energy) devoted to move charges. It is worth mentioning that βC plays the same role than the internal resistance R0 in a power supply.
Gene expression of multiple copies circuit
In order to demonstrate that genetic load is an additive property we consider a genetic circuit formed by N copies of the same reporter gene rfp with genetic load βRFP. Our model considers that the RFP fluorescence level of the whole circuit ( ) is the sum of the expression levels of each single copy (FRFP), i.e.
 |
(S.35) |
In consequence, applying Equation (S.28) we obtain,
 |
(S.36) |
Equation (S.36) is equivalent to the expression obtained considering a circuit formed by a single gene with an equivalent genetic load βeq = βRFP·N. These results indicate that the total genetic load of a circuit is the sum of the genetic load associated to each gene involved.
Linear dependence between genes expression
Applying Equation (S.28) it is possible to determine how the introduction of a foreign gene or how changes in the expression of a given gene quantitatively affect the expression of the rest of the genes due to the indirect interaction associated with the so-called metabolic burden. In general, considering a host cell containing a synthetic genetic circuit formed by N foreign genes, the expression levels of two arbitrary genes gi and gk are
 |
(S.37) |
 |
(S.38) |
The ratio between the expression of both genes is:
 |
(S.39) |
Introducing (S.39) in expression (S.37) we obtain,
 |
(S.40) |
Manipulating this expression
 |
(S.41) |
After some algebra we get,
 |
(S.42) |
where,
 |
(S.43) |
In the case analyzed, where only two foreign genes have been introduced, Equations (S.43) are reduced to
 |
(S.44) |
Again Equation (S.42) is equivalent to the well-known relationship between electric potentials Vi and Vk between the ends of two resistances Ri and Rk (33) (see Supplementary Figure S1a), i.e.
 |
(S.45) |
Supplementary Figure S1b shows the linear dependence between the electric potentials existent between the ends of two resistances R1 and R2 for different values of R2 (R2 is a potentiometer whereas R1 remains constant). Now we consider the equivalent scenario in a genetic circuit. Equivalent dependences are observed in genetic circuits (see Figure 3) suggesting that the same mathematical laws that govern other systems such as electric circuits govern genetic circuits as well.
Parameters estimation and data fitting
In the model presented there are several key parameters that determine the effect of genetic load on gene expression. More specifically these parameters are βC, βRFP and βGFP that account for the genetic load associated to the host cell, the rfp gene and the gfp gene respectively. Additionally, there are two other parameters, γRFP and γGFP that involve biological and non-biological aspects such as the efficiency on the fluorescence measurement, which depends on the experimental equipment employed.
Analyzing the model equations it is possible to determine γRFP and γGFP and the ratios βC/βRFP, βC/βGFP and βGFP/βRFP, from the experimental data shown in Figures 2, 3A and Supplementary Figure S5.
Considering the constructs involving N copies of rfp (Figure 2 and Supplementary Figure S5), the relation between the RFP fluorescence (FRFP) and the number of copies N is given by Equation (1). This equation can be rewritten according to
 |
(S.46) |
Parameter γRFP and the ratio βC/βRFP can be obtained form a standard nonlinear least squares regression. Values obtained were
 |
For a correct interpretation of these results it is necessary to take into account that foreign genes, e.g. rfp, are introduced in a high copy number plasmid. Therefore, the host cell does not contain a single additional gene but from 100 to 300 copies of the same gene.
When a constitutive GFP gene is introduced in the constructs involving different number of rfp gene copies there are significant changes on RFP fluorescence levels (F’RFP) as Supplementary Figure S5 shows. In this new systems Equation (1) can be expressed as:
 |
(S.47) |
The reduction on the fluorescence values is determined by the ratio βGFP/βRFP. Fitting the experimental results shown in Supplementary Figure S5 and considering the values of γRFP and βC/βRFP previously obtained, the ratio βGFP/βRFP can be determined. The resulting value was
 |
Supplementary Figure S5 shows the experimental data and the fittings according to equations (S.46) and (S.47) using this parameter values.
Finally, using the expression of the intercept a of the linear relation (Figure 3a) described by equation (7), parameter γGFP can be calculated according to
 |
(S.48) |
The resulting value was,
 |
Data fitting for gene expression with different Ribosome Binding Site strengths
Data presented in Figure 4A was used to assess how experimental changes on the translational part associated to changes on RBS strengths are correlated with changes on the model parameters, and more specifically, on γRFP. Equation (6) describes the dependence of the gene expression of a constitutive reporter gene gfp with fixed genetic load versus changes on the expression of the tuneable one, rfp. When this tune takes place by changing the RBS sequence, it affects the slope b on equation (6). It is possible to calculate the relative value of γRFP, i.e. the γRFP normalized to the value of the strongst RBS 
 |
(S.49) |
Rewriting the slope expression from Equation (7) as
 |
(S.50) |
Equation (6) can be expressed as
 |
(S.51) |
with
 |
(S.52) |
An optimal fitting (R2 > 0.99) applying a standard non-linear least squares regression method was obtained with a = 72 000 and Ω = 1.9. The  values associated to each RBS sequence used to optimize this fitting are shown in Supplementary Table S4.
FUNDING
Fundación Botín, Banco de Santander through its Santander Universities Global Division [BES-2010-038940]; ERC SYNCOM [291294]; Spanish Ministry of Economy and Competitiveness [MINECO SAF2014-59284-R and FEDER]. Funding for open access charge: Spanish Ministry of Economy and Competitiveness [MINECO SAF2014-59284-R and FEDER].
Conflict of interest statement. None declared.
REFERENCES
- 1.Andrianantoandro E., Basu S., Karig D.K., Weiss R. Synthetic biology: new engineering rules for an emerging discipline. Mol. Syst. Biol. 2006;2 doi: 10.1038/msb4100073. doi:10.1038/msb410007. [DOI] [PMC free article] [PubMed] [Google Scholar]
- 2.Endy D. Foundations for engineering biology. Nature. 2005;438:449–453. doi: 10.1038/nature04342. [DOI] [PubMed] [Google Scholar]
- 3.Purnick P.E.M., Weiss R. The second wave of synthetic biology: from modules to systems. Nat. Rev. Mol. Cell Biol. 2009;10:410–422. doi: 10.1038/nrm2698. [DOI] [PubMed] [Google Scholar]
- 4.Brophy J.A.N., Voigt C.A. Principles of genetic circuit design. Nat. Methods. 2014;11:508–520. doi: 10.1038/nmeth.2926. [DOI] [PMC free article] [PubMed] [Google Scholar]
- 5.Collins J.J., Maxon M., Ellington A., Fussenegger M., Weiss R., Sauro H. Synthetic biology: how best to build a cell. Nature. 2014;509:155–157. doi: 10.1038/509155a. [DOI] [PubMed] [Google Scholar]
- 6.Canton B., Labno A., Endy D. Refinement and standardization of synthetic biological parts and devices. Nat. Biotechnol. 2008;26:787–793. doi: 10.1038/nbt1413. [DOI] [PubMed] [Google Scholar]
- 7.Carbonell-Ballestero M., Duran-Nebreda S, Montañez R, Macia J, Rodriguez-Caso C. A bottom-up characterization of transfer functions for synthetic biology designs: lessons from enzymology. Nucleic Acids Res. 2014;42:14060–14069. doi: 10.1093/nar/gku964. [DOI] [PMC free article] [PubMed] [Google Scholar]
- 8.Cardinale S., Arkin A.P. Contextualizing context for synthetic biology—identifying causes of failure of synthetic biological systems. Biotechnol. J. 2012;7:856–866. doi: 10.1002/biot.201200085. [DOI] [PMC free article] [PubMed] [Google Scholar]
- 9.Kwok R. Five hard truths for synthetic biology. Nature. 2010;463:288–290. doi: 10.1038/463288a. [DOI] [PubMed] [Google Scholar]
- 10.Peretti S.W., Bailey J.E. Simulations of host-plasmid interactions in Escherichia coli: Copy number, promoter strength, and ribosome binding site strength effects on metabolic activity and plasmid gene expression. Biotechnol. Bioeng. 1987;29:316–328. doi: 10.1002/bit.260290305. [DOI] [PubMed] [Google Scholar]
- 11.de Vos D., Bruggeman F.J., Westerhoff H.V., Bakker B.M. How molecular competition influences fluxes in gene expression networks. PLoS One. 2011;6:e28494. doi: 10.1371/journal.pone.0028494. [DOI] [PMC free article] [PubMed] [Google Scholar]
- 12.Bentley W.E., Kompala D.S. Optimal induction of protein synthesis in recombinant bacterial cultures. Ann. N.Y. Acad. Sci. 1990;589:121–138. doi: 10.1111/j.1749-6632.1990.tb24239.x. [DOI] [PubMed] [Google Scholar]
- 13.Ceroni F., Algar R., Stan G.-B., Ellis T. Quantifying cellular capacity identifies gene expression designs with reduced burden. Nat. Methods. 2015;12:415–418. doi: 10.1038/nmeth.3339. [DOI] [PubMed] [Google Scholar]
- 14.Glick B.R. Metabolic load and heterologous gene expression. Biotechnol. Adv. 1995;13:247–261. doi: 10.1016/0734-9750(95)00004-a. [DOI] [PubMed] [Google Scholar]
- 15.Scott M., Mateescu E.M., Zhang Z., Hwa T. Interdependence of cell growth origins and consequences. Science. 2010;330:1099–1102. doi: 10.1126/science.1192588. [DOI] [PubMed] [Google Scholar]
- 16.Klumpp S. Growth-rate dependence reveals design principles of plasmid copy number control. PLoS One. 2011;6:e20403. doi: 10.1371/journal.pone.0020403. [DOI] [PMC free article] [PubMed] [Google Scholar]
- 17.Gyorgy A., Del Vecchio D. Limitations and trade-offs in gene expression due to competition for shared cellular resources. Proc. IEEE Conf. Decis. Control. 2014:5431–5436. [Google Scholar]
- 18.Del Vecchio D., Murray R.M. Biomolecular Feedback Systems. New Jersey: Princeton University Press; 2014. [Google Scholar]
- 19.Mishra D., Rivera P., Del Vecchio D. A load driver device for engineering modularity in biological networks. Nat. Biotechnol. 2014;32:1268–1275. doi: 10.1038/nbt.3044. [DOI] [PMC free article] [PubMed] [Google Scholar]
- 20.Gyorgy A., Jiménez J.I., Yazbek J., Huang H., Chung H., Weiss R., Del Vecchio D. Isocost lines describe the cellular economy of genetic circuits. Biophys. J. 2015;109:639–646. doi: 10.1016/j.bpj.2015.06.034. [DOI] [PMC free article] [PubMed] [Google Scholar]
- 21.Registry of Standard Biological Parts. 2015. http://parts.igem.org/Main_Page http://parts.igem.org/Main_Page
- 22.Shetty R.P., Endy D., Knight T.F. Engineering BioBrick vectors from BioBrick parts. J. Biol. Eng. 2008;2 doi: 10.1186/1754-1611-2-5. doi:10.1186/1754-1611-2-5. [DOI] [PMC free article] [PubMed] [Google Scholar]
- 23.Pasotti L., Politi N., Zucca S., Cusella De Angelis M.G., Magni P. Bottom-up engineering of biological systems through standard bricks: a modularity study on basic parts and devices. PLoS One. 2012;7:e39407. doi: 10.1371/journal.pone.0039407. [DOI] [PMC free article] [PubMed] [Google Scholar]
- 24.Nilsson J.W., Riedel S.A. Electric Circuits. 9th edn. New Jersey: Prentice Hall; 2011. [Google Scholar]
- 25.Bertram R., Hillen W. The application of Tet repressor in prokaryotic gene regulation and expression. Microb. Biotechnol. 2008;1:2–16. doi: 10.1111/j.1751-7915.2007.00001.x. [DOI] [PMC free article] [PubMed] [Google Scholar]
- 26.Akers A., Gassman M., Smith R. Hydraulic Power System Analysis. Boca Raton, FL: Taylor & Francis; 2006. [Google Scholar]
- 27.Guyton A., Hall J. Textbook of Medical Physiology. 11th edn. Philadelphia, Pennsylvania: Elsevier Inc; 2006. [Google Scholar]
- 28.Sarpeshkar R. Ultra Low Power Bioelectronics. Cambridge: Cambridge University Press; 2010. [Google Scholar]
- 29.Yallop C.A., Svendsen I. Recombinant Protein Production with Prokaryotic and Eukaryotic Cells. A Comparative View on Host Physiology. Netherlands: Springer; 2001. [Google Scholar]
- 30.Yallop C.A., Svendsen I. The effects of G418 on the growth and metabolism of recombinant mammalian cell lines. Cytotechnology. 2001;35:101–114. doi: 10.1023/A:1017550902771. [DOI] [PMC free article] [PubMed] [Google Scholar]
- 31.Van Rensburg E., Den Haan R., Smith J., Van Zyl W.H., Görgens J.F. The metabolic burden of cellulase expression by recombinant Saccharomyces cerevisiae Y294 in aerobic batch culture. Appl. Microbiol. Biotechnol. 2012;96:197–209. doi: 10.1007/s00253-012-4037-9. [DOI] [PubMed] [Google Scholar]
- 32.Glisson T.H. Introduction to Circuit Analysis and Design. NY: Springer Scicence+Bussines Media B.V; 2011. [Google Scholar]
- 33.Hughes E. Electrical Technology. 7th edn. London: Longman; 1969. [Google Scholar]
Associated Data
This section collects any data citations, data availability statements, or supplementary materials included in this article.