


Abstract
Cap homeostasis is a cyclical process of decapping and recapping that maintains the cap on a subset of the cytoplasmic transcriptome. Interfering with cytoplasmic capping results in the redistribution of target transcripts from polysomes to non-translating mRNPs, where they accumulate in an uncapped but nonetheless stable form. It is generally thought that decapping is preceded by shortening of the poly(A) tail to a length that can no longer support translation. Therefore recapped target transcripts would either have to undergo cytoplasmic polyadenylation or retain a reasonably long poly(A) tail if they are to return to the translating pool. In cells that are inhibited for cytoplasmic capping there is no change in the overall distribution of poly(A) lengths or in the elution profile of oligo(dT)-bound targets. Poly(A) tail lengths were similar for target mRNAs on polysomes or in non-translating mRNPs, and the presence of polyadenylated uncapped mRNA in mRNPs was confirmed by separation into capped and uncapped pools prior to assay. Finally, in silico analysis of cytoplasmic capping targets revealed significant correlations with genes encoding transcripts with uridylated or multiply modified 3′ ends, and genes possessing multiple 3′-untranslated regions (UTRs) generated by alternative cleavage and polyadenylation.
INTRODUCTION
The methyl guanosine ‘cap’ on the 5′ ends of all eukaryotic mRNAs plays a role in almost every step in mRNA processing and metabolism (1). Capping is the first committed step in pre-mRNA processing, mRNAs are exported cap-end first from the nucleus to the cytoplasm, and mRNA surveillance, silencing and translation all involve proteins that bind to the cap. Given the importance of the cap in almost every aspect of mRNA metabolism it is not surprising that its loss was thought to irreversibly lead to mRNA decay (2). This view began to change with the identification by capped analysis of gene expression (CAGE) of a large number of capped ends that mapped to sites within spliced exons for which there were no corresponding transcription start sites (3). Subsequent work showed ∼25% of CAGE tags map to sequences within the body of spliced transcripts rather than transcription start sites (4). Downstream CAGE tags appear to be unique to higher metazoans, as these are absent from the Drosophila transcriptome (5).
Our interest in capping grew out of work studying the decay of nonsense-containing β-globin mRNA in erythroid cells. Endonuclease cleavage in the cytoplasm (6) yields a reproducible set of capped and polyadenylated decay intermediates which, like transcripts with downstream CAGE tags, are missing sequences from their 5′ ends (7–9). For these to be capped, the 5′-monophosphate ends on each product must be converted to a 5′-diphosphate, and there must be a cytoplasmic pool of capping enzyme (CE). In (10), we described a cytoplasmic complex that has both of these activities. More recently, we showed that these are brought together in a single complex by the binding of CE and a 5′-monophosphate kinase to adjacent SH3 domains of adapter protein Nck1 (11). That study also identified the proline-rich C-terminus of CE as a third functional domain whose binding by the third SH3 domain of Nck1 is required for assembly of the cytoplasmic capping complex.
Because CE is required for pre-mRNA processing it cannot be knocked down without causing cell death. To circumvent this we developed a modified form of CE whose overexpression results in a dominant negative inhibition of cytoplasmic capping (10). In this protein (termed K294A ΔNLS+NES, or K294A), the active site lysine is changed to alanine, and it is restricted to the cytoplasm by deletion of the nuclear localization sequence and addition of the HIV Rev nuclear export sequence. The reduced recovery from stress of K294A-expressing cells (10) provided initial evidence of the effectiveness of this form of CE in blocking cytoplasmic capping. Proof of this came in a subsequent study in which K294A overexpression was used to identify cytoplasmic capping targets (12). In that study uncapped 5′ ends were identified by a combination of in vitro degradation with Xrn1 and position-dependent analysis of transcript loss using human exon arrays. This identified three sets of target transcripts, which were given operational definitions based on the manner in which they were identified. The ‘native uncapped’ pool (formerly referred to as ‘uninduced’) consists of mRNAs having a natively uncapped population, and mRNAs that accumulate stable uncapped forms when recapping is blocked were categorized as ‘capping inhibited.’ A third pool of ‘common’ transcripts had natively uncapped forms, the representation of which increased when cytoplasmic capping was inhibited. Under conditions where cytoplasmic capping is inhibited the ‘native’ uncapped transcripts are degraded and the uncapped forms of ‘capping inhibited’ and ‘common’ transcripts accumulate in non-translating mRNPs.
Until recently there was a general consensus that efficient translation was limited to mRNAs with a long poly(A) tail. This was based primarily on studies with transcripts for which cytoplasmic polyadenylation was needed for efficient translation (13) and from work with in vitro translation systems, where 100–150 residues was identified as the optimal poly(A) length (14,15). Generally, deadenylation precedes decapping (16), and it was unclear whether the stable uncapped transcripts in the common and capping inhibited pools might require both recapping and cytoplasmic polyadenylation to be returned to the translating pool. Two recent studies of transcriptome-wide poly(A) profiling (17,18) suggest additional polyadenylation may not be necessary. In both studies, poly(A) tail length in cultured mammalian cells ranged from 50 to 100 residues, with the median being ∼70 residues. Both studies also showed there is no correlation between translation and poly(A) tail length in differentiated cells. In the current study, we show that inhibition of cytoplasmic capping has no impact on the overall poly(A) length, and that the poly(A) tails on uncapped forms of recapping targets that accumulate in non-translating mRNPs are similar in length to those found on polysomes. These findings are consistent with cytoplasmic recapping being all that is needed to return these transcripts to the translating pool.
MATERIALS AND METHODS
Cell culture and preparation of cytoplasmic RNA
The generation of tetracycline-inducible U2OS cells stably transfected with pcDNA4/TO/myc-K294ΔNLS+NES-FLAG (referred to here and in (12) as K294A) is described in (10). Cells were cultured in McCoy's medium (Gibco) supplemented with 10% fetal bovine serum. 3 × 10⁶ log-phase cells were split into 150 mm tissue culture dishes followed after 24 h by addition of 1 μg/ml doxycycline to induce K294A. At the indicated times cells were rinsed twice with ice-cold phosphate buffered saline and suspended with a cell scraper. The recovered cells were resuspended in 5 volumes of RSB buffer (10 mM Tris-HCl, pH 8.0, 2 mM EDTA pH 8.0, 10 mM NaCl, 1 mM DTT, 0.5% NP-40, 80 U/ml RNaseOUT (Invitrogen)) and incubated on ice for 10 min with gentle agitation. Nuclei were removed by centrifuging at 1000 ×g for 10 min at 4°C and the supernatant fraction was used for western blotting and for isolating cytoplasmic RNA by extraction with Trizol (Life Technologies) according to the manufacturer's instructions. The recovered RNA was resuspended in water and treated with DNase I (1 unit/50 μl) (Promega) as directed by the manufacturer. DNase I digestion was stopped with the addition of EDTA and denaturation at 65°C for 10 min.
Western blot analysis
Western blotting was done essentially as described in (6). Cytoplasmic extracts were denatured in Laemmli sample buffer (Bio-Rad Laboratories) with β-mercaptoethanol, separated on 10% Mini-PROTEAN TGX precast gels (Bio-Rad Laboratories) and transferred onto Protran nitrocellulose membranes (Amersham). Membranes were cut into strips and blocked with 5% non-fat dry milk in Tris-buffered saline containing 0.05% Tween-20 (TBS-T). Blots were incubated overnight at 4°C with mouse anti-FLAG polyclonal antibody (1:2500 dilution, top strip) or mouse anti-GAPDH antibody (1:5000 dilution, bottom strip) in 1% non-fat milk. Blots were washed with TBS-T, then incubated with LI-COR IR-800 anti-mouse secondary antibody (1:10000 dilution) for 2 h, washed with TBS-T and visualized using Odyssey V.3.0.30 software (LI-COR).
Cap-dependent fractionation and Xrn1 susceptibility of uncapped RNA
Cap-dependent separation was performed as described in (12). For cap-dependent fractionation, 5 μg of cytoplasmic RNA was depleted of ribosomal RNA using the RiboZero kit (Epicentre). Prior to separation each sample received internal controls of capped β-globin and an uncapped firefly luciferase RNA. Cap-dependent separation was performed using Gst-Sepharose beads containing a bound heterodimer consisting of equal amounts of Gst-murine eIF4E plus Gst human eIF4G1(197–674)-His.
RNase A and T1 digestion of cytoplasmic RNA
50 μg of cytoplasmic RNA was digested with 6 μl of RNase Cocktail Enzyme Mix (a mix of RNase A and T1, Life Technologies), for 1 h at 37°C in a total volume of 60 μl. After incubation, water was added to a final volume of 100 μl and the remaining RNA was purified using RNA clean and concentrator 5 (Zymo) columns according to the manufacturer's instructions for small RNAs. 1 μl of 50 μM oligo dT20 was added to the surviving RNA and incubated ±2 units of RNase H (Life Technologies) for 1 h at 37°C. Products were visualized using 11% denaturing polyacrylamide gels and stained with Sybr Gold (Life Technologies).
Poly(A) length-dependent fractionation of RNA
Poly(A) length-dependent fraction was performed by a modification of the protocol in (19). Briefly, cytoplasmic RNA (10 μg) was spiked with in vitro transcribed LucA20 or LucA98 (20), heated for 5 min at 65°C and then snap chilled on ice. To this was added 200 μl of oligo(dT)25 magnetic beads (Life Technologies) in LETS buffer (0.5 M LiCl, 10 mM EDTA, 10 mM Tris-HCl pH 7.5, 0.2% SDS). The beads were suspended by shaking at 1200 rpm for 30 min at 20°C in a dry bath thermomixer. They were then washed 3x for 5 min each in LETS buffer before being transferred to new tubes and rapidly chilled. Poly(A) length-dependent elution was performed in two steps. The first elution was done in the thermomixer for 15 min at 20°C in ETS (10 mM EDTA, 10 mM Tris-HCl pH 7.5, 0.2% SDS) containing 7.5% deionized formamide. The second elution used the same conditions, but with 30% deionized formamide. The eluted RNAs were recovered by ethanol precipitation and oligo(dT)20 primed cDNA was synthesized using SuperScript III (Life Technologies) according to the manufacturer's instructions. Fractionation was assessed by quantitative polymerase chain reaction (qPCR) using SensiFAST SYBR No-ROX reagent (Bioline). Reaction efficiency of each primer set was determined by qPCR of serial dilutions so that the Ct correction factor for the input fraction could be calculated as follows: Ct correction factor = log∈20, where E = Er +1, with Er = [10−1/m], using the slope, m, from the standard curve equation. Fold recovery was calculated using relative quantification by normalizing fractions to their respective input (21). ΔCt = Ctsample-correctedCtinput and Fold recovery = 2−ΔCt. Graphs show mean fold recovery relative to input with error bars representing standard deviation.
Separation of mRNP and polysomes
mRNPs and polysomes were fractionated using linear sucrose gradients as described in (12). Briefly, cells were treated with cycloheximide (CHX, 100 μg/ml) for 10 min at 37°C, washed twice with PBS+CHX (100 μg/ml), scraped from the dish with a cell scraper and pelleted by centrifugation at 1000 xg for five minutes. All subsequent procedures were carried out on ice and in pre-chilled centrifuges. Cell pellets were lysed in 5 volumes of ice cold lysis buffer (50 mM Tris-HCl, pH 7.5, 10 mM KCl, 10 mM MgCl2, 150 mM NaCl, 0.2% NP-40, 2 mM DTT, 0.5 mM PMSF, 1 mM sodium orthovanadate, 200 ug/ml CHX, supplemented with 5 μl/ml RNAseOUT (Life Technologies), 25 μl/ml protease inhibitor cocktail (Sigma), 10 μl/ml each phosphatase inhibitor cocktails 2 and 3 (Sigma)). Lysates were incubated on ice for 10 min with mild agitation every two minutes. Nuclei and other debris were removed by 10 min centrifugation at 16 000 xg and the resulting supernatants were applied to 10–50% linear sucrose gradients. These were centrifuged for 3 h at 210 000 xg in a Sorvall TH-641 rotor at 4ºC and 0.5 ml fractions were collected from the bottom and monitored continuously for absorbance at 254 nm. RNA was recovered from pooled fractions containing polysomes (10–23) or mRNPs (2–8) using a Direct-zol kit (Zymo) as directed by the manufacturer. Fraction 9, where monosomes and mRNPs overlapped, was omitted to minimize overlap between the two populations.
Separation of uncapped and capped mRNP mRNAs
Capped and uncapped transcripts in the non-translating pool were separated using an agarose-conjugated anti-cap antibody (Calbiochem) essentially as described in (22). Briefly, 5 μg of RNA harvested from mRNP fractions was depleted of ribosomal RNA and spiked with uncapped luciferase and capped enhanced green fluorescent protein (EGFP) mRNAs as internal controls as described in (12). The mixture was incubated with pre-equilibrated anti-cap agarose beads for 3 h at 25°C, during which time the beads were kept suspended by agitation at 1000 rpm. The supernatant containing the uncapped RNAs was removed and saved. The beads were washed three times and capped mRNAs were eluted with m7GDP at a final concentration of 200 μM (10). The recovered RNAs were precipitated using sodium acetate and isopropanol. The effectiveness of the separation was verified via qPCR of capped EGFP and uncapped luciferase RNA.
Identification of uncapped mRNAs
Uncapped transcripts were determined as described in (12) by their susceptibility to in vitro degradation with Xrn1. As in that study each sample had internal controls of capped β-globin mRNA and uncapped luciferase mRNA that was generated by tobacco acid pyrophosphatase (Epicentre) digestion of firefly luciferase mRNA (Promega). 0.1 ng of each internal control was added to 10% of the RNA recovered from mRNP pools (∼500 ng per sample), followed by heat denaturation at 65°C for five minutes and rapid chilling on ice. Half of each sample received 2 units of Xrn1 (New England Biolabs) or buffer, the volume was adjusted to 15 μl and reactions were incubated for 1 h at 37°C. Reactions were stopped by addition of 6 μl of 25 mM EDTA and heating to 70°C for 10 min. Half of each digest was used to generate random hexamer-primed cDNA with Superscript III (Life Technologies), and the products were analyzed by qPCR using SensiFAST SYBR No-ROX reagent (Bioline) with 5′-end weighted primers (Supplementary Table S1). Loss of luciferase signal was used to insure the efficiency of Xrn1 digestion, and each value was normalized to the capped internal β-globin mRNA control. Changes in the levels of uncapped RNAs were calculated by comparing the susceptibility of target and control transcripts to Xrn1 digestion in response to the expression of K294A.
Assessment of poly(A) tail length by GI-tailing
Poly(A) tail length on individual transcripts was determined by GI tailing using a modification of the approach in (23). Briefly, the RiboZero kit (Epicentre) was used to deplete rRNA from 1 μg each of RNA from pooled mRNP and polysome. Half (12 μl) of each sample was heat denatured in water at 65°C for 5 min followed by rapid chilling on ice. 8 μl of a mastermix (4 μl of 5X PAP buffer, 2 μl GTP-ITP mix (5 mM each)), 1 μl SUPERase·In (Life Technologies) and 1 μl (600 U) of yeast poly(A) polymerase (USB) was added and GI tailing was performed at 37°C for 1 h. Products were recovered by ethanol precipitation and resuspended in 10 μl of water. 9 μl was mixed with 1 μl Primer Tail_Rev (10 μM) (Supplementary Table S1), followed by 5 min at 65°C and gradual cooling (1°C per 45 s) to 42°C using a thermocycler. cDNA was prepared using Superscript II (Life Technologies) per the manufacturer's instructions. PCR was performed with MyTaq 2x mix (Bioline) using gene-specific forward primers and a universal 5′ FAM-labeled tail-specific primer (Supplementary Table S1) according to the manufacturer's instructions. Reactions using gene-specific primer pairs were also performed as controls. The PCR products were robotically purified with a BioMek FX Liquid Handling Station (Beckman) using AMPure beads (Agencourt) and analyzed on an Applied Biosystem 3730 DNA Analyzer with the default LIZ1200v2 run module. The resulting data were analyzed using GeneMapper 4.1 and Peak Scanner 1.0 software suites (Life Technologies). The distribution of poly(A) tail lengths was determined by mapping the normalized peak areas (individual peak area/total signal) for each sample. Most polyadenylation sites were chosen from those identified in (24) and used as zero-length tails. In cases where poly(A) sites were not conclusively identified by (24) or such sites were not validated by our experiments, poly(A) addition sites annotated by the National Center for Biotechnology Information (NCBI) were used instead.
Correlation analyses
In order to be able to cross-reference our list of 55 662 transcripts in (12) to other studies, all Ensembl transcript IDs were converted to Entrez gene IDs. An Ensembl transcript ID to Entrez gene ID mapping table was generated using Ensembl's Biomart tool (http://www.ensembl.org/biomart/martview/), utilizing Ensembl Genes v76 for Homo Sapiens (GRCH38). Any transcripts that mapped to more than one Entrez gene ID were removed from further analysis, as were all Entrez gene IDs that showed up in more than one of our cytoplasmic capping target categories (167 genes, Supplementary Table S2-G). This left us with 1092 native uncapped, 215 capping inhibited, 267 common and 16 952 total tested genes. These lists were used in downstream comparisons with other studies.
The first comparison was to genes with 3′-end modifications in (18). The 4091 genes in that study were divided into the upper and lower quartiles for total modified (1042 upper and 1033 lower), guanylated (1024 upper and 1022 lower) and uridylated (1045 upper and 1058 lower) genes. The gene symbols used in this study were then converted into Entrez gene IDs with Homo_sapiens.gene_info.gz (downloaded from ftp://ftp.ncbi.nih.gov/gene/DATA/GENE_INFO/Mammalia/ on 6 August 2014). Since some gene symbols occur more than once in the conversion file, we only converted gene symbols that (i) occurred only once as the primary gene symbol for an Entrez gene ID, or (ii) did not occur as the primary gene symbol for an Entrez gene ID but occurred only once as an alternative gene symbol for an Entrez gene ID. Also, we removed the two different gene symbols that were mapped onto the same Entrez gene ID. This conversion resulted in eight gene symbols used in (18) that could not be converted into Entrez gene IDs (Supplementary Table S2-G). In total, 3599 Entrez gene IDs were common to (18) and (12). Fisher's Exact Tests were used to determine the correlations between the three categories of cytoplasmic capping target sets and the upper and lower quartiles of the total modified, guanylylated and uridylated Entrez gene ID lists, using the R statistical programming package, version 3.1.0.
A similar approach was used to relate cytoplasmic capping targets to genes with multiple UTRs reported in (24). Christine Mayr (Sloan Kettering) generously provided the list of multi-UTR genes (5864 genes) and all (13 354) genes considered in (24) identified by Entrez gene IDs. We intersected these lists with the gene lists derived from (12) as described above yielding assignments of cytoplasmic capping categories and multi-UTR status to a total of 12 051 genes common to both studies. Again, Fisher's Exact Tests were used to determine the correlations between the three categories of cytoplasmic capping target sets and multi-UTR genes.
Lastly, we investigated the relationship between genes with 3′-end modifications in (18) and genes with multiple UTRs in (24). Again, Fisher's Exact Test were applied to the 3331 Entrez gene IDs in common to the two studies after conversion of the 3′-end modification data to Entrez gene IDs as described above.
RESULTS
Global impact of inhibiting cytoplasmic capping on poly(A) tail length
We began this study by asking whether inhibiting cytoplasmic capping had any impact on the overall distribution of poly(A) tails. In Figure 1 triplicate cultures of cells stably transfected with tetracycline-inducible K294A were induced with doxycycline and harvested at times up to 12 h. Western blotting with antibody to the C-terminal FLAG tag showed K294A was undetectable at the start of the experiment and continued to increase up to 9 h after induction (Figure 1A). The inhibitory impact of K294A on cytoplasmic capping was confirmed by cap affinity chromatography as described in (12). Briefly, cytoplasmic RNA recovered after 12 h was depleted of ribosomal RNA and applied to glutathione-Sepharose beads containing a heterodimer of Gst-eIF4E and Gst-eIF4G(197–674). The bound (capped) and unbound (uncapped) populations were then analyzed by RT-qPCR for K294A-dependent changes in two unaffected mRNAs (β-actin and STRN4) and four cytoplasmic capping targets (VDAC3, ILF2, ZNF207 and MAPK1). There was little impact of K294A expression on either of the two unaffected mRNAs (Figure 1B, control); however, the amount of uncapped RNA for each of the cytoplasmic capping targets increased as much as 2–3-fold, confirming that cytoplasmic capping was inhibited in these cells.
Figure 1.

Appearance of uncapped transcripts and poly(A) length analysis as a function of time after K294A induction. (A) The appearance of K294A after induction with doxycycline was determined by western blotting with antibody to the C-terminal FLAG tag. (B) Cytoplasmic RNA from uninduced and 12 h K294A-expressing cells was depleted of ribosomal RNA and separated by cap affinity chromatography on Gst-Sepharose containing a bound Gst-eIF4E/Gst-eIF4G(197–674) heterodimer (12). Bound and unbound fractions were quantified by RT-qPCR and results are presented as the mean fold difference ± standard deviation of RNA from induced versus uninduced cells (n = 3). The star (*) indicates a p-value <0.05 by Student's t test. (C) 50 μg of cytoplasmic RNA recovered at each of the timepoints was left untreated (lane 1) or digested with a mixture of RNase A+T1 before addition of oligo dT20 in the absence (lanes 3–7) or presence (lanes 9–13) of RNase H. Lanes 2 and 8 (M) contains size standards beginning at 30 nucleotides.
Next, RNA from each timepoint was treated with a mixture of RNase A and T1 to determine if inhibiting cytoplasmic capping had any impact on the global distribution of poly(A) tail length. Oligo(dT) was added to the surviving RNA and half of each sample was digested with RNase H prior to electrophoresis (Figure 1C). The distribution of poly(A) tail lengths in lanes 2–7 is similar to that seen in (18) and (17), and the disappearance of each signal following treatment with RNase H confirmed that each lane represents poly(A) remaining after A+T1 digestion. Importantly, induction of K294A had no discernible impact in the overall distribution of poly(A) tail lengths.
Poly(A) length-dependent fractionation of cytoplasmic capping targets
Differential elution from oligo(dT) magnetic beads was used to examine the impact of inhibiting cytoplasmic capping on poly(A) tail lengths of specific transcripts. Before applying this approach to recapping targets it was qualified using luciferase RNA with 20 residue (‘short’) or 98 residue (‘long’) poly(A) tails (Figure 2A). If cytoplasmic capping targets undergo deadenylation prior to decapping this would be seen as a time-dependent shift in elution from the long poly(A) fraction to the short poly(A) fraction whereas the controls should elute with long poly(A) regardless of time after induction. This is shown in Figure 2B and C, where regardless of time after induction β-actin and STRN4 were almost stoichiometrically recovered in the long poly(A) fraction. Importantly, the same results were seen for each of the recapping targets (Figure 2D–G), each of which eluted primarily in the long poly(A) fraction regardless of time after induction. Therefore, as defined by this criterion, cytoplasmic capping targets are polyadenylated and inhibiting cytoplasmic capping has little or no impact on the length of their poly(A) tails.
Figure 2.
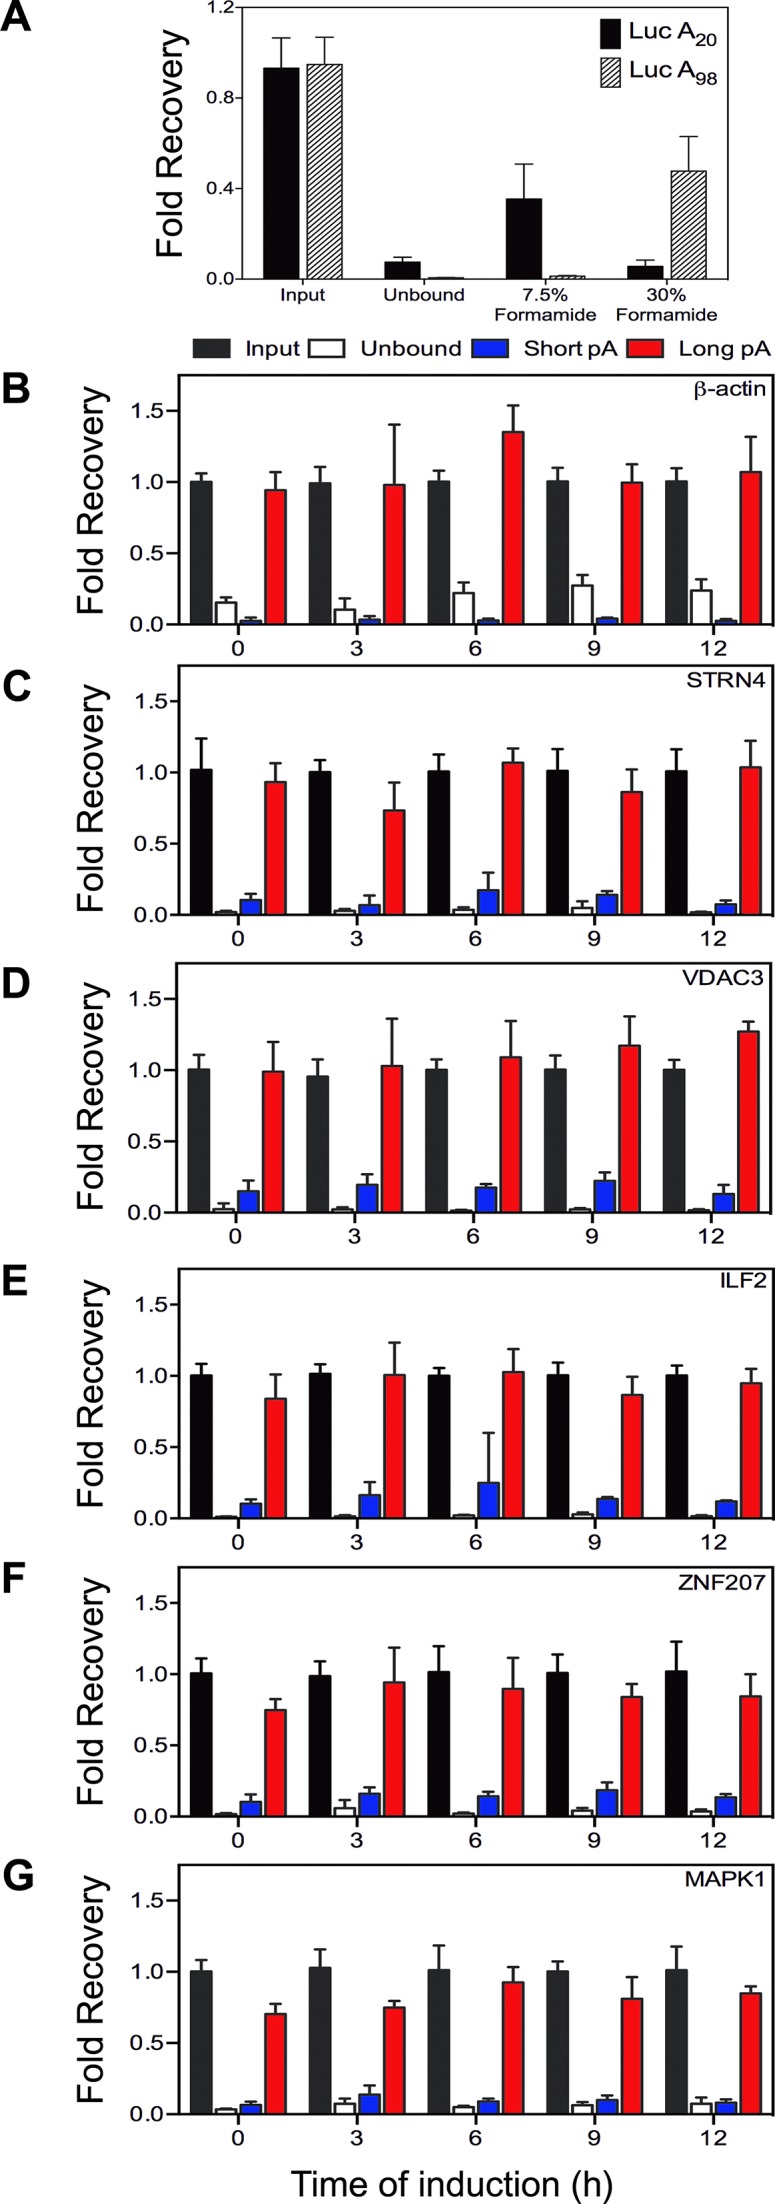
Poly(A) length-based separation of cytoplasmic capping targets. (A) 10 μg of cytoplasmic RNA was spiked with 1 ng of in vitro transcribed luciferase RNA with a 20 residue (Luc A20) or 98 residue (Luc A98) tail (15) and bound to oligo(dT) paramagnetic beads. After washing to remove any remaining unbound RNA the beads were sequentially eluted with buffer containing 7.5% and 30% formamide. Luciferase RNA in the input, unbound and eluted fractions was quantified by RT-qPCR. Cytoplasmic RNA recovered at the indicated times after doxycycline addition was separated as described above into unbound, short (7.5% formamide eluate) and long (30% formamide elute) poly(A) fractions. The recovery in each fraction of two control mRNAs (β-actin (B); STRN4 (C)) and four targets; VDAC3 (D), ILF2 (E), ZNF207 (F) and MAPK1 (G) was quantified by RT-qPCR. Results are shown as the mean ± standard deviation, n = 3.
Poly(A) tail length of translating and non-translating mRNAs
In (25) we noted that in order to return to the translating pool uncapped forms of cytoplasmic capping targets must undergo cytoplasmic polyadenylation or retain a reasonably long poly(A) tail. This was examined using the approach outlined in Figure 3A, where we first confirmed induction of K294A changes the cap status of mRNAs on non-translating mRNPs. Each of the samples included uncapped luciferase and capped β-globin transcripts as internal controls, and cap status of individual transcripts was determined by their susceptibility to in vitro degradation by Xrn1 followed by RT-qPCR (12) (Figure 3B). As in our previous study the expression of K294A had little impact on two mRNAs (RPLP0 and β-actin) whose cap status is unaffected by inhibition of cytoplasmic capping. Also in agreement with that study inhibition of cytoplasmic capping increased the amount of uncapped forms of each of four recapping targets (VDAC3, ILF2, ZNF207, MAPK1) present in non-translating mRNPs.
Figure 3.

Appearance of uncapped forms of cytoplasmic capping targets in non-translating mRNPs. (A) Cytoplasmic extracts from uninduced and 12 h K294A-expressing cells were separated on linear sucrose gradients and pooled into mRNP and polysome fractions. (B) RNA recovered from the pooled mRNP was spiked with uncapped luciferase RNA as a control for Xrn1 digestion, and capped β-globin RNA as a control for sample recovery. Half of each sample was treated with Xrn1 to degrade uncapped RNAs (12) and the recovered RNA was assayed by RT-qPCR using primers located near the 5′ ends of luciferase, β-globin, β-actin, RPLP0,VDAC3, ILF2, ZNF207 and MAPK1 mRNA. Results were calculated as in (12) and are shown as the change in Xrn1 sensitivity of unaffected (β-actin, RPLP0) and target (VDAC3, ILF2, ZNF207 and MAPK1) mRNAs as a function of K294A expression.
We next used the method described in (23) to determine poly(A) tail length of these mRNAs in RNA recovered from both polysomes and non-translating mRNPs. This uses yeast poly(A) polymerase to add a random oligomer of guanosine plus inosine residues to the 3′ end of the poly(A) tail, followed by RT-PCR with a gene-specific primer and a FAM-labeled tail-specific primer. Automated amplified fragment length polymorphism analysis of the amplified products is shown in Figure 4. Whereas the unaffected mRNA RPLP0 has the same length poly(A) tail in non-translating mRNP and polysomes (Figure 4A) the same was not true for two other unaffected mRNAs, STRN4 (Figure 4C) or β-actin (Figure 4B). The polysome-bound forms of these mRNAs have long poly(A) tails, but mRNP-bound STRN4 mRNA has a short poly(A) tail. β-actin mRNA was detectable in mRNP by RT-qPCR, but despite repeated attempts we were unable to detect any degree of polyadenylation. Overall these findings are consistent with the general view that translation requires a minimum length poly(A) tail.
Figure 4.

Poly(A) length analysis of transcripts on polysomes and non-translating mRNPs. RNA from the pooled gradient fractions in Figure 3 was depleted of ribosomal RNA before incubating with yeast poly(A) polymerase and a mixture of GTP and ITP to add a limited GI tail to 3′ ends. This was reverse transcribed with the primer C10TT and amplified with an FAM-labeled tail-specific primer and gene-specific primers for the following transcripts; RPLP0 (A), β-actin (B), STRN4 (C), VDAC3 (D), ILF2 (E), ZNF207 (F) and MAPK1 (G). The products were robotically purified using AMPure beads and analyzed on an Applied Biosystem 3730 DNA Analyzer. The Y-axis represents the relative amount present at each position of the poly(A) tail. All experiments were performed in triplicate and the data show a representative experiment for each mRNA.
Poly(A) tail length for the mRNP-bound forms of each of the four recapping targets was the same as that of the corresponding mRNA on polysomes (Figure 4D–G). Also, whether mRNA was recovered from polysomes or non-translating mRNP K294A had no discernable impact on poly(A) tail length except for MAPK1, which was longer for mRNA recovered from non-translating mRNP of K294A-expressing cells. Although mRNPs accumulate uncapped forms of recapping targets (12) capped forms are also present. The contribution of each of these pools was determined by separating capped and uncapped mRNAs by cap affinity chromatography (22) prior to analysis of poly(A) tail length. The vast majority of RPLP0 mRNA was recovered in the capped fraction and the overall distribution of poly(A) length was similar to that of unfractionated RNA (cf Figures 4A and 5A). ZNF207 is a transcript we have studied extensively as a recapping target and the pattern here is quite different (Figure 5B). Capped and uncapped forms of ZNF207 have a bimodal distribution of poly(A) lengths, with the majority of the capped pool having an average of 50 nt poly(A) and the majority of the uncapped pool having an average of 75 nt poly(A). Taken together, the results in Figures 3–5 show that the uncapped forms of cytoplasmic capping-targeted mRNAs retain poly(A) tail lengths that, after recapping, are sufficient to facilitate translation.
Figure 5.

Poly(A) length analysis of capped and uncapped transcripts from non-translating mRNPs. RNA from mRNP gradient fractions were pooled, depleted of rRNA and separated by cap affinity chromatography on immobilized anti-cap antibody. RNA present in the capped (bound) and uncapped (unbound) fractions was GI-tailed and analyzed as in Figure 4 for one control transcript (RPLP0, (A)) and one cytoplasmic capping target (ZNF207, (B)). All experiments were performed in triplicate and the data show a representative experiment for each mRNA.
Relationship of cytoplasmic capping targets to poly(A) tail modifications and multi-UTR genes
The TAIL-Seq approach used in (18) to quantify poly(A) tail lengths not only demonstrated that much shorter poly(A) tails than previously thought support translation, but also showed widespread evidence for the presence of one or more additional 3′ terminal nucleotides, the most prevalent of which were guanosine and uridine. Guanylylation was associated with somewhat longer half-life, and subsequent work showed uridylation stimulated decay (26). Since to date no singular feature has been identified that uniquely distinguishes cytoplasmic capping targets from the rest of the transcriptome, in Figure 6A and B and Supplementary Table S2 the 16 952 Entrez genes that encode transcripts identified in (12) were compared with the database of single and multiply modified transcripts identified in (18). Fisher's Exact Test performed on the 3599 genes present in both studies showed no evidence for enrichment of genes with G-tagged poly(A) tails in the overall pool or any of the individual sets of cytoplasmic capping targets, and some bias against this modification (Supplementary Table S2-A). There was a slight enrichment in the common pool for genes with a greater percentage of U-tagged poly(A) tails (Figure 6A and Supplementary Table S2-B, 34% compared to 25% in controls, p = 6.1×10⁻³) and a correspondingly lower representation in this population of genes with a reduced percentage of U-tagged tails (p = 2.9×10⁻⁵). Chang et al. (18) also identified genes with multiply modified ends. There was a somewhat greater overall representation of cytoplasmic capping targets in the multiply modified population (p = 6.4×10⁻⁵, Figure 6B and Supplementary Table S2-C), and again a lower representation in the target population of genes with fewer multiple modifications (p = 1.3×10⁻⁸).
Figure 6.

Correlation between cytoplasmic capping targets, 3′-end modifications and multi-UTR genes. (A) The datasets of cytoplasmic capping targets in (12) and of 3′-end modified transcripts in (18) were converted to their respective Entrez gene IDs. The 4091 genes in the latter study were divided into the upper and lower quartiles for uridylated (1045 upper and 1058 lower) genes and the 3599 genes in common between the two studies were compared using Fisher's Exact Tests to determine the correlations between the three categories of cytoplasmic capping target sets and the upper and lower quartiles of uridylated Entrez gene ID lists. The dashed line indicates values for genes in (12) whose cap status is unaffected by inhibiting cytoplasmic capping. The number of genes in each category is shown beneath in tabular form together with the overall p-value for the upper and lower quartiles of uridylated transcripts. There was no correlation for guanylated transcripts. (B) The analysis in (A) was repeated for total modifications in (18) (1042 genes in the upper and 1033 genes in the lower quartile). (C) The list of 13 354 total and 5864 multi-UTR genes identified in (24) identified by their Entrez gene IDs were intersected with those of (12), and the 12 051 genes that were common to both studies were analyzed as in (A) for correlation between multi-UTR genes and each set of cytoplasmic capping targets.
The poly(A) length analysis in Figure 4 was facilitated by the identification in (24) of multiple cleavage and polyadenylation sites throughout the transcriptome. Because alternative cleavage and polyadenylation affects the complexity and diversity of 3′-UTRs, we wondered whether this might have a role in defining cytoplasmic capping targets. In Figure 6C and Supplementary Table S3 we performed a similar analysis, this time comparing the 16 952 Entrez genes that encode the unaffected, native uncapped, common and capping inhibited transcripts in (12) against the database in (24) of genes whose transcripts undergo alternative cleavage and polyadenylation (i.e. multi-UTR genes). Fisher's Exact Test performed on the 12 051 genes present in both studies showed that cytoplasmic capping targets are, as a group, strongly correlated with multi-UTR genes (p = 1.3×10⁻²⁰). This extended to each target category, with 53% of native uncapped targets, 63% of common targets and 58% of capping inhibited targets encoded by multi-UTR genes compared to 42% of unaffected controls.
Taken together, the data in Figure 6 indicate that cytoplasmic capping targets are more likely than the rest of the transcriptome to have U or multiple nucleotide modifications to the 3′ ends of their poly(A) tail and they are more likely to be encoded by genes with multiple 3′-UTRs. Finally, we looked at the relationship between multi-UTR genes in (24) and 3′-end modifications in (18) (Supplementary Table S3-G). The data show a strong enrichment for both highly uridylated and modified poly(A) tails (p = 3.9×10⁻¹⁶ and p = 6.2×10⁻¹⁸, respectively) in genes with multiple UTRs. The converse is also true, as multi-UTR genes are significantly underrepresented in the genes with sparsely uridylated or modified poly(A) tails (p = 3.7×10⁻¹⁵ and p = 1.2×10⁻¹⁹ respectively).
DISCUSSION
The current study sought to determine if poly(A) tails on cytoplasmic capping targets were of sufficient length to allow these mRNAs to instantly re-enter the translating pool after recapping. With a few exceptions it was generally thought that a 100–150 residue poly(A) tail was required for efficient translation. However, this view changed with transcriptome-wide poly(A) profiling that showed no correlation between translation and poly(A) tail length in differentiated cells (17,18). These findings were consistent with recapping being sufficient for returning uncapped transcripts to the translating pool; however, this remained to be demonstrated. Since deadenylation generally precedes decapping, it was also possible that recapping targets have shortened poly(A) tails that may require some degree of cytoplasmic polyadenylation to be returned to the translating pool. We began by looking at the relationship between poly(A) length and the appearance of uncapped forms of cytoplasmic capping targets. The inhibitory K294A form of cytoplasmic CE is detectable 3 h after adding doxycycline to cells carrying a tet-inducible transgene (Figure 1A). There was no evidence for global changes in poly(A) length regardless of time after induction (Figure 1C), a result that is consistent with the limited impact of K294A on the bulk of the transcriptome as noted in (12).
The first test for changes in poly(A) status looked at differential elution of unaffected and recapped mRNAs bound to oligo(dT) beads as a function of time after K294A induction (Figure 2). If cytoplasmic capping targets were deadenylated prior to losing their caps we would have expected to see a time-dependent increase in the population of recapping targets in the short poly(A) fraction. There was no evidence for this, nor was there any evidence for changes in the elution profile as a function of time after induction for any of the mRNAs examined here.
While these data indicate that target transcripts are polyadenylated, it remained to be determined if the uncapped forms have the same length poly(A) tails as capped forms of these mRNAs. We showed in (12) that capped forms of recapping targets are on polysomes but the stable uncapped forms of the same mRNAs redistribute to non-translating mRNPs. By separating these complexes on sucrose gradients we were able to independently analyze the cap and/or poly(A) status of mRNA harvested from non-translating mRNPs or translating polysomes (Figures 3 and 4). In agreement with our previous results, the population of uncapped target mRNAs recovered with non-translating mRNP increased as a consequence of inhibiting cytoplasmic capping (Figure 3). Importantly, the individual mRNP-bound mRNAs overall had the same length poly(A) tails as the corresponding mRNAs on polysomes, and with the exception of MAPK1, this did not change when cytoplasmic capping was inhibited (Figure 4). The poly(A) length distribution for mRNP-bound MAPK1 was slightly longer from K294A-expressing cells.
While these data support recapping as all that is needed to return these transcripts to the translating pool, mRNPs have both capped and uncapped mRNAs and it was conceivable that only the capped forms were polyadenylated. To address this mRNP-bound RNA from cells that were inhibited for cytoplasmic capping was separated by cap affinity chromatography into capped and uncapped RNAs prior to analyzing poly(A) tail length. This yielded several important observations. One-third of mRNP-bound ZNF207 mRNA is uncapped, both capped and uncapped ZNF207 are polyadenylated, and the uncapped form has an overall longer distribution of poly(A) lengths than capped mRNA.
We also looked at poly(A) length distribution of three unaffected control mRNAs, RPLP0, STRN4 and β-actin. Whereas RPLP0 mRNA had similar length poly(A) in polysomes and mRNP, polysome-bound STRN4 had a broad distribution of poly(A) lengths but only short poly(A) (∼20 nt) on mRNA recovered from non-translating mRNP. An even greater difference was seen for β-actin, where again, the polysome-bound population had a broad distribution of poly(A) tail lengths, and despite repeated attempts, we were unable to detect poly(A) in the mRNP-bound population. Finally, in Figure 5A we examined the poly(A) length distribution of capped and uncapped RPLP0 mRNA present in the same mRNP preparation as ZNF207. Unlike ZNF207 almost all of RPLP0 was recovered in the capped pool, and the distribution of poly(A) tail lengths was similar to that seen in Figure 4A.
The three groups of cytoplasmic capping targets are characterized by a limited number of GO terms; nucleotide binding, protein localization, RNA localization and mitotic cell cycle, with the latter unique to the capping inhibited pool (12). Cytoplasmic capping targets tend to be enriched for microRNA binding sites and AU-rich elements, but neither of these proved to be sufficiently unique so as to distinguish recapping targets from the rest of the mRNA transcriptome. In our quest to identify additional distinguishing features associated with cap homeostasis, each group of target transcripts was evaluated with respect to 3′ end modifications of their poly(A) tails (18) and diversity of 3′-UTRs as determined by alternative cleavage and polyadenylation (24). The TAIL-Seq approach in (18) showed evidence across the mRNA transcriptome for guanylation or uridylation and, to a lesser extent, multiple nucleotide modifications to the 3′ ends of poly(A) tails. Because only a fraction of any given mRNA was modified, we wondered if this might correlate with the presence of uncapped transcripts in the ‘native uncapped’ and common transcript pools. There was no evidence for genes corresponding to transcripts with guanylylated ends in any group of cytoplasmic capping targets, and in fact these were negatively correlated. However, there was a statistically significant enrichment for genes having uridylated and multiply-modified transcripts in the common pool (Figure 6A and B). Until TAIL-Seq is performed on the uncapped mRNAs that accumulate when cytoplasmic capping is inhibited, we can only speculate as to the significance of this correlation. Because uridylated transcripts tend to be less stable (26) (and perhaps more readily decapped?) than the rest of the transcriptome, they may be more likely to become targets of cytoplasmic capping.
A more pronounced correlation was seen when the genes encoding cytoplasmic capping targets were examined for alternative cleavage and polyadenylation sites. In general, cytoplasmic capping targets were more likely than non-targets to have multiple 3′-UTRs (Figure 6C). This was particularly the case for genes in the ‘native uncapped’ and ‘common’ pools, each of which has a pool of natively uncapped transcripts. Since regulatory elements tend to be in the 3′-UTR this finding suggests that alternative cleavage and polyadenylation plays a role distinguishing cytoplasmic capping targets from the rest of the transcriptome. Finally, a recent paper from our lab described a central role for adapter protein Nck1 as the scaffold for assembling the cytoplasmic capping complex (11). Nck1 has three SH3 domains and a single SH2 domain and is best known for its role in transducing receptor tyrosine kinase signaling. CE and the 5′-kinase that generates a diphosphate capping substrate bind, respectively, to the second and third SH3 domains of Nck1, leaving one SH3 and the SH2 domains available for interacting with other proteins, perhaps in response to different signal transduction processes.
We view cap homeostasis as a cyclical process of decapping and recapping that functions to maintain the translating transcriptome and/or as a way of storing specific mRNAs and subsequently reactivating their translation. Our identification of downstream CAGE tags as sites for cytoplasmic capping (27) also suggests that cap homeostasis plays a role in proteome complexity. Our current study offers additional evidence in support of cytoplasmic capping as a cyclical process that impacts translation. Cytoplasmic capping targets differ from most mRNAs in that they retain a full-length poly(A) tail in the absence of a cap and translating ribosomes. Recapping should be all that is needed to restore these mRNAs to the translating pool. The presence of Nck1 at the core of the cytoplasmic capping complex implies a direct link to signal transduction, and the observations in this study linking 3′-end modifications and to alternative cleavage and polyadenylation to cytoplasmic capping point to cap homeostasis as a regulated process, the targets and consequences of which are likely to vary between cells and in response to different stimuli.
Supplementary Material
Acknowledgments
We wish to thank Christine Mayr for sharing lists of genes that are subject to alternative cleavage and polyadenylation, and Brian Kennedy for assistance with bioinformatics.
Disclaimer: The content is solely the responsibility of the authors and does not necessarily represent the official views of Pelotonia, The Ohio State University, the American Heart Association, the National Science Foundation, or the National Institutes of Health.
Footnotes
Present address: Kenji M. Oman, Fred Hutchinson Cancer Center, Seattle, WA, USA.
SUPPLEMENTARY DATA
Supplementary Data are available at NAR Online.
FUNDING
National Institutes of Health [R01 GM084177 to D.R.S.]; National Science Foundation [DMR-1105458 and DMR-1410172 to R.B.]; National Cancer Institute [T32 CA0093338] and a Pelotonia Postdoctoral Fellowship Award to D.L.K.; American Heart Association [13POST172700021 to C.M.]; Ohio State University Center for RNA Biology Predoctoral Fellowship (to J.A.D.). The open access publication charge for this paper has been waived by Oxford University Press - NAR.
Conflict of interest statement. None declared.
REFERENCES
- 1.Topisirovic I., Svitkin Y.V., Sonenberg N., Shatkin A.J. Cap and cap-binding proteins in the control of gene expression. Wiley Interdiscip. Rev. RNA. 2011;2:277–298. doi: 10.1002/wrna.52. [DOI] [PubMed] [Google Scholar]
- 2.Li Y, Kiledjian M. Regulation of mRNA decapping. Wiley Interdiscip. Rev. RNA. 2010;1:253–265. doi: 10.1002/wrna.15. [DOI] [PubMed] [Google Scholar]
- 3.Fejes-Toth K., Sotirova V., Sachidanandam R., Assaf G., Hannon G.J., Kapranov P., Foissac S., Willingham A.T., Duttagupta R., Dumais E., et al. Post-transcriptional processing generates a diversity of 5′-modified long and short RNAs. Nature. 2009;457:1028–1032. doi: 10.1038/nature07759. [DOI] [PMC free article] [PubMed] [Google Scholar]
- 4.Djebali S., Davis C.A., Merkel A., Dobin A., Lassmann T., Mortazavi A., Tanzer A., Lagarde J., Lin W., Schlesinger F., et al. Landscape of transcription in human cells. Nature. 2012;489:101–108. doi: 10.1038/nature11233. [DOI] [PMC free article] [PubMed] [Google Scholar]
- 5.Batut P., Dobin A., Plessy C., Carninci P., Gingeras T.R. High-fidelity promoter profiling reveals widespread alternative promoter usage and transposon-driven developmental gene expression. Genome Res. 2013;23:169–180. doi: 10.1101/gr.139618.112. [DOI] [PMC free article] [PubMed] [Google Scholar]
- 6.Mascarenhas R., Dougherty J.A., Schoenberg D.R. SMG6 cleavage generates metastable decay intermediates from nonsense-containing β-globin mRNA. PLoS One. 2013;8:E74791. doi: 10.1371/journal.pone.0074791. [DOI] [PMC free article] [PubMed] [Google Scholar]
- 7.Lim S.K., Sigmund C.D., Gross K.W., Maquat L.E. Nonsense codons in human β-globin mRNA result in the production of mrna degradation products. Mol. Cell. Biol. 1992;12:1149–1161. doi: 10.1128/mcb.12.3.1149. [DOI] [PMC free article] [PubMed] [Google Scholar]
- 8.Lim S.K., Maquat L.E. Human β-globin mRNAs that harbor a nonsense codon are degraded in murine erythroid tissues to intermediates lacking regions of exon I or exons I and II that have a cap-like structure at the 5′ termini. EMBO J. 1992;11:3271–3278. doi: 10.1002/j.1460-2075.1992.tb05405.x. [DOI] [PMC free article] [PubMed] [Google Scholar]
- 9.Stevens A., Wang Y., Bremer K., Zhang J., Hoepfner R., Antoniou M., Schoenberg D.R., Maquat L.E. β-globin mRNA decay in erythroid cells: UG site-preferred endonucleolytic cleavage that is augmented by a premature termination codon. Proc. Natl. Acad. Sci. USA. 2002;99:12741–12746. doi: 10.1073/pnas.192442399. [DOI] [PMC free article] [PubMed] [Google Scholar]
- 10.Otsuka Y., Kedersha N.L., Schoenberg D.R. Identification of a cytoplasmic complex that adds a cap onto 5′-monophosphate RNA. Mol. Cell Biol. 2009;29:2155–2167. doi: 10.1128/MCB.01325-08. [DOI] [PMC free article] [PubMed] [Google Scholar]
- 11.Mukherjee C., Bakthavachalu B., Schoenberg D.R. The cytoplasmic capping complex assembles on adapter protein Nck1 bound to the proline-rich C-terminus of mammalian capping enzyme. PLoS Biol. 2014;12:E1001933. doi: 10.1371/journal.pbio.1001933. [DOI] [PMC free article] [PubMed] [Google Scholar]
- 12.Mukherjee C., Patil D.P., Kennedy B.A., Bakthavachalu B., Bundschuh R., Schoenberg D.R. Identification of cytoplasmic capping targets reveals a role for cap homeostasis in translation and mRNA stability. Cell Rep. 2012;2:674–684. doi: 10.1016/j.celrep.2012.07.011. [DOI] [PMC free article] [PubMed] [Google Scholar]
- 13.Barnard D.C., Ryan K., Manley J.L., Richter J.D. Symplekin and xGLD-2 are required For CPEB-mediated cytoplasmic polyadenylation. Cell. 2004;119:641–651. doi: 10.1016/j.cell.2004.10.029. [DOI] [PubMed] [Google Scholar]
- 14.Thoma C., Ostareck-Lederer A., Hentze M.W. A poly(A) tail-responsive in vitro system for cap- or IRES-driven translation from Hela cells. In: Schoenberg DR, editor. mRNA Processing and Metabolism; Methods a/nd Protocols(14) Totowa: Humana Press; 2004. pp. 171–180. [DOI] [PubMed] [Google Scholar]
- 15.Peng J., Murray E.L., Schoenberg D.R. In vivo and in vitro analysis of poly(A) length effects on mRNA translation. Methods Mol. Biol. 2008;419:215–230. doi: 10.1007/978-1-59745-033-1_15. [DOI] [PMC free article] [PubMed] [Google Scholar]
- 16.Schoenberg D.R., Maquat L.E. Regulation of cytoplasmic mRNA decay. Nat. Rev. Genet. 2012;13:246–259. doi: 10.1038/nrg3160. [DOI] [PMC free article] [PubMed] [Google Scholar]
- 17.Subtelny A.O., Eichhorn S.W., Chen G.R., Sive H., Bartel D.P. Poly(A)-tail profiling reveals an embryonic switch in translational control. Nature. 2014;508:66–71. doi: 10.1038/nature13007. [DOI] [PMC free article] [PubMed] [Google Scholar]
- 18.Chang H., Lim J., Ha M., Kim V.N. Tail-Seq: genome-wide determination of poly(A) tail length and 3′ end modifications. Mol. Cell. 2014;53:1044–1052. doi: 10.1016/j.molcel.2014.02.007. [DOI] [PubMed] [Google Scholar]
- 19.Molloy G.R., Jelinek W., Salditt M., Darnell J.E. Arrangement of specific oligonucleotides within poly(A) terminated hnRNA molecules. Cell. 1974;1:43–53. [Google Scholar]
- 20.Peng J., Schoenberg D.R. mRNA with a <20 nt poly(A) tail imparted by the poly(a)-limiting element is translated as efficiently in vivo as long poly(A) mRNA. RNA. 2005;11:1131–1140. doi: 10.1261/rna.2470905. [DOI] [PMC free article] [PubMed] [Google Scholar]
- 21.Livak K.J., Schmittgen T.D. Analysis of relative gene expression data using real-time quantitative PCR and the 2(-Delta Delta C(T)) Method. Methods. 2001;25:402–408. doi: 10.1006/meth.2001.1262. [DOI] [PubMed] [Google Scholar]
- 22.Jiao X., Chang J.H., Kilic T., Tong L., Kiledjian M. A mammalian pre-mRNA 5′ end capping quality control mechanism and an unexpected link of capping to pre-mRNA processing. Mol. Cell. 2013;50:104–115. doi: 10.1016/j.molcel.2013.02.017. [DOI] [PMC free article] [PubMed] [Google Scholar]
- 23.Bazzini A.A., Lee M.T., Giraldez A.J. Ribosome profiling shows that miR-430 reduces translation before causing mRNA decay in Zebrafish. Science. 2012;336:233–237. doi: 10.1126/science.1215704. [DOI] [PMC free article] [PubMed] [Google Scholar]
- 24.Lianoglou S., Garg V., Yang J.L., Leslie C.S., Mayr C. Ubiquitously transcribed genes use alternative polyadenylation to achieve tissue-specific expression. Genes Dev. 2013;27:2380–2396. doi: 10.1101/gad.229328.113. [DOI] [PMC free article] [PubMed] [Google Scholar]
- 25.Schoenberg D.R., Maquat L.E. Re-capping the message. Trends Biochem. Sci. 2009;34:435–442. doi: 10.1016/j.tibs.2009.05.003. [DOI] [PMC free article] [PubMed] [Google Scholar]
- 26.Lim J., Ha M., Chang H., Kwon S.C., Simanshu D.K., Patel D.J., Kim V.N. Uridylation by Tut4 and Tut7 marks mRNA for degradation. Cell. 2014;159:1365–1376. doi: 10.1016/j.cell.2014.10.055. [DOI] [PMC free article] [PubMed] [Google Scholar]
- 27.Kiss D.L., Oman K., Bundschuh R., Schoenberg D.R. Uncapped 5′ ends of mRNAs targeted by cytoplasmic capping map to the vicinity of downstream CAGE tags. Febs Lett. 2015;589:279–284. doi: 10.1016/j.febslet.2014.12.009. [DOI] [PMC free article] [PubMed] [Google Scholar]
Associated Data
This section collects any data citations, data availability statements, or supplementary materials included in this article.