Background: Lipin 1β is a phosphatidic acid (PA) phosphatase that generates diacylglycerol for lipid synthesis.
Results: Lipin 1β enzymatic activity is increased by c-Fos. For this, both proteins engage in a physical interaction. The c-Fos domains involved in binding to and activating lipin are not the same.
Conclusion: c-Fos is a novel positive regulator of lipin1β activity.
Significance:c-Fos could regulate glycerolipid synthesis by controlling PA fate.
Keywords: c-Fos, enzyme mechanism, membrane biogenesis, phosphatase, phosphatidic acid, phospholipid metabolism, protein/protein interaction, Forster resonance energy transfer, lipin
Abstract
Phosphatidic acid (PA) is a central precursor for membrane phospholipid biosynthesis. The lipin family is a magnesium-dependent type I PA phosphatase involved in de novo synthesis of neutral lipids and phospholipids. The regulation of lipin activity may govern the pathways by which these lipids are synthesized and control the cellular levels of important signaling lipids. Moreover, the proto-oncoprotein c-Fos has an emerging role in glycerolipid synthesis regulation; by interacting with key synthesizing enzymes it is able to increase overall phospho- and glycolipid synthesis. We studied the lipin 1β enzyme activity in a cell-free system using PA/Triton X-100 mixed micelles as substrate, analyzing it in the presence/absence of c-Fos. We found that lipin 1β kcat value increases around 40% in the presence of c-Fos, with no change in the lipin 1β affinity for the PA/Triton X-100 mixed micelles. We also probed a physical interaction between both proteins. Although the c-Fos domain involved in lipin activation is its basic domain, the interaction domain is mapped to the N-terminal c-Fos. In conclusion, we provide evidence for a novel positive regulator of lipin 1β PA phosphatase activity that is not achieved via altering its subcellular localization or affinity for membranes but rather through directly increasing its catalytic efficiency.
Introduction
Phosphatidic acid (PA)2 is a central precursor for membrane phospholipid biosynthesis (1). It sits at a unique branching point; it can be transformed by a PA phosphatase to diacylglycerol (DAG), a common precursor of the Kennedy pathway, or alternatively, it can be diverted to the pathway of synthesis of phosphatidylinositol and its phosphorylated derivatives by the rate-limiting enzyme CDP-diacylglycerol synthase (2). In comparison with its precursors and metabolites, steady state PA levels are low in growing cells despite the considerable metabolic flux through the cellular PA pool required to sustain phospholipid synthesis. In addition to their biosynthetic roles, PA and DAG are also important for signal transduction cascades (3). PA is implicated in transcription regulation, activation of cell growth, membrane proliferation, secretion, and vesicular trafficking, whereas DAG is primarily involved in the activation of protein kinase C (PKC) and a few non-PKC targets such as protein kinase D or DAG kinases β and γ (4–6).
Lipins are magnesium-dependent PA phosphatases, previously characterized biochemically as type I PA phosphatases (PAP I), that are involved in the de novo synthesis of neutral lipids and phospholipids (7). Unlike other enzymes of the Kennedy pathway, lipins are not integral membrane proteins and need to translocate from the cytosol to the endoplasmic reticulum (ER) to participate in glycerolipid synthesis (8). The lipin 1 polybasic domain (PBD), a stretch of nine consecutive basic amino acids, is involved in selective PA binding to promote its translocation to membranes. This translocation depends on its phosphorylation status; mammalian target of rapamycin-mediated phosphorylation inhibits di-anionic PA recognition by the PBD, the major driving force in membrane association (9). The lipin 1 PBD is also its primary nuclear localization signal. It has been proposed that the dual role for PBM is regulated through PA levels; elevated PA content on cytoplasmic membranes antagonizes nuclear localization of lipin 1 (10). There is evidence that the lipins in the nucleus play a role in directly regulating transcription of genes involved in fatty acid oxidation (11). For example, lipin 1β was shown to interact directly with the peroxisome proliferator-activated receptor α, a key transcription factor of lipid metabolism in the liver, and its co-activator PGC-1α (12). In summary, lipin 1 is capable of regulating cellular lipid status at multiple levels. By regulating the fate of PA through its PAP activity, it can directly regulate phospholipid synthesis, although it can do it indirectly by modulating the activity of transcription factors important for lipid biosynthesis and breakdown.
Another protein that also has both nuclear and cytoplasmic functions is c-Fos, a well known member of the activator protein 1 (AP-1) family of transcription factors. In addition to the latter, c-Fos has another proven activity; it activates the overall metabolic labeling of both phospholipids and glycolipids at the ER in different cellular models of proliferation or differentiation. In differentiating PC12 cells, blocking c-Fos expression impairs both neuritogenesis and the activation of phospholipid and glycolipid synthesis. TLC analysis of total radioactivity in lipid extracts after metabolic labeling of these cells with [14C]Gal showed a 50–60% increase in the labeling of all 14C-labeled lipids, including glycolipids and phosphatidylcholine (13). At the same time, similar experiments carried out with [32P]orthophosphate acid show a similar increase on all 32P-labeled phospholipids (14). These results corroborate a global stimulation of the lipid-synthesizing machinery in the c-Fos-mediated response to a differentiation stimulus of these cells. For a review of processes in which c-Fos has been proven to participate, the reader is referred to Ref. 15. In a very recent report, global transcription changes induced by c-Fos in an AP-1 independent way were described. It was found that this was the consequence of the c-Fos-dependent nuclear synthesis of phosphatidylinositol 4,5-biphosphate, a lipid involved in chromatin remodeling (16). In this way, c-Fos integrates both functions (i) as a lipid synthesis activator and (ii) as a transcriptional modulator.
Previous studies from our laboratory have found higher PAP I and lysophosphatidate acyltransferase activities in retinal ganglion cells from chicken exposed to light with respect to those maintained in the dark (17). Interestingly, no differences were observed in preparations obtained from light-exposed animals treated with a c-fos antisense oligonucleotide. Furthermore, no light-dark differences were found in phosphatidylserine synthase activity. Altogether, these results suggest a c-Fos-dependent glycerolipid synthesis activation that is step-specific. Later studies showed that c-Fos also increases the radiolabeling of the polyphosphoinositide (PIP) pathways in NIH 3T3 cells by increasing the enzymatic activities of CDP-diacylglycerol synthase 1 and phosphatidylinositol 4-kinase (PI4KII) α but not the phosphatidylinositol synthase activity (18). It can be concluded that to attain high rates of membrane biogenesis, c-Fos activates key steps of phospholipid synthesis that result in an overall activated phospholipid synthesis state.
Given the importance of PA in glycerolipid metabolism, the established role of lipin 1, and the emerging functions of c-Fos, it was deemed of interest to study the relationship between lipin 1 and c-Fos. Understanding lipin 1 modulators is central for elucidating the mechanisms that coordinately activate glycerolipid synthesis during proliferation, growth, or differentiation. We found in this study that lipin 1β is activated by c-Fos through its basic domain (BD) and that this activation does not rely on changes on lipin 1β membrane affinity but rather implies changes on its catalytic efficiency. We also demonstrated that lipin 1β associates with the N-terminal region of c-Fos.
Experimental Procedures
Materials
NIH 3T3 mouse fibroblasts were purchased from the American Type Culture Collection. l-α-Dipalmitoyl-[glycerol-14C]PA (specific activity 100–200 mCi/mmol) was purchased from PerkinElmer Life Sciences. [2-3H]Glycerol (specific activity 200 mCi/mmol) and Omnifluor were obtained from PerkinElmer Life Sciences. Cycloheximide, Triton X-100, and ammonium molybdate were from Sigma. DMEM, FBS, calf serum, and Lipofectamine 2000 were from Invitrogen. Nickel-Sepharose high performance was from GE Healthcare. Bradford reagents were from Bio-Rad. l-α-PA (from chicken egg) and other lipids were from Avanti Polar Lipids. FluorSave was from Calbiochem.
Cell Cultures
NIH 3T3 mouse fibroblasts were grown at 37 °C in 5% CO2 in DMEM and 10% calf serum. For establishing quiescence, cells were arrested in serum-free DMEM for 48 h. Quiescent cells were stimulated to re-enter the cell cycle by replacing the medium with 20% FBS supplemented DMEM for 1 h. Then cells were washed twice with chilled PBS, harvested, and homogenized by sonication in Milli-Q water, and finally protein concentration was determined by the Bradford assay.
Plasmid Constructions
His6-tagged c-Fos and c-Fos deletion mutant plasmids were as described previously (18). Lipin 1β-GFP-N1 and pGH327 containing GFP-tagged and His6-tagged lipin 1β were the generous gift from Dr. G. Carman. Full-length calreticulin fused to GFP was the generous gift from Dr. M. Hallak. The plasmids pmTurquoise2-N1, pSYFP2, and pSYFP2-mTurquoise2, with monomeric improved versions of cyan and yellow fluorescent proteins (19), were generous gifts from Drs. J. Goedhart and T. W. Gadella. We subcloned lipin 1β into pSYFP2-N1 by cutting between NheI and XhoI sites. Truncated mutants of c-Fos were obtained by PCR using the full-length c-Fos as template and inserted into pmTurquoise2-N1 vector to generate Turquoise2 fusion proteins.
Expression and Purification of His6-tagged Lipin 1β and c-Fos
Recombinant human lipin 1β was expressed in Rosetta 2(DE3) strain of Escherichia coli and purified as described previously (20). Additionally, recombinant c-Fos and c-Fos mutants were synthesized in BL21 strain of E. coli and purified as described previously (21). Briefly, crude extracts were passed through a nickel-Sepharose affinity column; after washing thoroughly, proteins were obtained in the corresponding elution buffer. The protein concentrations of the purified proteins were determined by the method of Bradford using bovine serum albumin as the standard. The enzyme preparations, which had a final protein concentration of about 0.5 mg/ml, were stored in small aliquots at −80 °C, whereas c-Fos preparations, which were in 6 m urea, were stored at 4 °C for up to 1 month.
Preparation of Radioactive 1,2-Diacyl-sn-glycerol-3-phosphate
Radioactive PA was obtained from [2-3H]glycerol-PC synthesized from bovine retinas incubated with [2-3H]glycerol as described previously (22). Lipids were extracted from the tissue as described elsewhere (23). [2-3H]Glycerol-PC was isolated by mono-dimensional TLC, eluted (24), and hydrolyzed with phospholipase D (25). The hydrolysis product [2-3H]glycerol PA was then purified by one-dimensional TLC on Silica Gel H developed with chloroform/methanol/acetic acid/acetone/water (9:3:3:12:1.5, v/v). Radioactivity and phosphorus content (26) were measured to determine specific radioactivity. [2-3H]PA with a specific radioactivity of 0.1 μCi/μmol was obtained.
Preparation of Malachite Green-Molybdate Reagent
A color reagent to detect inorganic free phosphate composed of 3 volumes of 0.1 mm malachite green and 1 volume of 34 mm ammonium molybdate in 5 m HCl was prepared as described by Mahuren et al. (27).
Preparation of Triton X-100/PA-mixed Micelles
The micelles were prepared fresh on the day of the experiment as described previously (20). PA in chloroform/methanol (2:1) was transferred to a glass test tube, dried under a nitrogen flow, and finally kept in vacuo for 1 h. Triton X-100 was added to PA just after buffer to prepare Triton X-100/PA-mixed micelles. Extensive vortex of the tube ensures micelle formation. The mol % of PA in a Triton X-100/PA-mixed micelle was calculated using the following formula: mol % PA = 100 × [PA (molar)]/([PA (molar)] + [Triton X-100(molar)]). In a similar way, mol % of recombinant c-Fos on the micelles was calculated as mol % c-Fos = 100 × [c-Fos (molar)]/([PA (molar)] + [Triton X-100(molar)]).
Enzyme Assays
PA phosphatase activity in total cellular homogenates was determined as described previously (28, 29) with minor modifications, which consisted in employing either [2-3H]PA or [14C]PA. PAP activities were differentiated on the basis of N-ethylmaleimide sensitivity (30). For this, parallel incubations were carried out after preincubating the homogenate with or without 4.2 mm N-ethylmaleimide for 10 min. The difference between these two activities was PAP I activity. The assays were conducted at 37 °C for 20 min and stopped by adding chloroform/methanol (2:1, v/v). The reaction product was separated by TLC as described elsewhere (17); bands where scraped and measured using liquid scintillation counting.
PA phosphatase activity in PA/Triton X-100 mixed micelles was measured as described previously (20). Briefly, unless otherwise specified, the reaction mixture contained 50 mm Tris-HCl, pH 7.5, buffer, 0.5 mm MgCl2, 10 mm 2-mercaptoethanol, 1 mm PA, 10 mm Triton X-100, and 50 ng of enzyme protein in a total volume of 0.1 ml. The reaction mixture was incubated at 37 °C for 20 min. The reaction was terminated by adding 0.5 ml of 0.1 m HCl in methanol, 1 ml of chloroform, and 1 ml of water. After phase separation, 1 volume of the upper phase was mixed with 2 volumes of malachite green-molybdate reagent, and absorbance at 650 nm was measured. All assays contained 20 mm urea from the addition of recombinant proteins; this urea content did not alter enzyme activity (data not shown). Enzyme assays were conducted in triplicate. All enzyme reactions were linear with time and protein concentration. A unit of enzymatic activity was defined as the amount of enzyme that catalyzed the formation of 1 μmol of product/min.
Data Analyses
Kinetic data were analyzed according to the Michaelis-Menten and Hill equations using the SigmaPlot enzyme kinetics module. Student's t test (SigmaPlot software) was used to determine statistical significance, and p values of <0.05 were taken as a significant difference.
Immunoprecipitation Assays
The assays were performed as described in Bonifacino and Dell'Angelica (31) with nondenaturing detergent solution. Briefly, quiescent cells were stimulated with 20% FBS for 1 h, harvested, and lysed in ice-cold lysis buffer (1% Triton X-100, 50 mm Tris, pH 7.5, 120 mm NaCl) with complete Protease Inhibitor Mixture (Roche Applied Science). Lysates were preabsorbed with 25 μl of protein G-Sepharose (GE Healthcare) for 1 h and centrifuged at 4 °C for 10 min at 4,200 rpm. Protein complexes in the supernatant were immunoprecipitated using 50 μl of protein G-Sepharose beads coupled to 1 μg of rabbit anti-c-Fos antibody (sc-52, Santa Cruz Biotechnology) overnight in an orbital shaker. The immunoprecipitates were washed four times with washing buffer (0.1% Triton X-100, 50 mm Tris, pH 7.5, 120 mm NaCl, and Protease Inhibitor Mixture) and once with 10 mm PBS and analyzed by Western blot.
Western Blot Analysis
Total cell lysates and immunoprecipitates were subjected to SDS-PAGE under reducing conditions on 12% polyacrylamide gels and transferred to nitrocellulose membrane as described previously (14). Blocked membranes were incubated with the specified primary antibody, washed twice with PBS/Tween 0.1%, and incubated using the appropriate secondary antibodies (LI-COR) (1:25,000). Immunoreactive bands were detected by Odyssey infrared imaging system (LI-COR).
Immunofluorescence Microscopy
Quiescent cells were stimulated with 20% FBS for 1 h. The cells were then washed with PBS and fixed with 4% paraformaldehyde for 12 min at room temperature. Fixed cells were permeabilized with 0.1% Triton X-100/PBS solution during 10 min at room temperature and washed with PBS. Saturation was achieved by incubation with 5% bovine serum albumin in PBS for 1 h. The slides were incubated with the corresponding primary antibody in blocking solution as follows: rabbit anti-c-Fos (dilution 1:50, sc-52, Santa Cruz Biotechnology), goat anti-lipin-1 (dilution 1:50, sc-50049, Santa Cruz Biotechnology) overnight at 4 °C in humid chamber. Then the slides were washed with PBS and incubated with the corresponding Alexa Fluor-conjugated secondary antibody for 1 h at room temperature (Alexa Fluor 488, 546, or 633, Molecular Probes). After washing with PBS, slides were mounted using FluorSave. To determine proper binding and whether the applied antisera interacts, we performed incubations with only one of the primary antibodies (same dilution as in the double label experiments), followed by incubation with the mixture of fluorophore-conjugated secondary antisera.
Confocal images were collected using an Olympus FV-1000 confocal microscope using laser lines from argon laser (488 nm) and two helium neon lasers (543 and 633 nm). We performed the acquisition sequentially for each channel using a clip rectangle to image only a region of interest comprising a single cell. The pixel size was 135 nm/pixel using a confocal pinhole of 110 μm. Instead of using a post-acquisition algorithm, images were taken in the Kalman filtering mode (line × 10) to average out detector shot noise.
FRET Analyses
The procedure was as described previously (18). Briefly, cells were seeded onto 24-well tissue culture dishes containing a coverslip and grown to 80–90% confluence at the time of transfection. After inducing quiescence, 50 μg/ml cycloheximide was added 1 h prior to stimulating cells for another hour with 20% FBS. Then cells were washed with PBS and fixed with 4% paraformaldehyde. Fixed cells were washed with PBS and rinsed with Milli-Q water. Coverslips were mounted with FluorSave and visualized using an Olympus FV1000 or FV300 confocal laser scanning microscope. A plan apochromat 60×, numerical aperture 1.42, oil immersion objective lens zoomed digitally three times, 512 × 512 image resolution was used. The mTurquoise (donor) and SYFP2 (acceptor) chimeric proteins were excited with an argon laser at 458 and 515 nm, respectively. The emission channel was 465–495 nm for the donor and 530–560 nm for the acceptor.
The sensitized emission measurement was the chosen approach. We used the algorithm described by Elangovan et al. (32). Post-acquisition cell-by-cell image analysis and quantification were performed with ImageJ as described elsewhere. The Dex/Dem shows the quenched donor (qD) fluorescence and corresponds to the donor channel (D), whereas the Aex/Aem indicates the acceptor fluorescence and corresponds to the acceptor channel (A). The Dex/Aem corresponds to the uncorrected FRET (uFRET) image, which is then processed by the Elangovan algorithm to generate the precision-FRET (PFRET) image, showing the corrected energy transfer levels in Equation 1,
where the coefficients for donor cross-talk (CTD) and acceptor bleed through (BTA) were calculated from single transfected donor or acceptor, respectively.
The energy transfer efficiency, shown in Equation 2,
 |
is expressed as a percentage of the fluorescence of donor in the absence of FRET or unquenched donor uD. This last parameter was calculated as shown in Equation 3
as an approximation of Equation B.19 in Ref. 32. After background subtraction, a mask was applied independently to qD, uFRET, and A images to exclude saturated pixels or pixels above a defined threshold from the analysis. Mean E values were calculated from regions of interest (ROIs) according to Equation 4
 |
on a pixel-by-pixel basis. Thus the separation of signal-containing pixels from background pixels for the FRET calculation can be achieved. E images were used for the statistical quantification of the average FRET efficiency both inside and outside the cell nucleus, selecting 5–10 ROIs for each condition in every cell. Pseudocolored E images were generated with ImageJ where the pixel value represents the FRET efficiency value; white is the pSYFP2-mTurquoise2-normalized maximum E value, and black corresponds to the minimum value 0.
Results
PAP I Activity Increases in the Presence of c-Fos
To examine whether c-Fos alters PAP I activity, we collected total cell homogenates from NIH 3T3 cells cultured under different conditions and used them as the enzyme source. Induction of quiescent NIH 3T3 cells to reenter growth by adding FBS to the culture medium promoted an increase in c-Fos expression and, concomitantly, in PAP I activity (Fig. 1, +FBS). If we previously treated the stimulated cells with a specific siRNA against c-Fos to knock down the expression of this protein (Fig. 1, +FBS [siRNA c-Fos]), values similar to control (quiescent cells) were obtained. Consequently, no PAP I activity increase was promoted under this condition. Similar values were observed in cells cultured in the presence or the absence of a non-targeting siRNA when stimulating cells with FBS (Fig. 1, +FBS [siRNA control]). The increase in PAP activity is not, in principle, the consequence of an increase in lipin 1 expression, as no changes were observed by Western blot of the mentioned protein in the time frame of the experiments.
FIGURE 1.
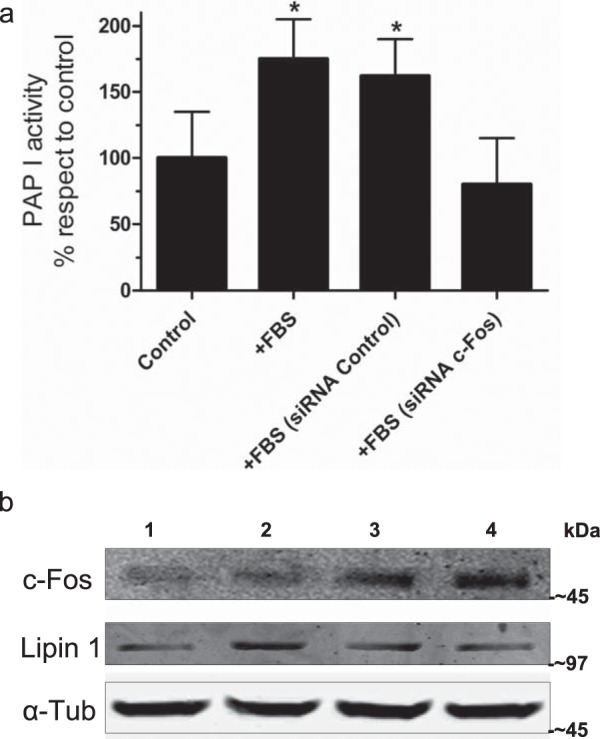
Lipin 1 PAP I activity is depressed in cells after c-Fos knockdown. NIH 3T3 cells were used as enzyme source for the determination of PAP I activity in vitro. a, control, quiescent cells; +FBS are cells stimulated with 20% FBS for 1 h. siRNA c-Fos or siRNA control cells were fed with the corresponding siRNA for 3 days, after which quiescent cells were stimulated and harvested. Control siRNA refers to a siRNA with no target in mouse cells. Results are the mean of two independent experiments performed in triplicate ± S.D. *, p < 0.05 with respect to control, as determined by one-way analysis of variance with Bonferroni post test. b, quiescent cells (lane 1), stimulated cells treated with siRNA targeting c-Fos (lane 2), stimulated cells treated with non-targeting siRNA (lane 3), and stimulated cells (lane 4) were analyzed by Western blot to determine the expression levels of c-Fos (1st row), lipin 1 (2nd row), and α-tubulin (α-Tub), used as a loading control. Molecular weight-size markers are included on the right. Note the decrease in c-Fos expression after culturing the cells in the presence of specific siRNA.
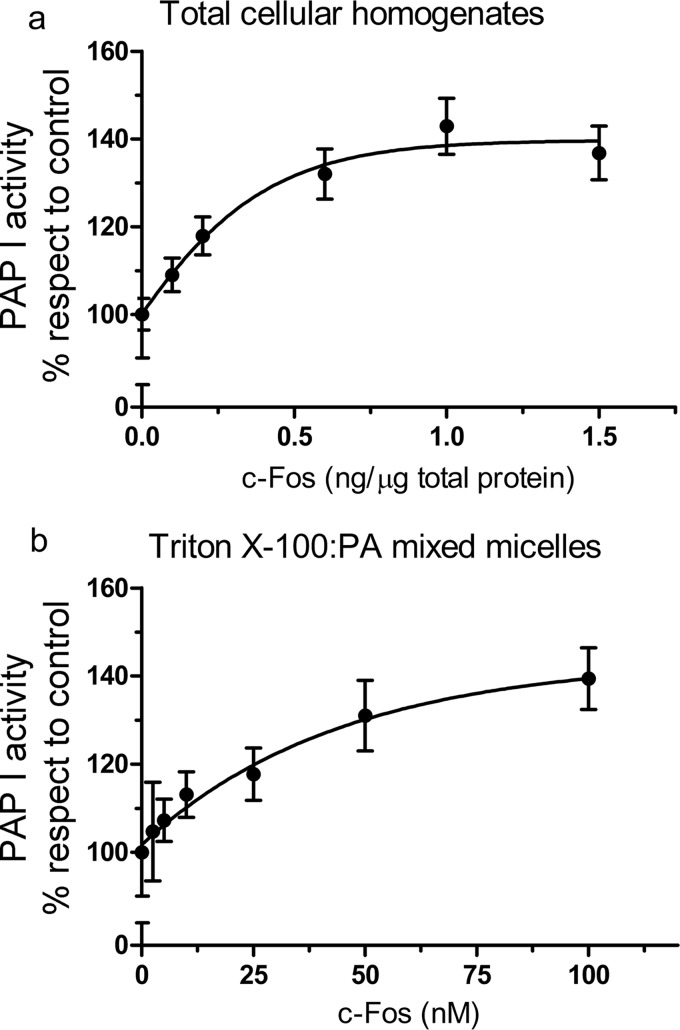
Next, we examined the effect of adding recombinantly produced purified c-Fos to quiescent cell homogenates. We observed an increase in PAP I activity that was dependent on the amount of c-Fos added (Fig. 2a), reinforcing the idea that this protein is involved in activating PAP I activity. The highest amount of c-Fos added to the incubates is similar to a concentration of ∼105 molecules of c-Fos/cell. This concentration is comparable with the amount of c-Fos calculated by Kovary and Bravo (33) to be present in fibroblasts when c-Fos expression is induced.
FIGURE 2.
Effect of c-Fos addition on PAP I activity. a, in vitro PAP I activity in total homogenates from quiescent NIH 3T3 fibroblasts as a function of the amount of recombinant c-Fos added. b, lipin 1β PAP I activity using Triton X-100/PA mixed micelles containing 9.1 mol % and 1 mm PA was measured as a function of the molar concentration of recombinant c-Fos. PAP I activity is expressed with respect to control (set at 100%) in which elution buffer was used instead of c-Fos. Results are the mean ± S.D. of a representative experiment performed in triplicate of at least three performed.
To go one step further, we decided to use a model membrane system with Triton X-100/PA mixed micelles in which we assayed purified lipin 1β activity in the presence/absence of c-Fos (Fig. 2b). Alternative splicing of the Lpin1 transcript gives rise to three distinct lipin 1 proteins (lipin 1α, lipin 1β, and lipin 1γ) that may each have unique cellular localization and intrinsic PAP I activity. Lipin 1α appears to be predominantly nuclear, whereas lipin 1β (that possesses an additional 33-aa stretch) resides mostly in the cytoplasm/ER (34). Here, we chose to continue our studies with lipin 1β because of its subcellular localization. As expected, we observed an increase in phosphatase activity by the addition of c-Fos to the assays in a dose-dependent manner. Taking into consideration that the only components present in the assay are lipin 1β, c-Fos, and Triton X-100/PA mixed micelles, we can now discard any other protein(s) being involved in the phenomena.
Basic Domain of c-Fos (aa 139–160) Is Responsible for the Increased Activity of Lipin 1
To ascertain which residues of c-Fos are responsible for the lipin 1β activation, we initially constructed c-Fos deletion mutants and assayed them on the mixed micelles system. A schematic representation of the examined mutants is found on Fig. 3a. We found that the deletion mutant ΔBD (only lacking the 21 residues of BD) is unable to activate the enzyme (Fig. 3b), pointing to the importance of this basic domain for c-Fos-dependent activation. In support of this, NB (aa 1–159 of full-length c-Fos) was found capable of increasing lipin 1β activity, whereas NA (aa 1–138 of c-Fos) was not. The only difference between these c-Fos deletion mutants is that NB contains the 21 aa of the BD domain of c-Fos, whereas NA lacks them. It is worth mentioning that the relevance of BD has already been proved for phospholipid synthesis activation capacity (13, 14, 18). Next, we point-mutated basic residues within this domain in full-length c-Fos. We found that the arginine 146 residue is indispensable for the activation because mutating it abrogates the effect (Fig. 3b). It is not solely an effect on the charge of the BD as substituting arginine 144 for an asparagine residue has no effect. Even more, the R146N mutant is unable to promote either overall glycerolipid or specifically PIP synthesis increase (18).
FIGURE 3.
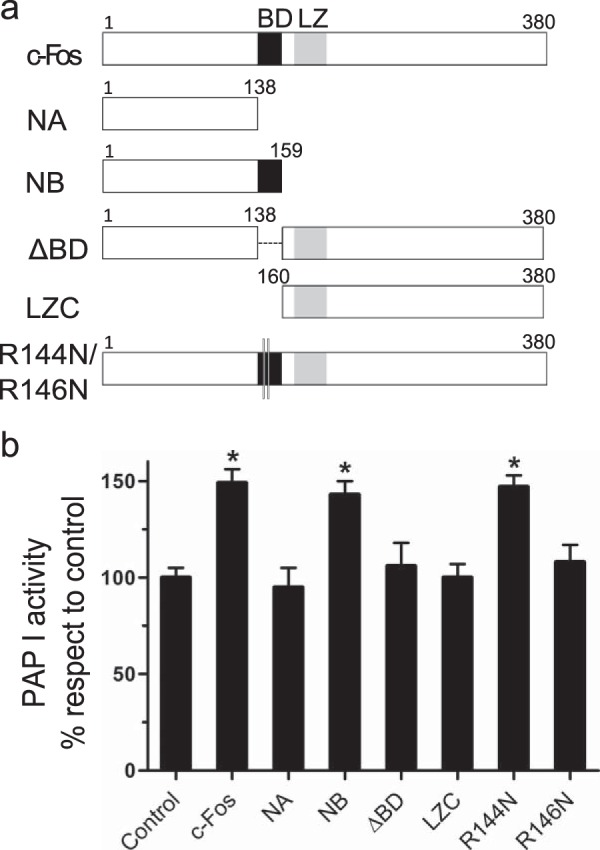
Effect of c-Fos deletion or point mutants on the lipin 1β PAP activity. a, schematic representation of c-Fos and the mutants used in the experiments. BD region (black) and LZ region (gray) are shown in the representation; together these regions constitute the bZip domain. b, lipin 1β PAP I activity was measured using Triton X-100/PA mixed micelles as in Fig. 2b, with or without the addition of 100 nm of the indicated c-Fos mutant. Results are the mean ± S.D. of a representative experiment performed in triplicate of at least three performed. *, p < 0.01. Note the relevance of BD for PAP I activity increase.
Fos Family Member Fra-1 Increases Lipin 1 Activity whereas c-Jun Does Not
The AP-1 is a transcription factor that consists of a heterodimer composed of proteins belonging to the c-Fos, c-Jun, ATF, and JDP families (35). AP-1 members possess a bZip domain, which is composed of a basic domain contiguous to a leucine zipper motif. The basic domain is implicated in sequence-specific DNA binding, although the conserved leucine residues allow dimerization and consequently the formation of transcriptionally active AP-1 dimers. Although the Jun family exists as homo- and heterodimers, the Fos family, which cannot homodimerize, forms stable heterodimers with Jun proteins (36). Given the role of c-Fos BD in increasing lipin 1β enzymatic activity, we decided to study two other AP-1 members, Fra-1 and c-Jun. Fig. 4, a and b, shows a schematization of the three proteins with their bZip domains alienated, together with an alignment of their BDs. Fra-1 is a member of the Fos family that contains a highly conserved BD with respect to c-Fos, although the total sequence homology between both proteins is less than 44%. On the contrary, c-Jun has a very divergent sequence, including the entire bZip domain. When recombinant Fra-1 was added to the micelle system, we found that it also increases lipin 1β activity as c-Fos does (Fig. 4c). Considering the importance of c-Fos BD in lipin 1β activation and the similarity of both domains, this reinforces the BD participation not only in sequence-specific DNA binding but also in enzyme activation. Although c-Jun has a BD with a similar basic charge density, this protein does not support increased lipin 1β activity when added to the assays instead of c-Fos (Fig. 4c).
FIGURE 4.
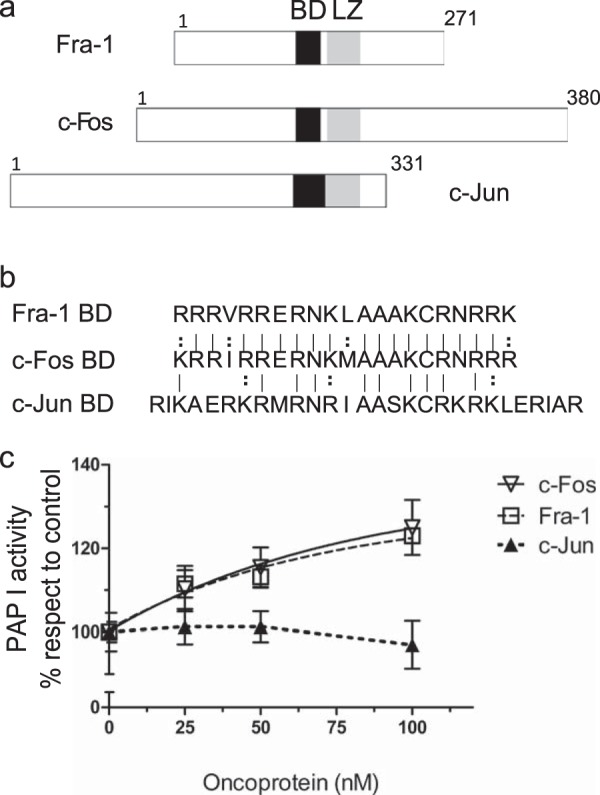
Effect of c-Fos, Fra-1, or c-Jun on lipin 1β PAP activity. a, schematic representation of Fra-1, c-Fos, and c-Jun aligning their bZip domain. b, BDs of the three proteins are aligned. Line represents identity, and colon represents conservative substitutions. Note the high homology between the BD of c-Fos and Fra-1 but not between that of c-Fos and c-Jun or Fra-1 and c-Jun. c, lipin 1β PAP I activity as a function of the molar concentration of the indicated recombinant oncoprotein was measured using Triton X-100/PA mixed micelles as in Fig. 2b. Results are the mean ± S.D. of a representative experiment performed in triplicate of at least three performed.
Lipin 1 and c-Fos Interact in Cells
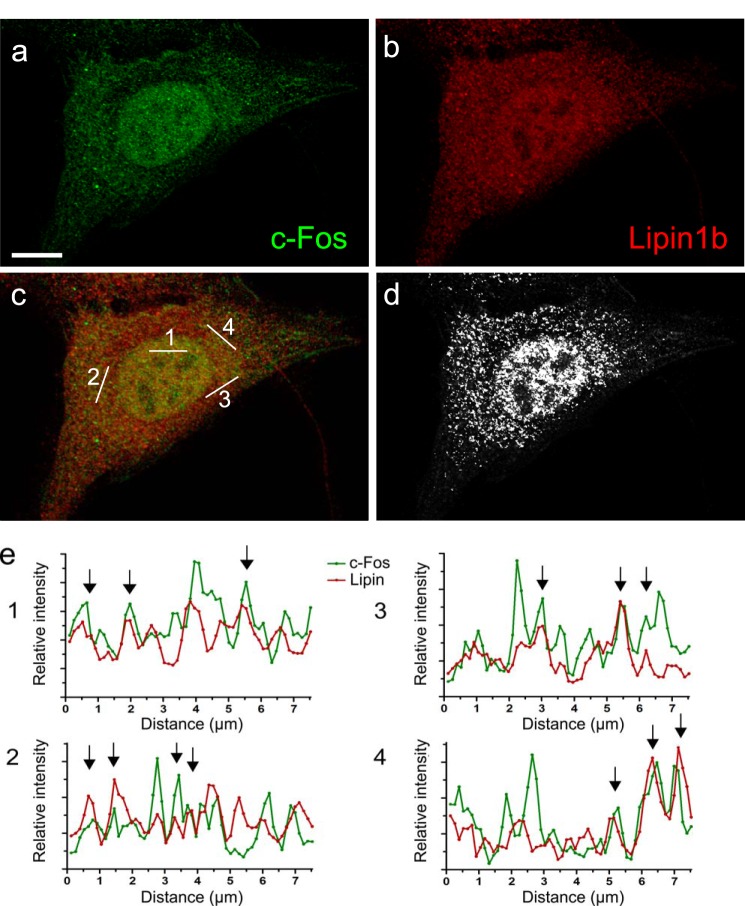
Until now, we have determined that c-Fos is able to increase the activity of lipin through c-Fos BD, both in total homogenates and in a purified system. This posed the question of whether lipin 1 and c-Fos participate in a physical association to attain the activated enzyme state. We started by performing confocal immunofluorescence imaging using antibodies against endogenous c-Fos and lipin 1. Confocal fluorescence images were acquired using the Kalman mode, to average out shot noise from the detector. Then we constructed an intensity profile from the signals of both channels in lines randomly selected to probe a co-distribution of both proteins (Fig. 5d). We found that endogenous c-Fos and lipin 1 co-localize in fixed cells both in the nucleus and in cellular structures at the cytoplasm (Fig. 5).
FIGURE 5.
Immunofluorescence examination shows lipin 1 and c-Fos co-localizing both at the nucleus and cytoplasm. Confocal fluorescence images to show the subcellular localization of endogenous c-Fos and lipin were obtained from NIH 3T3 cells that were stimulated for 1 h with 20% FBS, fixed, and immunostained. a, immunofluorescence of endogenous c-Fos. b, immunofluorescence of endogenous lipin 1. c, merged image of a and b. d, image a pseudocolored in gray with an overimposed white mask of co-localized pixels between c-Fos and lipin 1. This image was obtained with ImageJ “Colocalization Finder” plug-in. e, intensity profiles of the lines randomly drawn in c to show the simultaneous change of both signals in particular points of the profile as indicated with black arrows. Note that lipin 1 and c-Fos endogenous proteins co-distribute both in the cytoplasm and nucleus. Bar, 10 μm.
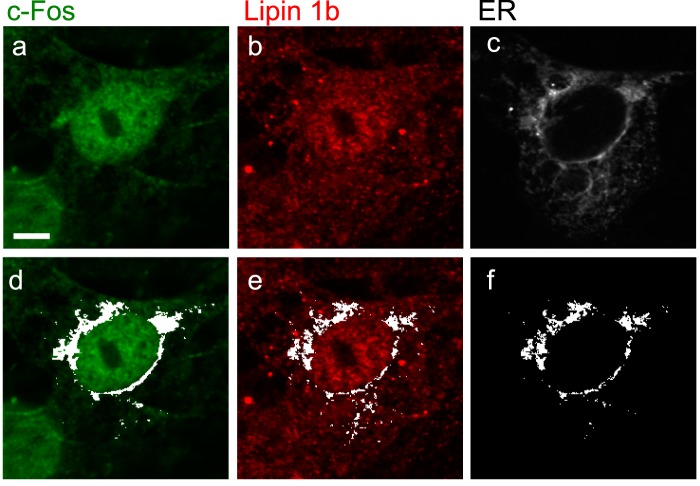
To gain more information on the subcellular localization of these co-localization sites, we performed co-localization fluorescence microscopy of endogenous lipin 1 and c-Fos with the ER marker calreticulin. Lipin 1 has been found to translocate to this organelle (10, 37). Furthermore, we previously found c-Fos tightly associated with the microsomal fraction (38–40) and particularly in the same fractions as the ER in a continuous sucrose gradient (41). Here, we found that both lipin 1 and c-Fos do co-localize with the ER, suggesting that this is a probable site of local enzyme association/activation. In Fig. 6, we use a co-localization mask in white to show c-Fos (Fig. 6d) or lipin (Fig. 6e) co-localization sites with the ER. Finally, we show a mask that indicates the pixels where both c-Fos and Lipin co-localize with the ER (Fig. 6f).
FIGURE 6.
Both lipin 1 and c-Fos co-localize with the ER. Confocal images of quiescent NIH 3T3 cells that were stimulated for 1 h with 20% FBS, fixed, and immunostained for endogenous c-Fos (a) or lipin 1 (b). c, calreticulin-GFP was used as an ER marker. The co-localization mask in white (obtained with ImageJ “Colocalization Finder” plug-in) shows co-localization of c-Fos (d) or lipin 1 (e) with the ER. f, white mask of pixels where both lipin 1 and c-Fos co-localize with the ER. Bar, 5 μm.
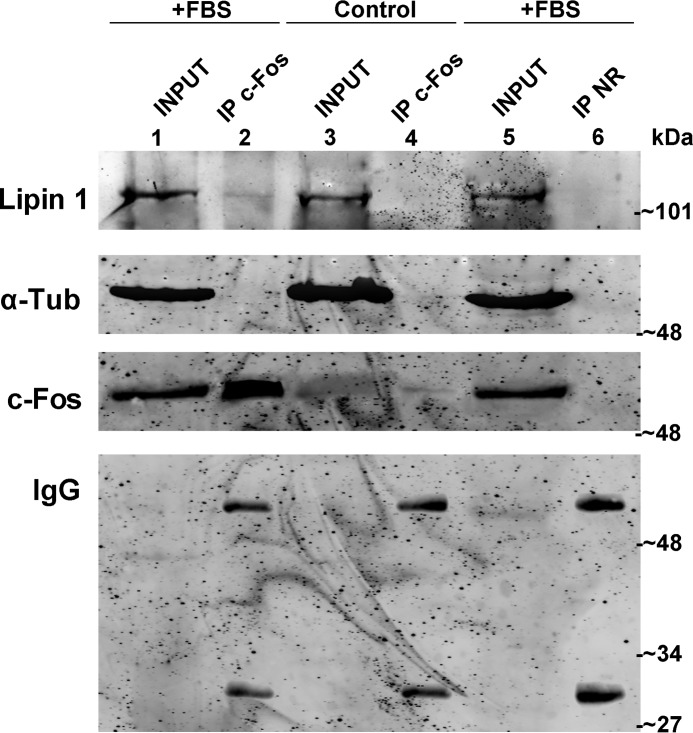
Co-localization does not imply a direct association between proteins. To examine a possible protein/protein association, we carried out co-immunoprecipitation assays. By immunoprecipitating endogenous c-Fos from FBS-stimulated cells, we revealed the presence of lipin 1 in the immunocomplexes thus ascertaining that c-Fos and lipin 1 participate in a physical association (Fig. 7). This direct interaction could in principle explain the activation of lipin 1 enzymatic activity by c-Fos in cells.
FIGURE 7.
Lipin 1 co-immunoprecipitates with c-Fos. Whole-cell extracts from quiescent (control, lane 4) or stimulated cells (+FBS, lanes 2 and 6) were immunoprecipitated (IP) with polyclonal rabbit anti-c-Fos antibody (lanes 2 and 4) or polyclonal rabbit non-related antibody (NR, lane 6). Inputs were 10% of total homogenate of quiescent (control, lane 3) or stimulated (+FBS, lanes 1 and 5) cells. Western blot was revealed against the indicated antibodies (from top to bottom): goat anti-lipin antibody (sc-50049, Santa Cruz Biotechnology); mouse anti-α-tubulin antibody (DM1A, Sigma); mouse anti-c-Fos antibody (sc-8047, Santa Cruz Biotechnology) or secondary anti-rabbit antibody to reveal the IgG heavy and light chains. Note that lipin 1 co-immunoprecipitates with c-Fos in stimulated cells (lane 2).
Lipin 1 Physically Interacts with c-Fos and Fra-1, but Not with c-Jun, in the Cytoplasm
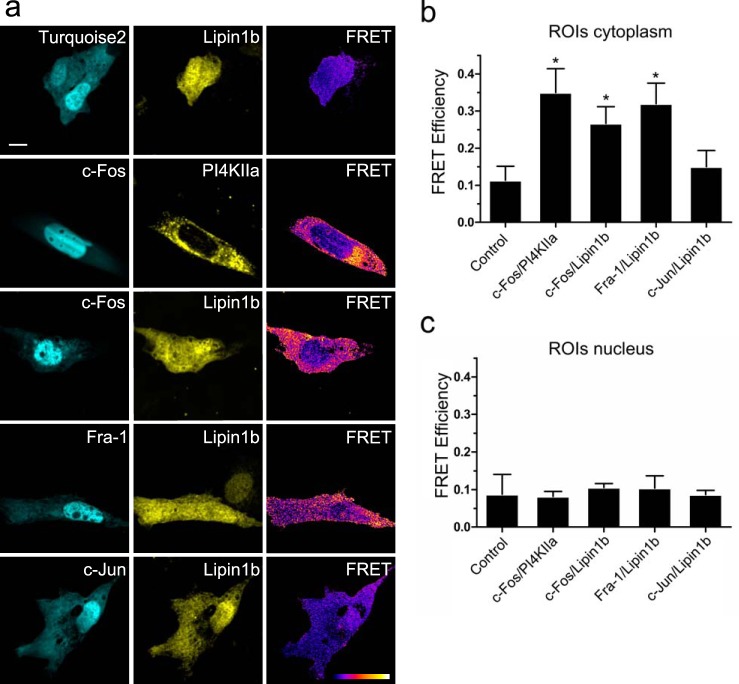
Finally, we conducted sensitized emission FRET microscopy to gain spatial information on the interaction described above (Fig. 8). Because FRET depends on proximity, fluorophores must lie within 1–10 nm of each other for energy transfer to occur, a distance range that is typical of a protein/protein interaction. This requirement for FRET to take place practically excludes the possibility of a third party protein in the middle of the complex (42). We chose the FRET pair mTurquoise2/SYFP2, an improved FRET pair (19). We fused c-Fos, Fra-1, or c-Jun to mTurquoise2 and analyzed the possible association with lipin 1β-SYFP2 in NIH 3T3 cells. As a biologically relevant positive control, we used c-Fos/PI4KIIα, an interaction previously ascertained (18). We found that both c-Fos and Fra-1 physically interact with lipin 1β, whereas c-Jun does not (Fig. 8). This is consistent with the fact that both c-Fos and Fra-1 are capable of activating lipin enzymatic activity.
FIGURE 8.
c-Fos and Fra-1 but not c-Jun undergo FRET with lipin 1β. a, FRET donor mTurquoise2 (left), FRET acceptor mSYFP2 (center), and FRET efficiency image (right). NIH 3T3 cells were transfected with the indicated plasmids, and images of representative cells co-expressing donor/acceptor pairs are displayed. Control is mTurquoise2/Lipin1b-SYFP2 co-transfection. FRET efficiency images were generated with ImageJ. The pixel value represents the FRET efficiency value in a black-to-white increasing scale as shown on the FRET bar on the lower right corner. In the pseudocolored FRET efficiency images, white is the pSYFP2-mTurquoise2-normalized maximum efficiency value, and black corresponds to the minimum value, 0. b, mean FRET efficiency ± S.D. for the donor/acceptor pairs shown in a in ROIs located in the cytoplasm. c, mean FRET efficiency ± S.D. for the donor/acceptor pairs shown in a in ROIs located inside the nucleus. Results obtained after the examination of 25 cells in each case, averaging 10–15 ROIs/cytoplasm or 5–10 ROIs/nucleus for each cell, are from one representative experiment out of at least three performed. *, p < 0.001 as determined by one-way analysis of variance with Dunnett's post test. White bar on the upper left image corresponds to 10 μm.
The co-localization experiments with endogenous proteins are compatible with an interaction occurring in the cytoplasm, the nucleus, or in both compartments. Even though c-Fos displays a nuclear accumulation, it has been shown that c-Fos undergoes an active shuttle between nucleus and cytoplasm (43). Lipin 1β, On the other hand, has been shown to localize both at the nucleus and cytoplasm. Although strong co-localization was observed in the nucleus between both proteins, no positive FRET signals were observed inside this compartment (Fig. 8c). Rather, a distinctive feature of the interaction is that it seems to occur only in the cytoplasm, probably associated with the ER (Fig. 6), as can be seen in the FRET efficiency image and the corresponding quantification (Fig. 8, a and b). This suggests that lipin 1β only associates with c-Fos in the subcellular localization where major lipid synthesis takes place. It should be noted that co-transfection with c-Fos does not alter the localization of lipin1β-SYFP2 (data not shown).
c-Fos Modifies the Lipin 1 Activity by Increasing Its Catalytic Efficiency
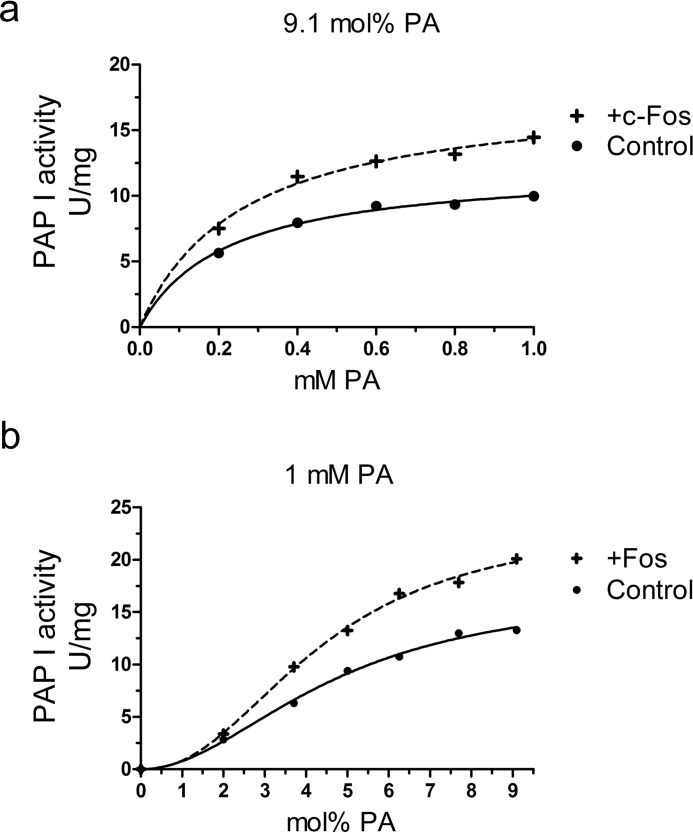
Considering that lipin 1β interacts with and is activated by c-Fos, we next examined the kinetics of the activation to gain information on the molecular mechanism. The enhanced lipin 1β activity in the presence of c-Fos could be due to an increase in the lipin 1β binding affinity for the membrane, an increase in the active site efficiency, or the combination of both. To disclose this, we performed kinetic analyses of the lipin 1β enzymatic activity using Triton X-100/PA-mixed micelles (Fig. 9). This micelle system allows the analysis of the PA phosphatase activities in an environment that mimics the surface of the cellular membrane (20).
FIGURE 9.
Lipin 1β catalytic efficiency but not PA affinity is modified by c-Fos. PAP I activity was measured as a function of the indicated molar concentrations of PA (a) and as a function of the indicated surface concentrations of PA (b) with or without the addition of recombinant c-Fos. For the experiment shown in a, the molar ratio of PA to Triton X-100 was maintained at 9.1 mol %. For the experiment shown in b, the molar concentration of PA was maintained at 1 mm, and the Triton X-100 concentration was varied to obtain the indicated surface concentrations. In both types of experiments, c-Fos mol % was kept constant at 9.09 × 10⁻⁶ mol %, meaning that the ratio between c-Fos to total lipid remains constant. The c-Fos mol % used was the same as in Fig. 2b at 100 nm c-Fos, where the highest activation was achieved. The data shown are means ± S.D. from triplicate enzyme determinations. The best fit curves were derived from the kinetic analysis of the data.
As stated, lipin 1β is a soluble enzyme that must first associate with membranes before searching the surface for its substrate to then catalyze the phosphatase reaction. The process depends both on bulk interactions with the membrane and on surface interactions with the lipids the membrane contains. A kinetic model that describes the situation has been formulated and is termed “surface dilution kinetics” (44). Using this model, two sets of experiments were performed as follows: (i) maintaining PA surface concentration constant at 9.1 mol % while increasing its bulk concentration and (ii) maintaining PA bulk concentration at 1 mm while varying its surface concentration (Fig. 9). Type i experiments allow the examination of the first step, how the enzyme binds to the model membrane in its transition from the solution to the surface through bulk interactions. Because the PA surface concentration must remain fixed, in the practice, to increase the PA molar concentration in the assay, we increase the total number of micelles of the same composition. Type ii, instead, allows the study of how the membrane-bound enzyme finds PA on the membrane surface to carry out the enzymatic reaction. In this case, because the PA molar concentration is fixed, we increase Triton X-100 molar concentration to dilute the surface concentration of PA. In practice, we are greatly increasing the number of micelles having progressively less PA on their surface (20, 44). In both types of experiments, c-Fos mole % was kept constant at 9.09 × 10⁻⁶ mol %, so that the ratio between c-Fos mole content and total lipid mole content remains constant. In other words, the ratio between the number of c-Fos molecules and the number of micelles present in the assays remains unaltered. When we examined every point in the experiments, we found that the activation percentage with respect to control remains constant around 40% in all the conditions assayed (Fig. 9).
Using non-linear regressions, the kinetic parameters were determined (Table 1). It was found in type i that although the kcat value was increased around 50%, c-Fos did not promote a more efficient binding of lipin 1β to the micelles, as Ks value differences were not statistically significant (Fig. 9a). In type ii experiments, we found that the Km is not significantly changed upon c-Fos addition (Fig. 9b). The parameter Km can be considered as the enzyme affinity for its substrate. The established lipin 1 cooperativity (reflected in the Hill number) is not altered. What was positively affected by c-Fos is, once again, the kcat value of the reaction that was increased around 40%. The performed experiments reveal that lipin 1 catalytic efficiency is affected by c-Fos without altering the lipin 1 association to the micelles, reflected on the Ks, or its specific PA interaction, reflected on the Km value.
TABLE 1.
Effect of c-Fos on the kinetic parameters of the PAP activity from lipin 1β using Triton X-100/PA mixed micelles, calculated from data in Fig. 9
| Kinetic constant with respect to molar PA concentration |
Kinetic constant with respect to PA surface concentration |
||||
|---|---|---|---|---|---|
| Ks | kcat | Km | kcat | Hill no. | |
| mm | s−1 | mol % | s−1 | ||
| Control | 0.22 ± 0.03 | 20.3 ± 0.7 | 4.7 ± 0.6 | 28.7 ± 3.0 | 2.0 ± 0.3 |
| +c-Fos | 0.26 ± 0.04 | 29.9 ± 1.6 | 4.4 ± 0.5 | 39.4 ± 2.5 | 2.2 ± 0.2 |
N-terminal 138 Amino Acids of c-Fos Are Responsible for Lipin 1 Association
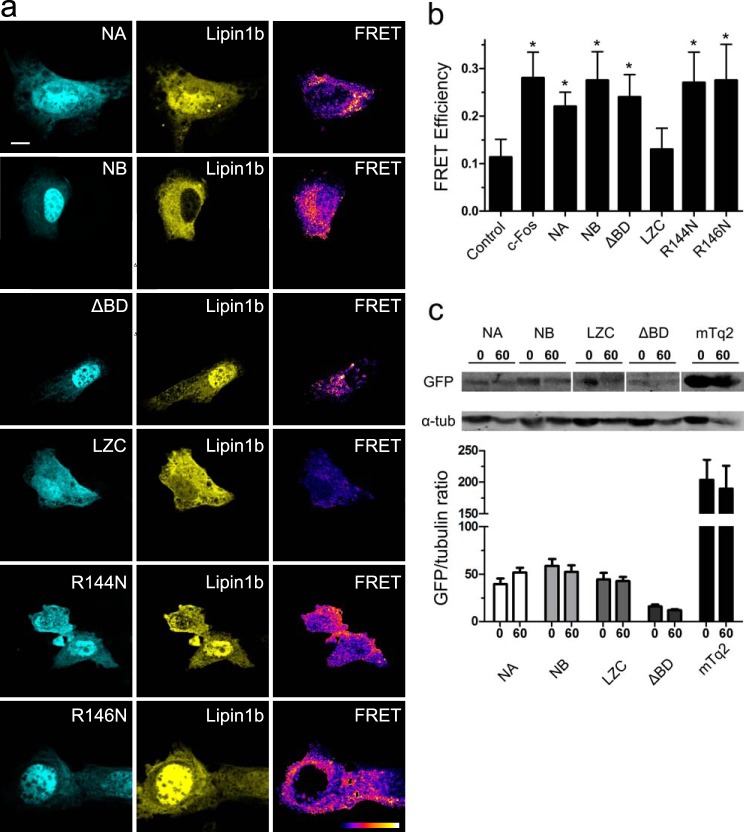
Experiments in Fig. 3 show that the c-Fos BD is responsible for lipin 1β activation. However, the c-Fos association domain remains unresolved. To explore which is c-Fos' association domain(s), we constructed chimeric proteins fusing the different c-Fos deletion or punctual mutants, schematized in Fig. 3a, to mTurquoise2 and determined their possible interaction with lipin1β-SYFP2. We found that NA and NB retain association capacity as full-length c-Fos despite the lack of C-terminal portions (Fig. 10). This together with the absence of association capacity of the LZC mutant (aa 160–380) discards the engagement of the C-terminal region of c-Fos in the interaction. Moreover, ΔBD-mTurquoise2 is still able to bind to lipin 1β even though this mutant is incapable of activating lipin 1β. The same holds true for the R146N punctual mutant; although it is not able to activate lipin 1β, it retains binding capability (Fig. 10, a and b). We also performed Western blot analysis of the c-Fos deletion mutants employed to discard any reduced stability of them (Fig. 10c). We found that despite different levels of transfection or expression, the different mutants were observed at the expected molecular weight displaying similar stabilities.
FIGURE 10.
c-Fos mutants containing the N-terminal domain undergo FRET with lipin 1β irrespective of having or not having the c-Fos BD. a, FRET donor mTurquoise2 (left), FRET acceptor mSYFP2 (center), and FRET efficiency image (right). NIH 3T3 cells were transfected with the indicated plasmids, and images of representative cells co-expressing donor/acceptor pairs are displayed. FRET efficiency images were generated with ImageJ, and the pixel value represents the FRET efficiency value in a black-to-white increasing scale as described in the legend to Fig. 8. b, mean FRET efficiency ± S.D. for the donor/acceptor pairs shown in a in ROIs located in the cytoplasm. Results obtained after the examination of 25 cells in each case, averaging 10–15 ROIs/cell, are from one representative experiment out of at least three performed. *, p < 0.001 as determined by one-way analysis of variance with Dunnett's post test. White bar on the upper left image corresponds to 10 μm. c, NIH 3T3 cells treated as in a. After establishing quiescence, 50 μg/ml cycloheximide was added for 1 h (time point “0”). Then cells were stimulated for another hour with 20% FBS in cyclohemixide-containing DMEM (time point “60”). At time 0 or 60 cells were washed with PBS and harvested. Top, homogenates from one 6-well plate of each condition were subjected to Western blotting to determine the expression levels of the mTurquoise2-tagged mutants using a monoclonal rabbit anti-GFP antibody (top) or α-tubulin (α-tub) used as a loading control. Bottom, quantification of the Western blot bands to make a ratio of the GFP/α-tubulin bands and to account for protein changes due to cycloheximide treatment. In all cases, cycloheximide treatment promoted an overall decrease in cellular protein content as observed in the content of the mutants or tubulin. However, no differences were found in the stability of each mutant (60 min versus 0 min) despite the different transfection/protein levels observed between them. Note that FRET microscopy is a single cell assay, and we were able to image cells with similar expression levels of the tagged proteins for each condition.
The shared region of all the mutants that maintain the ability to bind lipin1β is the first 138 amino acids of c-Fos, pointing to this region as the responsible for the association. In summary, the experiments shown in Figs. 3 and 10 indicate that although the N-terminal domain is involved in the protein/protein interaction, the BD is responsible for enzyme activation thus disclosing the binding and associating domains of c-Fos with lipin 1β as different ones.
Region Comprising Amino Acids 47–90 within the c-Fos N Terminus Is Involved in the Lipin 1/c-Fos Association
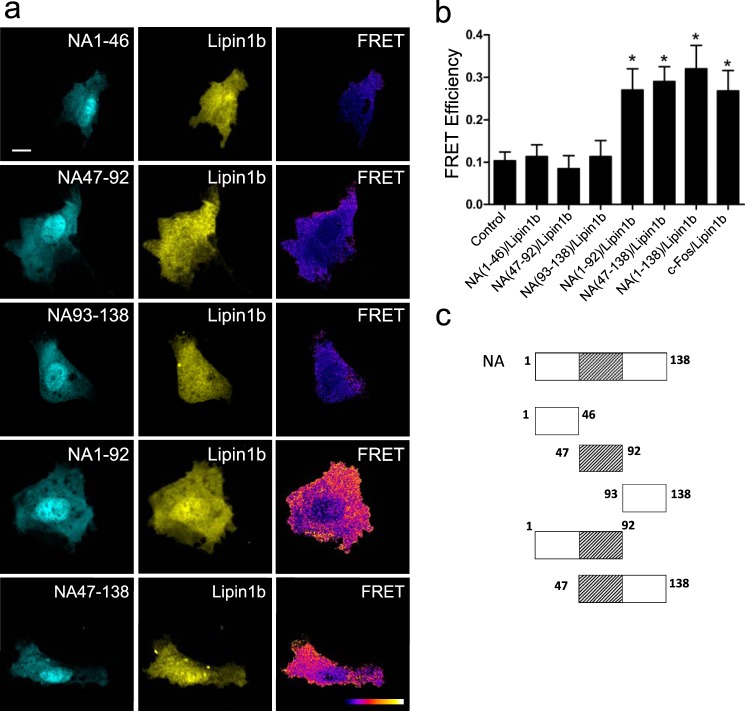
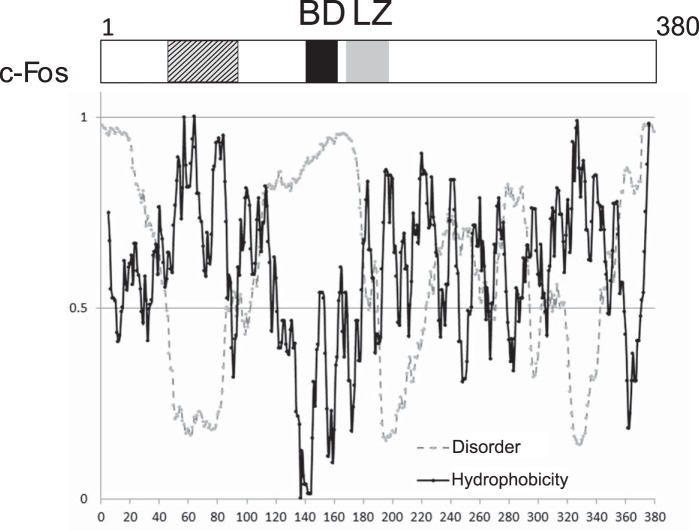
Given the importance of the finding that the N terminus binds to but does not activate lipin 1, we sought to reveal the minimal region capable of binding to lipin 1β. To this end, we constructed mutants comprising different portions of the first 138 c-Fos amino acids that are represented in Fig. 11c. The three small 46-aa-long mutants (NA1–46, NA47–92, and NA93–138) showed no physical association with lipin 1β (Fig. 11). Surprisingly, either the first 92 aa or the aa between 47 and 138 show a FRET efficiency comparable with wild-type c-Fos. One possible explanation is that the region aa 47–92 (the minimum shared region of the two interacting mutants) is involved in the lipin 1β association, but this region alone is not sufficient to secure the binding. Another possible explanation is that aa 47–92 are sufficient for lipin 1β binding, but due to the presence of the large fluorescent protein, there is a steric hindrance that prevents the binding of the 46-aa-long residue peptide binding to the membrane. A hydrophobic profile of c-Fos shows two contiguous hydrophobic stretches that have the highest scores of the entire protein between residues 50–68 and 76–86 (Fig. 12). Hydrophobicity seems to have a relevant role for the association. Because either the first 46 aa (1–46) or the last 46 aa (93–138) are also required for the association, it could be that these residues are acting simply as spacers/flexible linkers between the hydrophobic section associated with the membrane/enzyme and the fluorescent protein. Alternatively, there could be something special about c-Fos regions aa 1–46/93–138, as discussed under the “Discussion.”
FIGURE 11.
FRET microscopy reveals the importance of c-Fos 47–93-aa region for lipin 1β association. a, FRET donor mTurquoise2 (left), FRET acceptor mSYFP2 (center), and FRET efficiency image (right). NIH 3T3 cells were transfected with the indicated plasmids, and images of representative cells co-expressing donor/acceptor pairs are displayed. FRET efficiency images were generated with ImageJ; the pixel value represents the FRET efficiency value in a black-to-white increasing scale as described in the legend to Fig. 8. b, mean FRET efficiency ± S.D. for the donor/acceptor pairs shown in a in ROIs located in the cytoplasm. Results obtained after the examination of 25 cells in each case, averaging 10–15 ROIs/cell, are from one representative experiment out of at least three performed. *, p < 0.001 as determined by one-way analysis of variance with Dunnett's post test. White bar on the upper left image corresponds to 10 μm. c, schematic representation of the NA mutants used in a. The high hydrophobicity region of aa 47–93 is highlighted using diagonal lines as it showed particular importance in the protein/protein association.
FIGURE 12.
Schematic representation of c-Fos domains. Top, LZ is the leucine zipper domain that allows dimerization and, consequently, AP-1 formation. BD is the 21-long stretch responsible for both specific DNA binding and target enzyme activation. The N terminus (first 138 residues) has an established role in the protein/protein interaction with phospholipid synthesis enzymes. The domain between residues 47 and 92 that has a relevant role in this interaction, as established here, is represented with diagonal lines pattern. Bottom, sequence-based predictors of c-Fos disorder and hydrophobicity. In gray is a representation of residue disorder probability obtained using PONDR-FIT (52) as a function of residue number. The cutoff value is 0.5, meaning that values over 0.5 correspond to disordered residues. In black is a representation of residue hydrophobicity obtained using the Kyte and Doolittle scale (53) as a function of residue number. Please note that, as discussed in the text, the region between residues 47 and 92 has two highly hydrophobic clusters overlapping with a non-disordered stretch.
Discussion
The biological relevance of lipin 1 has been already put forward by many studies; genetic and biochemical studies in yeast and mammalian cells have revealed PAP I as a crucial regulator of lipid metabolism and cell physiology (7, 8, 11, 45). The regulation of lipin activity determines not only the relative proportions of its substrate PA and its product DAG but also the distribution of the glycerol backbone between the two branches of the pathways, either to the PIP pathway or the Kennedy pathway. Thus, the regulation of PAP activity may govern the pathways by which these lipids are synthesized. In the past few years, many reports have shown new lipin 1 partners that regulate its subcellular distribution by post-translational modification and/or by directly associating with it, thus regulating its cellular functions (46–49).
The lipin family is relatively unique in its multicompartmental localization to cytosol, ER membranes, and nuclei. Most other enzymes in the glycerolipid synthesis pathway are integral membrane proteins of the ER (50). Lipin catalytic activity as PAP is exerted at the nuclear/ER membranes, and still lipin activity as a co-transcriptional regulator occurs within the nucleus. Lipin activities and subcellular distribution are regulated by multisite phosphorylation mediated by several kinases/phosphatases, which induce membrane dissociation/association, respectively (46–48). In turn, phosphorylation of lipins alters their subcellular localization and interacting partners, thus indirectly changing PAP activity by preventing substrate encounter and directly by modifying substrate recognition/affinity (7, 9).
As shown here and in contrast to the regulatory mechanisms described so far involving lipin 1 in association with other partner proteins, c-Fos is not involved in the lipin 1 association to a model membrane. It does not change the Ks parameter or Km parameter as shown in Table 1. In addition, as previously stated, overexpressed c-Fos does not alter subcellular localization of lipin 1 either. To our knowledge, this is the first report of a lipin-interacting partner that modifies its activity directly, although the precise mechanism remains elusive. We can speculate that once associated with ER membranes, the c-Fos interacts with lipin 1β and promotes an increase in enzymatic activity in situ.
We have already determined that recombinant c-Fos is able to increase the radiolabeling of all phospholipid species in cellular homogenates (13, 14, 18), although the modified individual steps remain unveiled. In quiescent cultured fibroblasts induced to re-enter the cell cycle, two c-Fos-dependent waves of phospholipid synthesis can be detected (41). The first wave peaks at 7.5 min and returns to control levels by 15 after stimulation. The labeled phospholipids are mainly PIP. The second wave starts at 30 min and remains elevated by 120 min post-stimulation. The profile of labeled phospholipids is different in both waves. In this regard, it has been observed in cultured fibroblasts that c-Fos is able to activate both the conversion of PA to DAG (this study) and to CDP-DAG (18). The changes in c-Fos enzyme activation could in principle explain the differences in the radioactively labeled lipid species during the course of G0/G1 transition. There is no easy way to establish how c-Fos could increase one metabolic step in favor of the other to finally generate a net metabolic influx toward a specific pathway. It is unclear how c-Fos could partition lipids into one or another pathway, but it is clear that the interplay between lipin and c-Fos is involved in the phenomena.
It remains uncertain which domain(s) of lipin 1β region is involved in its association with c-Fos. It is of special interest for future study whether it is a conserved domain in lipins 2 and 3. Is this a general PAP I activation or is it just restricted to lipin 1? In the PIP pathway, we found that PI4KII isoform α but not β associates with and is activated by c-Fos (18). Sequence comparison between isoforms reveals a high degree of similarity between the isoforms within the C-terminal catalytic domain but significantly lower homology within the N-terminal region (first 100 residues). Regarding the lipin family, it shows a conserved domain organization of N-terminal domain (N-LIP) with an unknown function and a C-terminal domain (C-LIP) that contains the catalytic domain, a HAD-like phosphatase motif. In addition to the PBD that is conserved, there are also few regions of high homology together with extensive non-conserved regions. The latter can potentially give us insight of the requirements for the c-Fos interaction (see below).
Increasing evidence supports that the c-Fos-mediated increased glycerophospholipid and glycolipid synthesis occurs through a shared mechanism. Particular enzymes are activated (although others are not), and in all the cases studied, the activation involves a physical association between c-Fos and the activated enzyme. The kinetics of the activation show an increase in Vmax, which depends on c-Fos BD, although no modification on Km is exerted (13, 18). Why then is c-Fos able to specifically bind to enzymes that are so different? One explanation is the fact that c-Fos is an intrinsically disordered protein, which implies it has large regions that lack a well defined three-dimensional structure in their native state. Such proteins have a conformational plasticity that allows recognition and binding with a unique combination of high specificity and low affinity interactions (51). We have found that the N terminus of c-Fos is responsible for the specific association with but not the activation of CDP-diacylglycerol synthase 1 (18), PI4KIIα,3 and lipin 1β (this study). The entire c-Fos protein is an intrinsically disordered protein, including its N terminus. However, using different disorder predictors, we observe that the disorder probability drops significantly in the region around aa 45–80 (depending on the predictor used). Fig. 12 shows a disorder probability representation of c-Fos residues using PONDR-FIT (52) together with a hydrophobicity profile using the Kyte and Doolittle scale (53). Although charge repulsion favors unfolding, increased hydrophobicity favors folding as ascertained by initial but still effective disorder models (54). The high hydrophobicity of this particular region has already been pointed out under “Results,” where it has been implicated in the association with lipin 1β (Fig. 11). The regions with increased order propensity are often found to be functional domains within disordered proteins and participate in the molecular recognition of multiple binding targets (55).
The 47–90-aa region is flanked by two long flexible unstructured regions (Fig. 12). In this regard, it is worth mentioning that tyrosine phosphorylation on residues Tyr-10 and Tyr-30 renders c-Fos unable to associate with the ER and consequently to activate lipid synthesis (39). In light of the present findings, it seems reasonable to hypothesize that Tyr phosphorylation is somehow affecting the 47–90-aa region that interacts with membranes and/or target enzymes. It also adds a new level of regulation; besides c-Fos' tightly controlled expression, nuclear import/export, and degradation, the Tyr phosphorylation status also regulates its non-genomic function.
We have already proved the involvement of Fra-1 in the proliferation of breast cancer cells by increasing phospholipid labeling (38). Here, we also confirmed that at least for PAP I, Fra-1 is able to increase enzyme activity as c-Fos does. We have already pointed out the homology of BD of both proteins and the relevance of this c-Fos domain as demonstrated by c-Fos mutants. Here, we have also demonstrated a direct binding with lipin 1β. Consequently, we can make some speculations about the regions of Fra-1 involved in the lipin 1β interaction. In general terms, there are two highly conserved regions between c-Fos and Fra-1, the bZip domain and the last 70 C-terminal residues of both proteins. However, there is an additional region of similarity between the 54–84-aa residues of c-Fos (aa 31–61 of Fra-1). It is hard to conceive that it is an adventitious event that the third homology region is the one that is involved in its interaction with the enzyme. Disorder and hydropathy predictors also indicate that this Fra-1 region shares the same characteristics as the c-Fos homology region. Futures studies with Fra-1 are projected to confirm whether there is a common mechanism between these two proteins and the cellular consequences of it. We can speculate that the expression of c-Fos, Fra-1, or both proteins in a particular cellular model may determine the final outcome of its membrane biogenesis machinery. For example, the mentioned role on breast cancer cell proliferation is due to a reported increased Fra-1 expression in these particular tumors.
Phospholipid synthesis-activated status that is dependent on c-Fos provides a common mechanism of enzyme regulation. By establishing the basic mechanisms of glycerolipid synthesis modulation, we can now pursue new ways of intervening on lipid metabolism. Future studies warrant advances in this sense.
Author Contributions
A. M. C. G., C. G. P., and B. L. C. conceived and designed the experiments. A. M. C. G., C. G. P., V. L. G., and M. L. R. performed the experiments. S. J. P. conceived the experiments of Fig. 1 and contributed to the preparation of this figure. A. M. C. G. and B. L. C. analyzed the data and wrote the paper. All authors reviewed the results and approved the final version of the manuscript.
Acknowledgments
We thank Dr. Hugo Maccioni for critical reading of the manuscript and Dr. Carlos Mas for excellent technical assistance. lipin 1β constructs were a generous gift from Dr. G. Carman. The plasmids pmTurquoise2, pSYFP2, and pSYFP2-mTurquoise2 were generous gifts from Drs. J. Goedhart and T. W. Gadella. Full-length calreticulin-GFP was a generous gift from Dr. M. Hallak. We also thank Dr. Thurl Harris for always being willing to help us.
This work was supported by grants from the Agencia Nacional de Promoción Científica y Tecnológica, Secretaría de Ciencia, Tecnología e Innovación Productiva de Argentina, Instituto Nacional de Cáncer, Consejo Nacional de Investigaciones Científicas y Técnicas (CONICET), Secretaría de Ciencia y Tecnología, Universidad Nacional de Cordoba (SeCyT). The authors declare that they have no conflicts of interest with the contents of this article.
C. G. Prucca, A. M. Cardozo Gizzi, and B. L. Caputto, unpublished observations.
- PA
- phosphatidic acid
- BD
- basic domain
- DAG
- diacylglycerol
- PAP
- phosphatidic acid phosphatase
- ER
- endoplasmic reticulum
- PBD
- lipin 1 polybasic domain
- PIP
- polyphosphoinositide
- ROI
- region of interest
- bZip
- basic leucine zipper
- PI4KII
- phosphatidylinositol 4-kinase
- aa
- amino acid.
References
- 1.Carman G. M., and Han G. S. (2009) Phosphatidic acid phosphatase, a key enzyme in the regulation of lipid synthesis. J. Biol. Chem. 284, 2593–2597 [DOI] [PMC free article] [PubMed] [Google Scholar]
- 2.Athenstaedt K., and Daum G. (1999) Phosphatidic acid, a key intermediate in lipid metabolism. Eur. J. Biochem. 266, 1–16 [DOI] [PubMed] [Google Scholar]
- 3.Stace C. L., and Ktistakis N. T. (2006) Phosphatidic acid- and phosphatidylserine-binding proteins. Biochim. Biophys. Acta 1761, 913–926 [DOI] [PubMed] [Google Scholar]
- 4.Carrasco S., and Mérida I. (2007) Diacylglycerol, when simplicity becomes complex. Trends Biochem. Sci. 32, 27–36 [DOI] [PubMed] [Google Scholar]
- 5.Wang X., Devaiah S. P., Zhang W., and Welti R. (2006) Signaling functions of phosphatidic acid. Prog. Lipid Res. 45, 250–278 [DOI] [PubMed] [Google Scholar]
- 6.Brose N., Betz A., and Wegmeyer H. (2004) Divergent and convergent signaling by the diacylglycerol second messenger pathway in mammals. Curr. Opin. Neurobiol. 14, 328–340 [DOI] [PubMed] [Google Scholar]
- 7.Harris T. E., and Finck B. N. (2011) Dual function lipin proteins and glycerolipid metabolism. Trends Endocrinol. Metab. 22, 226–233 [DOI] [PMC free article] [PubMed] [Google Scholar]
- 8.Csaki L. S., and Reue K. (2010) Lipins: multifunctional lipid metabolism proteins. Annu. Rev. Nutr. 30, 257–272 [DOI] [PMC free article] [PubMed] [Google Scholar]
- 9.Eaton J. M., Mullins G. R., Brindley D. N., and Harris T. E. (2013) Phosphorylation of lipin 1 and charge on the phosphatidic acid head group control its phosphatidic acid phosphatase activity and membrane association. J. Biol. Chem. 288, 9933–9945 [DOI] [PMC free article] [PubMed] [Google Scholar]
- 10.Ren H., Federico L., Huang H., Sunkara M., Drennan T., Frohman M. A., Smyth S. S., and Morris A. J. (2010) A phosphatidic acid binding/nuclear localization motif determines lipin1 function in lipid metabolism and adipogenesis. Mol. Biol. Cell 21, 3171–3181 [DOI] [PMC free article] [PubMed] [Google Scholar]
- 11.Siniossoglou S. (2013) Phospholipid metabolism and nuclear function: roles of the lipin family of phosphatidic acid phosphatases. Biochim. Biophys. Acta 1831, 575–581 [DOI] [PubMed] [Google Scholar]
- 12.Finck B. N., Gropler M. C., Chen Z., Leone T. C., Croce M. A., Harris T. E., Lawrence J. C. Jr., and Kelly D. P. (2006) Lipin 1 is an inducible amplifier of the hepatic PGC-1α/PPARα regulatory pathway. Cell Metab. 4, 199–210 [DOI] [PubMed] [Google Scholar]
- 13.Crespo P. M., Silvestre D. C., Gil G. A., Maccioni H. J., Daniotti J. L., and Caputto B. L. (2008) c-Fos activates glucosylceramide synthase and glycolipid synthesis in PC12 cells. J. Biol. Chem. 283, 31163–31171 [DOI] [PMC free article] [PubMed] [Google Scholar]
- 14.Gil G. A., Bussolino D. F., Portal M. M., Alfonso Pecchio A., Renner M. L., Borioli G. A., Guido M. E., and Caputto B. L. (2004) c-Fos activated phospholipid synthesis is required for neurite elongation in differentiating PC12 cells. Mol. Biol. Cell 15, 1881–1894 [DOI] [PMC free article] [PubMed] [Google Scholar]
- 15.Caputto B. L., Cardozo Gizzi A. M., and Gil G. A. (2014) c-Fos: an AP-1 transcription factor with an additional cytoplasmic, non-genomic lipid synthesis activation capacity. Biochim. Biophys. Acta 1841, 1241–1246 [DOI] [PubMed] [Google Scholar]
- 16.Ferrero G. O., Renner M. L., Gil G. A., Rodríguez-Berdini L., and Caputto B. L. (2014) c-Fos-activated synthesis of nuclear phosphatidylinositol 4,5-bisphosphate [PtdIns(4,5)P(2)] promotes global transcriptional changes. Biochem. J. 461, 521–530 [DOI] [PubMed] [Google Scholar]
- 17.de Arriba Zerpa G. A., Guido M. E., Bussolino D. F., Pasquare S. J., Castagnet P. I., Giusto N. M., and Caputto B. L. (1999) Light exposure activates retina ganglion cell lysophosphatidic acid acyl transferase and phosphatidic acid phosphatase by a c-fos-dependent mechanism. J. Neurochem. 73, 1228–1235 [DOI] [PubMed] [Google Scholar]
- 18.Alfonso Pecchio A. R., Cardozo Gizzi A. M., Renner M. L., Molina-Calavita M., and Caputto B. L. (2011) c-Fos activates and physically interacts with specific enzymes of the pathway of synthesis of polyphosphoinositides. Mol. Biol. Cell 22, 4716–4725 [DOI] [PMC free article] [PubMed] [Google Scholar]
- 19.Goedhart J., von Stetten D., Noirclerc-Savoye M., Lelimousin M., Joosen L., Hink M. A., van Weeren L., Gadella T. W. Jr., and Royant A. (2012) Structure-guided evolution of cyan fluorescent proteins towards a quantum yield of 93%. Nat. Commun. 3, 751. [DOI] [PMC free article] [PubMed] [Google Scholar]
- 20.Han G. S., and Carman G. M. (2010) Characterization of the human LPIN1-encoded phosphatidate phosphatase isoforms. J. Biol. Chem. 285, 14628–14638 [DOI] [PMC free article] [PubMed] [Google Scholar]
- 21.Borioli G. A., Caputto B. L., and Maggio B. (2001) c-Fos is surface active and interacts differentially with phospholipid monolayers. Biochem. Biophys. Res. Commun. 280, 9–13 [DOI] [PubMed] [Google Scholar]
- 22.Pasquaré de García S. J., and Giusto N. M. (1986) Phosphatidate phosphatase activity in isolated rod outer segment from bovine retina. Biochim. Biophys. Acta 875, 195–202 [DOI] [PubMed] [Google Scholar]
- 23.Folch J., Lees M., and Sloane Stanley G. H. (1957) A simple method for the isolation and purification of total lipids from animal tissues. J. Biol. Chem. 226, 497–509 [PubMed] [Google Scholar]
- 24.Arvidson G. A. (1968) Structural and metabolic heterogeneity of rat liver glycerophosphatides. Eur. J. Biochem. 4, 478–486 [DOI] [PubMed] [Google Scholar]
- 25.Sastry P. S., and Kates M. (1966) Biosynthesis of lipids in plants. II. Incorporation of glycerophosphate-32-P into phosphatides by cell-free preparations from spinach leaves. Can. J. Biochem. 44, 459–467 [DOI] [PubMed] [Google Scholar]
- 26.Rouser G., Fkeischer S., and Yamamoto A. (1970) Two-dimensional thin layer chromatographic separation of polar lipids and determination of phospholipids by phosphorus analysis of spots. Lipids 5, 494–496 [DOI] [PubMed] [Google Scholar]
- 27.Mahuren J. D., Coburn S. P., Slominski A., and Wortsman J. (2001) Microassay of phosphate provides a general method for measuring the activity of phosphatases using physiological, nonchromogenic substrates such as lysophosphatidic acid. Anal. Biochem. 298, 241–245 [DOI] [PubMed] [Google Scholar]
- 28.Pasquaré S. J., Salvador G. A., and Giusto N. M. (2004) Phospholipase D and phosphatidate phosphohydrolase activities in rat cerebellum during aging. Lipids 39, 553–560 [DOI] [PubMed] [Google Scholar]
- 29.Pasquaré S. J., Ilincheta de Boschero M. G., and Giusto N. M. (2001) Aging promotes a different phosphatidic acid utilization in cytosolic and microsomal fractions from brain and liver. Exp. Gerontol. 36, 1387–1401 [DOI] [PubMed] [Google Scholar]
- 30.Jamal Z., Martin A., Gomez-Muñoz A., and Brindley D. N. (1991) Plasma membrane fractions from rat liver contain a phosphatidate phosphohydrolase distinct from that in the endoplasmic reticulum and cytosol. J. Biol. Chem. 266, 2988–2996 [PubMed] [Google Scholar]
- 31.Bonifacino J. S., Dell'Angelica E. C., and Springer T. A. (2001) Immunoprecipitation. Curr. Protoc. Protein Sci. Chapter 9, Unit 9.8 [DOI] [PubMed] [Google Scholar]
- 32.Elangovan M., Wallrabe H., Chen Y., Day R. N., Barroso M., and Periasamy A. (2003) Characterization of one- and two-photon excitation fluorescence resonance energy transfer microscopy. Methods 29, 58–73 [DOI] [PubMed] [Google Scholar]
- 33.Kovary K., and Bravo R. (1992) Existence of different Fos/Jun complexes during the G0-to-G1 transition and during exponential growth in mouse fibroblasts: differential role of Fos proteins. Mol. Cell. Biol. 12, 5015–5023 [DOI] [PMC free article] [PubMed] [Google Scholar]
- 34.Péterfy M., Phan J., and Reue K. (2005) Alternatively spliced lipin isoforms exhibit distinct expression pattern, subcellular localization, and role in adipogenesis. J. Biol. Chem. 280, 32883–32889 [DOI] [PubMed] [Google Scholar]
- 35.Shaulian E., and Karin M. (2001) AP-1 in cell proliferation and survival. Oncogene 20, 2390–2400 [DOI] [PubMed] [Google Scholar]
- 36.Hess J., Angel P., and Schorpp-Kistner M. (2004) AP-1 subunits: quarrel and harmony among siblings. J. Cell Sci. 117, 5965–5973 [DOI] [PubMed] [Google Scholar]
- 37.Bou Khalil M., Sundaram M., Zhang H. Y., Links P. H., Raven J. F., Manmontri B., Sariahmetoglu M., Tran K., Reue K., Brindley D. N., and Yao Z. (2009) The level and compartmentalization of phosphatidate phosphatase-1 (lipin-1) control the assembly and secretion of hepatic VLDL. J. Lipid Res. 50, 47–58 [DOI] [PubMed] [Google Scholar]
- 38.Motrich R. D., Castro G. M., and Caputto B. L. (2013) Old players with a newly defined function: Fra-1 and c-Fos support growth of human malignant breast tumors by activating membrane biogenesis at the cytoplasm. PLoS ONE 8, e53211. [DOI] [PMC free article] [PubMed] [Google Scholar]
- 39.Ferrero G. O., Velazquez F. N., and Caputto B. L. (2012) The kinase c-Src and the phosphatase TC45 coordinately regulate c-Fos tyrosine phosphorylation and c-Fos phospholipid synthesis activation capacity. Oncogene 31, 3381–3391 [DOI] [PubMed] [Google Scholar]
- 40.Portal M. M., Ferrero G. O., and Caputto B. L. (2007) N-terminal c-Fos tyrosine phosphorylation regulates c-Fos/ER association and c-Fos-dependent phospholipid synthesis activation. Oncogene 26, 3551–3558 [DOI] [PubMed] [Google Scholar]
- 41.Bussolino D. F., Guido M. E., Gil G. A., Borioli G. A., Renner M. L., Grabois V. R., Conde C. B., and Caputto B. L. (2001) c-Fos associates with the endoplasmic reticulum and activates phospholipid metabolism. FASEB J. 15, 556–558 [DOI] [PubMed] [Google Scholar]
- 42.Piston D. W., and Kremers G. J. (2007) Fluorescent protein FRET: the good, the bad and the ugly. Trends Biochem. Sci. 32, 407–414 [DOI] [PubMed] [Google Scholar]
- 43.Malnou C. E., Salem T., Brockly F., Wodrich H., Piechaczyk M., and Jariel-Encontre I. (2007) Heterodimerization with Jun family members regulates c-Fos nucleocytoplasmic traffic. J. Biol. Chem. 282, 31046–31059 [DOI] [PubMed] [Google Scholar]
- 44.Carman G. M., Deems R. A., and Dennis E. A. (1995) Lipid signaling enzymes and surface dilution kinetics. J. Biol. Chem. 270, 18711–18714 [DOI] [PubMed] [Google Scholar]
- 45.Pascual F., and Carman G. M. (2013) Phosphatidate phosphatase, a key regulator of lipid homeostasis. Biochim. Biophys. Acta 1831, 514–522 [DOI] [PMC free article] [PubMed] [Google Scholar]
- 46.Grimsey N., Han G. S., O'Hara L., Rochford J. J., Carman G. M., and Siniossoglou S. (2008) Temporal and spatial regulation of the phosphatidate phosphatases lipin 1 and 2. J. Biol. Chem. 283, 29166–29174 [DOI] [PMC free article] [PubMed] [Google Scholar]
- 47.Harris T. E., Huffman T. A., Chi A., Shabanowitz J., Hunt D. F., Kumar A., and Lawrence J. C. Jr. (2007) Insulin controls subcellular localization and multisite phosphorylation of the phosphatidic acid phosphatase, lipin 1. J. Biol. Chem. 282, 277–286 [DOI] [PubMed] [Google Scholar]
- 48.Huffman T. A., Mothe-Satney I., and Lawrence J. C. Jr. (2002) Insulin-stimulated phosphorylation of lipin mediated by the mammalian target of rapamycin. Proc. Natl. Acad. Sci. U.S.A. 99, 1047–1052 [DOI] [PMC free article] [PubMed] [Google Scholar]
- 49.Liu G. H., and Gerace L. (2009) Sumoylation regulates nuclear localization of lipin-1alpha in neuronal cells. PLoS ONE 4, e7031. [DOI] [PMC free article] [PubMed] [Google Scholar]
- 50.Coleman R. A., and Lee D. P. (2004) Enzymes of triacylglycerol synthesis and their regulation. Prog. Lipid Res. 43, 134–176 [DOI] [PubMed] [Google Scholar]
- 51.Liu Z., and Huang Y. (2014) Advantages of proteins being disordered. Protein Sci. 23, 539–550 [DOI] [PMC free article] [PubMed] [Google Scholar]
- 52.Xue B., Dunbrack R. L., Williams R. W., Dunker A. K., and Uversky V. N. (2010) PONDR-FIT: a meta-predictor of intrinsically disordered amino acids. Biochim. Biophys. Acta 1804, 996–1010 [DOI] [PMC free article] [PubMed] [Google Scholar]
- 53.Kyte J., and Doolittle R. F. (1982) A simple method for displaying the hydropathic character of a protein. J. Mol. Biol. 157, 105–132 [DOI] [PubMed] [Google Scholar]
- 54.Uversky V. N. (2013) A decade and a half of protein intrinsic disorder: biology still waits for physics. Protein Sci. 22, 693–724 [DOI] [PMC free article] [PubMed] [Google Scholar]
- 55.Hsu W. L., Oldfield C. J., Xue B., Meng J., Huang F., Romero P., Uversky V. N., and Dunker A. K. (2013) Exploring the binding diversity of intrinsically disordered proteins involved in one-to-many binding. Protein Sci. 22, 258–273 [DOI] [PMC free article] [PubMed] [Google Scholar]


