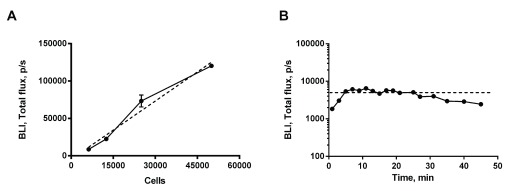
Figure 1.
( A) In vitro quantification of bioluminescence signal. Linear regression demonstrated that the signal increased linearly with the number of cells (dotted line), p<0.0001. ( B) In vivo quantification. The bioluminescence signal increased during the initial 5min following i.p. injection. After 5min the signal reached a stable plateau lasting for approximately 20min. Results from two experiments.

