

Abstract
Background
We conducted a genome-wide association study (GWAS) for maximum number of alcoholic drinks consumed in a 24-hour period (“MaxDrinks”), in two independent samples comprised of over 9,500 subjects, following up on our GWAS for alcohol dependence (AD) in European Americans (EAs) and African Americans (AAs).
Methods
The samples included our GWAS samples (Yale-UPenn) recruited for studies of the genetics of drug or alcohol dependence, and a public available sample: the Study of Addiction: Genetics and Environment (SAGE). Genome-wide association analysis was performed for ∼890,000 single nucleotide polymorphisms (SNPs) using linear association random effects models. European Americans and African Americans were separately analyzed.
Results
The results confirmed significant associations of the well-known functional loci at ADH1B with MaxDrinks in EAs (rs1229984 Arg48His p= 5.96 x10⁻¹⁵) and AAs (rs2066207 Arg370Cys, p=2.50 x 10⁻¹⁰). The region of significant association on chromosome 4 was extended to LOC100507053 in AAs but not EAs. We also identified potentially novel significant common SNPs for MaxDrinks in EAs in the Yale-UPenn sample: rs1799876 at SERPINC1 on chromosome 1 (4.00 x 10⁻⁸) and rs2309169 close to ANKRD36 on chromosome 2 (p=5.58 x 10⁻⁹). After adjusting for the peak SNP rs1229984 on ADH1B, rs1799876 was nearly significant (p= 1.99 x 10⁻⁷) and rs2309169 remained highly significant (2.12 x 10⁻⁹).
Conclusions
The results provide further support that ADH1B modulates alcohol consumption. Future replications of potential novel loci are warranted. This is the largest MaxDrinks GWAS to date, the first in AAs.
Keywords: Alcohol maximum drinks, genome-wide association, African American, European American
Introduction
Alcohol consumption is a moderately heritable phenotype, with heritability estimated at approximately 0.5 (Agrawal et al., 2009). Quantitative measures of the heaviness of alcohol consumption have greater power for gene discovery than dichotomous measures of alcohol phenotypes, such as alcohol dependence (AD), as they better represent the underlying continuum of alcohol-related problems. The maximum number of alcoholic drinks consumed in a 24-hour period (MaxDrinks) is a quantitative measure that can be considered an intermediate phenotype or a proxy for AD for gene detection; Diagnostic and Statistical Manual of Mental Disorders (DSM) criterion count is another such measure (Agrawal et al., 2012, Wang et al., 2013, Gelernter et al., 2014, Kendler et al., 2010, Quillen et al., 2014). Although MaxDrinks is highly correlated with alcohol dependence, MaxDrinks is directly associated with alcohol metabolism and physiopathology, which AD is more heterogeneous diagnosis including social functions and legal problems. Genes identified for MaxDrinks may more likely be biologically relevant to alcohol consumption.
Previous linkage studies have located genetic variants associated with MaxDrinks on chromosomes 2, 4, and 7 in European Americans (EAs)(Saccone et al., 2000, Saccone et al., 2005), and chromosomes 12 and 18 in a study of Irish affected sibpairs (Kuo et al., 2006). Consistent with gene-based association studies for AD, the strongest and most consistent signals for MaxDrinks in European-ancestry populations are located on ADH1B, a gene that encodes an alcohol dehydrogenase, a key enzyme in alcohol metabolism (Macgregor et al., 2009, Bierut et al., 2010). A functional single nucleotide polymorphism (SNP) at ADH1B, rs1229984 (A>G Arg48His), has been associated with MaxDrinks in Asian, Israeli, Australian, and European American populations (Bierut et al., 2012, Macgregor et al., 2009, Meyers et al., 2013), with the His48 allele conferring a protective effect against heavy consumption (i.e., lower MaxDrinks). This variant is uncommon in individuals of African descent and has not been found to be associated with MaxDrinks in AA samples; however, another functional variant rs2066207 with similar functional effects associated with AD diagnostic traits in AA samples (Edenberg et al., 2006). Gene-based studies have reported an association between rs671 at ALDH2 and reduced MaxDrinks in Asian populations, but not in EAs or AAs, where this variant is uninformative. Our recent GWAS in a relatively isolated Chinese population confirmed this locus on ALDH2 for MaxDrinks that explained 22.9% of the phenotypic variation in our sample (Quillen et al., 2014).
Although several GWAS, including our recent study in EAs and AAs, identified risk loci for AD (Park et al., 2013, Gelernter et al., 2014, Treutlein et al., 2009, Schumann et al., 2011), GWAS for the “MaxDrinks” trait have not yielded robust associations in EAs or AAs (Kapoor et al., 2013, Pan et al., 2013, Heath et al., 2011). A nominally significant association (rs9512637 on chromosome 13, p=1.2 x 10⁻⁷) for a heaviness of alcohol drinking factor score was found in a large Australian twin population (Heath et al., 2011), in which the SNP density was relatively low. Several recent meta-analyses from large consortium samples (the Collaborative Study on the Genetics of Alcoholism (COGA) and the Study of Addiction: Genes and Environment (SAGE) revealed no genome-wide significant markers for this phenotype (Kapoor et al., 2013, Pan et al., 2013). However, multiple loci approached significance, including SNPs at LMO1, PLCL1, KCNB2, and DDC (Kapoor et al., 2013, Pan et al., 2013). One study identified a locus on C12orf51 associated with alcohol consumption in Korean men at an extremely high level of significance (p=5.8 x 10-46) (Baik et al., 2011). Interestingly, the majority of these GWAS have not replicated the association of the ADH1B gene with MaxDrinks that was previously reported from several studies (Bierut et al., 2012, Macgregor et al., 2009) except for one (2.04 x 10⁻⁸) in the combination of COGA and SAGE samples(Kapoor et al., 2013). . Thus, in order to identify genetic influences on MaxDrinks and to establish the role of ADH1B on Maxdrinks, additional GWAS in large sample populations with high-density genotyping arrays in EAs and AAs are warranted.
Here we report a GWAS with MaxDrinks in our EA and AA samples and the publically available (via dbGAP application) SAGE dataset. We combined sample sets through meta-analysis, yielding a total sample of more than 9,500 subjects. This is the largest GWAS for MaxDrinks to date and is particularly noteworthy for its large AA representation.
Materials and Methods
Subject Characteristics
The study samples included our GWAS samples (Yale-UPenn) (N=5,543) and the public samples (SAGE: phs000092.v1.p1, N=4,012). Sample characteristics are shown in Table 1. The Yale-UPenn sample was recruited for studies of the genetics of drug (opioid or cocaine) or alcohol dependence. The SAGE sample consists of the Collaborative Study on the Genetics of Alcoholism (COGA) (Edenberg and Foroud, 2006, Edenberg, 2002), the Family Study of Cocaine Dependence (FSCD) (Grucza et al., 2008), and the Collaborative Genetic Study of Nicotine Dependence (COGEND) (Bierut, 2007) samples. We obtained the SAGE data via dbGAP.
Table 1. Sample characteristics.
| EA | AA | Total | |||||
|---|---|---|---|---|---|---|---|
| Yale-UPenn | M | F | Total | M | F | Total | |
| 1374 | 954 | 2328 | 1683 | 1532 | 3215 | 5543 | |
| SAGE | 1213 | 1523 | 2736 | 625 | 651 | 1276 | 4012 |
| Total | 2587 | 2477 | 5064 | 2308 | 2183 | 4491 | 9555 |
Note:
EA: European American
AA: African American
SAGE: the Study of Addiction: Genetics and Environment
The Yale-UPenn sample
Detailed descriptions of recruitment and assessment procedures from this multi-site study can be found in previous publications (Gelernter et al., 2014, Gelernter et al., 2013). The sample consisted of small nuclear families originally collected for linkage studies and unrelated individuals. Briefly, subjects were interviewed using the Semi-Structured Assessment for Drug Dependence and Alcoholism (SSADDA) to assess symptoms of drug use and other major psychiatric disorders (Pierucci-Lagha et al., 2005, Gelernter et al., 2005). MaxDrinks was assessed with the question “In your lifetime, what is the largest number of drinks you have ever had in a 24-hour period, including all types of alcohol?” The number of drinks was coded as standard drinks. We used log-transformed MaxDrinks (LogM) values to represent MaxDrinks in the analysis models. A total of 2,328 EA and 3,215 AA subjects had MaxDrinks data. The mean of LogM was 2.95+/-0.84 in the EA sample, and 2.57+/-1.01 in the AA samples. The LogM in AAs was significantly lower than in EAs (p < 0.0001). The distributions of LogM for EA and AA samples are shown in supplemental Figure 1.
The SAGE sample
The Study of Addiction: Genetics and Environment (SAGE) is funded as part of the Gene Environment Association Studies (GENEVA) initiative supported by the National Human Genome Research Institute (http://www.ncbi.nim.nih.gov/projects/gap/cgi-bin/study.cgi?study_id=phs000092.v1.p1). A total of 2,736 EA and 1,276 AA unrelated individuals were included for this study. Some cocaine users were recruited for SAGE and the sample informative for alcohol MaxDrinks was also partially comorbid with cocaine use. SAGE also included the individuals with Fagerstrom Test for Nicotine Dependence greater than 3. Alcohol and nicotine dependence are common in population. We did not exclude subjects with nicotine dependence. The number of MaxDrinks was assessed by inquiring as to the number of standard drinks consumed within a 24-hour period. Consistent with the MaxDrinks variable from Yale-UPenn, the MaxDrinks reported in the SAGE data and transformed to LogM for genetic analysis. A detailed description of this sample was reported previously (Gelernter et al., 2014, Wang et al., 2013).
Genotyping and Quality control
The Yale-UPenn samples were genotyped using the Illumina HumanOmnil-Quad v1.0 microarray containing 988,306 autosomal SNPs, at the Center for Inherited Disease Research (CIDR) and the Yale Center for Genome Analysis. Genotypes were called using Illumina GenomeStudio software V2011.1 and genotyping module V 1.8.4. (Illumina, San Diego, CA, USA). The SAGE samples were genotyped on the Illumina Human 1M array containing 1,069,796 total SNPs. We used the following criteria for genotyping quality control filtering: 1) call rate >98%; 2) MAF > 1%; and p value for HWE> 5 x 10⁻⁶. After data cleaning, 44,644 SNPs on the microarray and 135 individuals with call rates < 98% were excluded; 62,076 additional SNPs were removed due to minor allele frequencies (MAF) <1%. After data cleaning and quality control, 5,543 individuals and 889,659 SNPs remained for imputation. After applying the same QC procedures to the SAGE sample, 39 subjects with call rates < 98% were excluded. Thus, in the SAGE sample, 4,012 individuals and 726,191 SNPs remained for analysis.
In addition, we examined the genetic relationships in the family-based samples for the Yale-UPenn samples by estimating pairwise identity by descent (IBD) proportion using PLINK v1.90a. Individuals who shared more than 25% of their alleles IBD were assigned to the same family.
Genotyping imputation
We used the 1000 Genomes dataset (http://www.1000genomes.org/) as a reference to impute genotyping for our Yale-UPenn and SAGE samples. The program IMPUTE2 was applied for genotyping imputation. EA and AA populations were imputed separately within each dataset.
Statistical analysis
Population stratification
We conducted principal components analysis to address population structure in the Yale-UPenn samples and SAGE samples using the program Eigensoft (Price et al., 2006, Patterson et al., 2006). SNPs were pruned for linkage disequilibrium (LD) estimated by r2 >0.8. The first PC score distinguished AAs and EAs. Thus, we analyzed AAs and EAs separately to minimize population admixture. Within each population, the top three PCs were then used in all analyses to correct for residual population stratification.
Association analysis
A linear association model was applied for association analyses between SNPs genome-wide for the log-transformed MaxDrinks. In this analysis, MaxDrinks was the dependent variable and each SNP was a predictor. Each model was adjusted for age, sex and the first three ancestry PCs. Consider body weight may influence alcohol distribution and consumption, we conducted a separate analysis with body mass index (BMI) as an additional covariate. The p-value for genome-wide significance was set at 5.0 x 10⁻⁸. To further limit the confounding factors, we tested models for moderately associated SNPs (p < 1 × 10⁻⁴) for dependence on cocaine, opioids, and alcohol, three major comorbid substance use in our samples
Meta-analysis of the Yale-UPenn and SAGE samples
We used the program METAL to meta-analyze the combined results of the Yale-UPenn and SAGE samples (Willer et al., 2010). Inverse variance was applied to the analysis.
Conditional association analysis
To identify additional association signals after accounting for the known loci, we ran conditional analyses, in which we included the significant allele counts at the conditioning loci as covariates to calculate conditional p values for EAs and AAs. We adjusted for the effect of rs1229984 in the EA samples and for rs2066207 in the AA samples, the two peak significant SNPs in those populations.
Results
Genome-wide association
We identified multiple significant loci on chromosome 4 for MaxDrinks in both EA and AA populations. Within a 236 kb region on chromosome 4, one SNP was significantly associated with MaxDrinks in EAs, and eight SNPs were significantly associated in AAs (Table 2). Three of the nine SNPs were uniquely associated with MaxDrinks; the other six were also strongly associated with AD in our previous study (Gelernter et al., 2014). In the present study, the significant signals were mostly driven by the Yale-UPenn sample.
Table 2. Summary of significant results associated with Maxdrinks in European Americans and African Americans.
| European Americans | |||||||||||||
|---|---|---|---|---|---|---|---|---|---|---|---|---|---|
| Chr | BP | a1 | a2 | SNP | SNP Type | Gene | Yale-UPenn p | Yale-Upenn Beta | SAGE p | SAGE Beta | Meta p | Meta beta | MAF |
| 1 | 173878471 | G | A | rs1799876 | INT | SERPINC1 | 4.00E-08 | -0.161 | 2.62E-02 | -0.0522 | 1.32E-07 | -0.08 | 0.38 |
| 2 | 98239537 | A | C | rs2309169 | a | a | 5.58E-09 | -0.276 | a | a | a | a | 0.1 |
| 4 | 100025015 | T | C | rs28470942 | INT | LOC100507053 | a | a | a | a | a | a | a |
| 4 | 100163386 | CT | C | rs33948359 | INT | LOC100507053 | a | a | a | a | a | a | a |
| 4 | 100177417 | C | A | rs28600890 | INT | LOC100507053 | a | a | a | a | a | a | a |
| 4 | 100190805 | T | C | rs28864441 | INT | LOC100507053 | a | a | a | a | a | a | a |
| 4 | 100214164 | A | G | rs904092 | INT | LOC100507053 | 9.29E-01 | -0.00306 | 2.26E-02 | 0.0674 | 2.67E-01 | 0.02 | 0.17 |
| 4 | 100229017 | A | G | rs2066702 | NSM,REF | ADH1B | . | a | a | a | a | a | a |
| 4 | 100235053 | A | G | rs1789882 | REF,SYN | ADH1B | 9.97E-01 | -0.00014 | 2.68E-02 | 0.0652 | 2.42E-01 | 0.02 | 0.17 |
| 4 | 100236762 | C | T | rs1693457 | INT | ADH1B | 9.37E-01 | -0.00268 | 2.19E-02 | 0.067 | 2.55E-01 | 0.02 | 0.18 |
| 4 | 100239319 | A | G | rs1229984 | NSM,REF | ADH1B | 1.09E-09 | -0.335 | 1.82E-04 | -0.222 | 5.96E-15 | -0.26 | 0.06 |
| 4 | 100261524 | C | T | rs34009511 | INT | ADH1C | a | a | a | a | a | a | a |
| 4 | 177782899 | A | AAAAC | rs200475889 | a | a | a | a | a | a | a | a | a |
| African Americans | |||||||||||||
|---|---|---|---|---|---|---|---|---|---|---|---|---|---|
| Chr | BP | a1 | a2 | SNP | SNP Type | Gene | Yale-Upenn p | Yale-Upenn Beta | SAGE p | SAGE Beta | Meta p | Meta beta | MAF |
| 1 | 173878471 | G | A | rs1799876 | INT | SERPINC1 | 6.02E-01 | -0.0162 | 2.31E-01 | 0.06 | 6.27E-01 | -0.01 | |
| 2 | 98239537 | A | C | rs2309169 | a | a | a | a | a | a | a | a | a |
| 4 | 100025015 | T | C | rs28470942 | INT | LOC100507053 | 7.67E-06 | -0.142 | 1.67E-03 | -0.19 | 4.23E-08 | -0.15 | 0.18 |
| 4 | 100163386 | CT | C | rs33948359 | INT | LOC100507053 | 2.55E-06 | -0.145 | 1.25E-03 | -0.19 | 1.04E-08 | -0.15 | 0.18 |
| 4 | 100177417 | C | A | rs28600890 | INT | LOC100507053 | 1.71E-06 | -0.147 | 9.03E-04 | -0.19 | 5.22E-09 | -0.16 | 0.19 |
| 4 | 100190805 | T | C | rs28864441 | INT | LOC100507053 | 1.24E-06 | -0.149 | 9.03E-04 | -0.19 | 3.68E-09 | -0.16 | 0.18 |
| 4 | 100214164 | A | G | rs904092 | INT | LOC100507053 | 1.85E-05 | -0.122 | 8.75E-03 | -0.14 | 1.45E-08 | -0.13 | 0.24 |
| 4 | 100229017 | A | G | rs2066702 | NSM,REF | ADH1B | 4.93E-07 | -0.154 | 9.82E-04 | -0.19 | 2.50E-10 | -0.16 | 0.19 |
| 4 | 100235053 | A | G | rs1789882 | REF,SYN | ADH1B | 5.06E-06 | -0.13 | 5.33E-03 | -0.15 | 2.10E-09 | -0.14 | 0.23 |
| 4 | 100236762 | C | T | rs1693457 | INT | ADH1B | 7.05E-06 | -0.128 | 8.41E-03 | -0.15 | 4.24E-09 | -0.14 | 0.23 |
| 4 | 100239319 | A | G | rs1229984 | NSM,REF | ADH1B | a | a | a | a | a | a | a |
| 4 | 100261524 | C | T | rs34009511 | INT | ADH1C | 1.38E-06 | -0.21 | 2.43E-02 | -0.18 | 8.11E-08 | -0.2 | 0.09 |
| 4 | 177782899 | A | AAAAC | rs200475889 | a | a | 5.32E-08 | -0.235 | a | a | a | a | a |
| All | ||||||||
|---|---|---|---|---|---|---|---|---|
| Chr | BP | a1 | a2 | SNP | SNP Type | Gene | Meta p | Meta beta |
| 1 | 173878471 | G | A | rs1799876 | INT | SERPINC1 | 3.17E-06 | -0.06 |
| 2 | 98239537 | A | C | rs2309169 | a | a | a | a |
| 4 | 100025015 | T | C | rs28470942 | INT | LOC100507053 | 4.23E-08 | -0.15 |
| 4 | 100163386 | CT | C | rs33948359 | INT | LOC100507053 | 1.04E-08 | -0.15 |
| 4 | 100177417 | C | A | rs28600890 | INT | LOC100507053 | 5.22E-09 | -0.16 |
| 4 | 100190805 | T | C | rs28864441 | INT | LOC100507053 | 3.68E-09 | -0.159 |
| 4 | 100214164 | A | G | rs904092 | INT | LOC100507053 | 5.02E-03 | -0.042 |
| 4 | 100229017 | A | G | rs2066702 | NSM,REF | ADH1B | 2.50E-10 | -0.16 |
| 4 | 100235053 | A | G | rs1789882 | REF,SYN | ADH1B | 3.25E-03 | -0.04 |
| 4 | 100236762 | C | T | rs1693457 | INT | ADH1B | 4.07E-03 | -0.04 |
| 4 | 100239319 | A | G | rs1229984 | NSM,REF | ADH1B | 5.96E-15 | -0.26 |
| 4 | 100261524 | C | T | rs34009511 | INT | ADH1C | 8.11E-08 | -0.2 |
| 4 | 177782899 | A | AAAAC | rs200475889 | a | a | a | a |
Abbreviations: Chr: chromosome; BP: base pair; SNP: single nucleotide polymorphism; NA: other; NSM: non-synonymous; SYN: synonymous; INT: intronic; Beta: beta coefficient for Maxdrinks; MAF: Minor allele frequency
Not tested because of low minor allele frequency or poor imputation qualityNot tested because
Note: highlighted as red SNPs were identifed assoications for alcohol dependence in our previous study
The peak GWAS hits were from the ADH1B locus. As expected, the functional SNP rs1229984 (A>G Arg48His) showed the strongest association with MaxDrinks in the EAs from combined Yale-Upenn and SAGE samples (minor allele frequency, MAF=0.06, p=5.96 x 10⁻¹⁵, β=-0.26) (Table 2, Figures 1A, 1B). This SNP remained highly significant after adjusting for BMI (p=4.27 x 10⁻¹²). Individuals with His48 allele reported less number of maximum drinks within 24 hours than homozygote Arg48 individuals (Figure 4A). This SNP is minimally informative in AA samples. However, another functional SNP in ADH1B, rs2066702, was strongly associated with MaxDrinks in the AAs from the combination of Yale-UPenn and SAGE samples (MAF=0.19, p=2.5 x 10⁻¹⁰, β=-0.16, p=1.89 x 10⁻⁸ adjusting for BMI) (Figures 2A, 2B). Individuals carrying Cys allele reported less number of maximum drinks (Figure 4B). Two other SNPs in ADH1B, one synonymous SNP, rs1789882 (Ile12520Ile) (MAF=0.23, p=2.1 x 10⁻⁹, β=-0.14), and one intronic SNP, rs1693457 (MAF=0.23; p=4.2 x 10⁻⁹, β=-0.14), were significant in AAs but were monomorphic in EAs. All four SNPs in ADH1B were previously shown to be significantly associated with AD. These findings confirm the contribution of ADH1B to the development of alcohol-related pathophysiological phenotypes. Our prior GWAS used AD criteria and diagnosis as traits, however, MaxDrinks is not among the AD diagnostic criteria. Regional Manhattan plots on chromosome 4 close to AHD cluster are showed in Fig 3A for EAs and in Fig 3B for AAs.
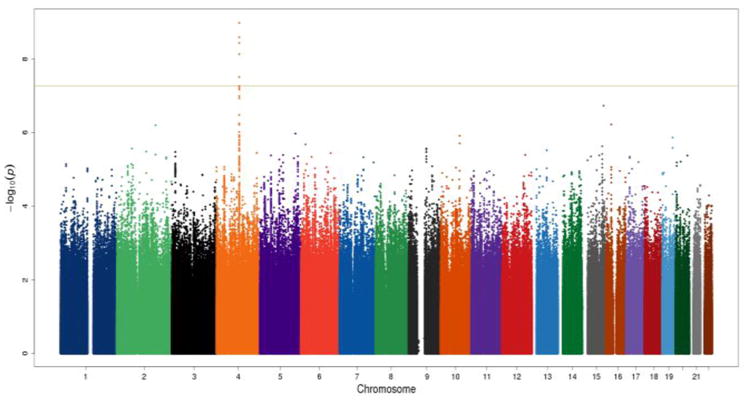
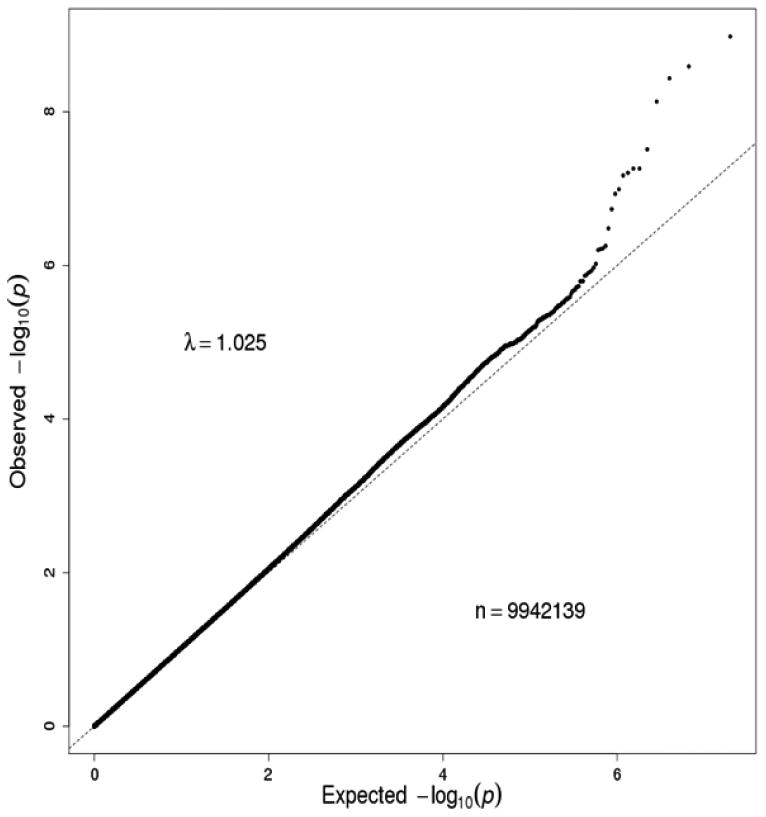
Figure 1.
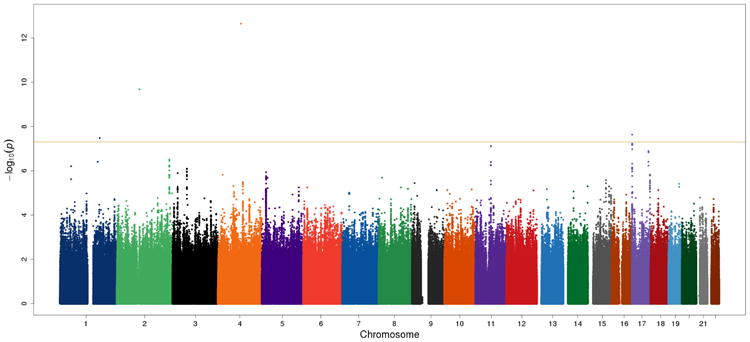
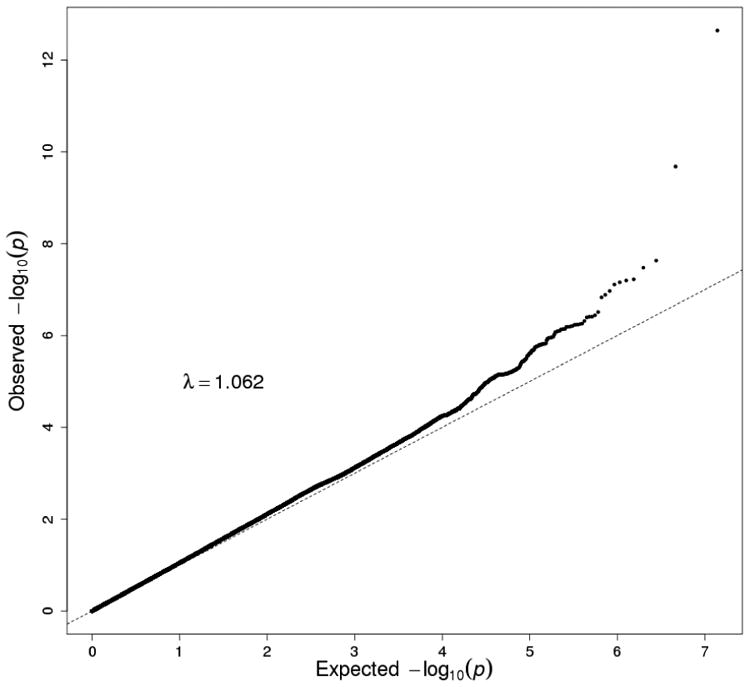
Manhattan plot and QQ plot in European Americans (EA) in the Yale-UPenn sample. The peak SNP was rs1229984 (ADH1B) on chromosome 4 (p=5.96 x 10⁻¹⁵). Two novel loci were rs1799876 on chromosome 1 (p=4.00 x 10⁻⁸) and rs2309169 on chromosome 2 (5.58 x 10⁻⁹). After adjusting for rs122984 on ADH1B, rs2309169 remained significant (p=2.1 x 10⁻⁹), but rs1799876 was nearly significant (p=1.99 x 10⁻⁷).
Figure 4.
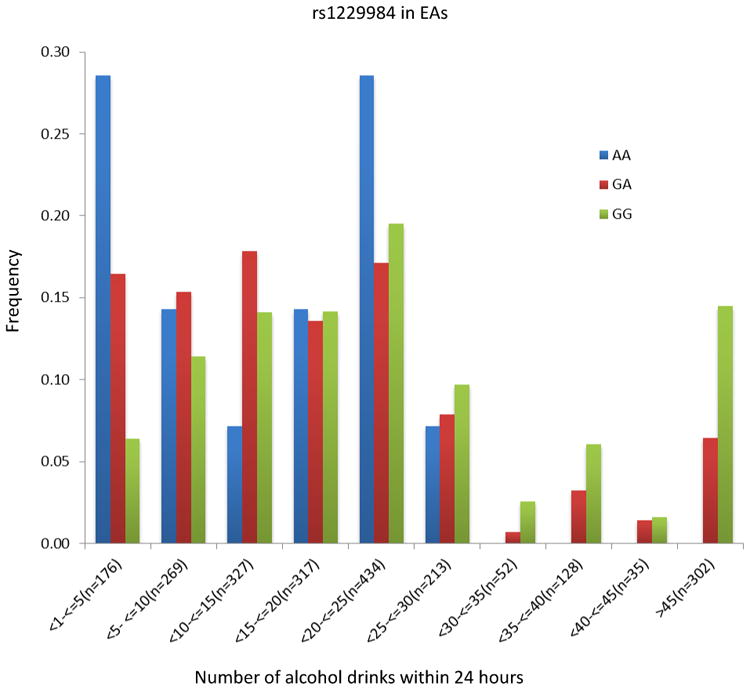
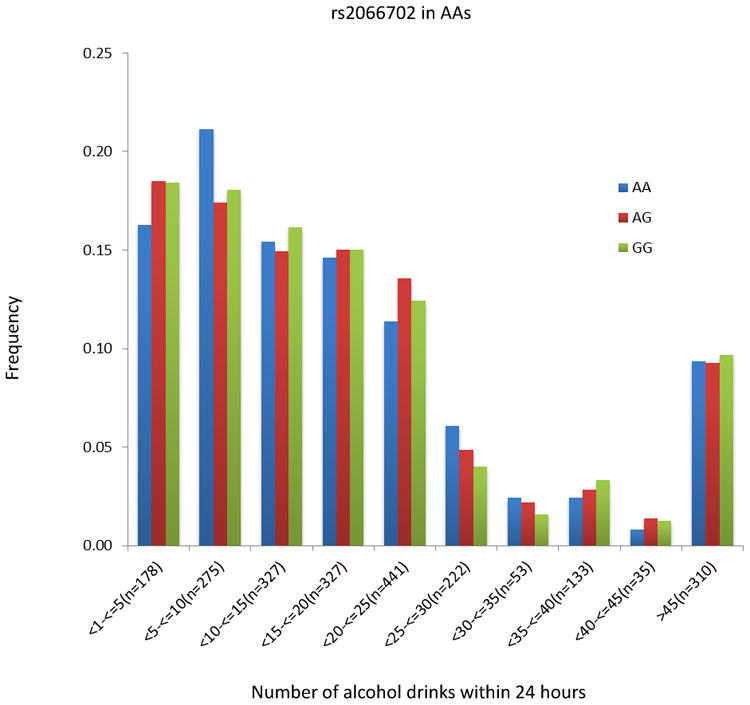
The distribution of number of maximal drinks within 24 hours by two-peak significant SNPs. Left: rs1229984 in European Americans; Right rs2066702 in African Americans. The number of drinks was binned by five drinks. The number of drinks greater than 45 was combined into one group.
Figure 2.
Manhattan plot and QQ plot in African Americans (AAs) in the combination of the Yale-UPenn samples and the SAGE samples. Eight SNPs on chromosome 4 reached genome-wide significance. The peak SNP was rs2066702 (ADH1B) on chromosome 4 (p=2.50 x 10⁻¹⁰).
Figure 3.
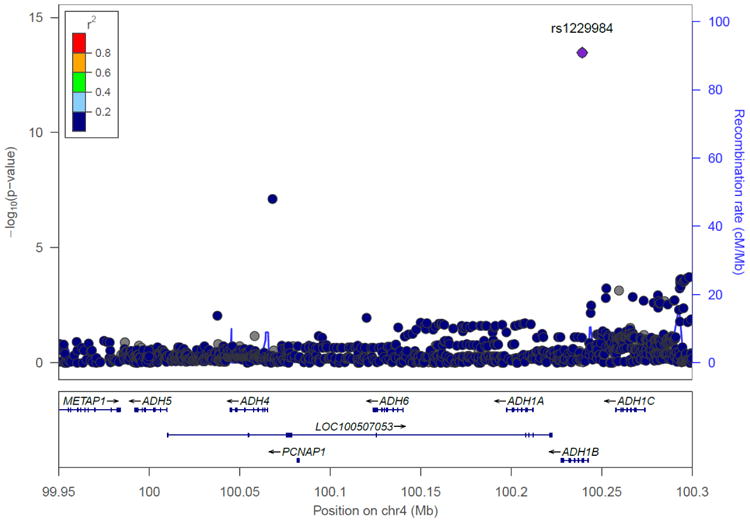
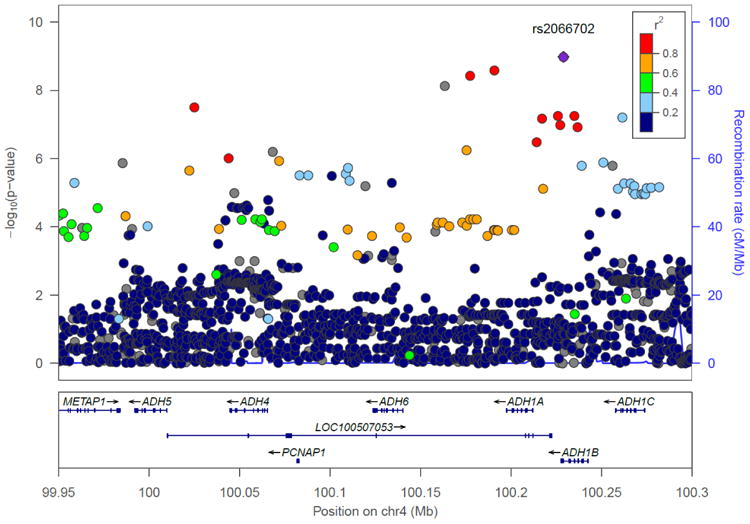
Chromosome 4 regional Manhattan plots in the combination of the Yale-UPenn samples and the SAGE samples. Left: European Americans: The peak significant SNP was rs1229984 on ADH1B (p=5.96 x 10⁻¹⁵) Right: African Americans: The peak significant SNP was rs2066702 on ADH1B (p=2.50 x 10⁻¹⁰)
Consistent with our previous findings for AD on chromosome 4, the region that was associated with MaxDrinks also extended to the locus LOC100507053. Five SNPs at LOC100507053, which is in the same genomic region as the ADH cluster, were significant only in the AA sample (Figure 3B). This uncharacterized RNA gene was previously associated with AD symptom count (Gelernter et al., 2014). Three of these five significant SNPs were associated in the present study but were not observed in our previous AD GWAS. We also previously found that 11 SNPs in ADH1C were associated with AD symptom count (Gelernter et al., 2014). None of those SNPs were associated with MaxDrinks, though there was one marginally significant SNP in the AA population in the combined Yale-UPenn and SAGE samples (rs34009511, p=8.1x10⁻⁸).
In addition to the genomic region on chromosome 4q, we identified two significant loci for EAs. In the EA samples, rs1799865 on chromosome 1 and rs2309169 on chromosome 2 showed significant association (rs1799865: MAF=0.38, p=4.00 x 10⁻⁸, β=-0.16; rs2309169, p=5.58x10⁻⁹, β=-0.28) (Supplemental figure 2A and 2B). Rs1799865 maps to SERPINC1, which encodes a plasma protease inhibitor. Rs2309169 is located 10kb downstream to ANKRD36. In AAs, a SNP rs1040883 SMPD1 on chromosome 11 showed significant association with MaxDrinks, which was mostly driven by the SAGE sample (p=1.10 x 10⁻⁸). However, this locus was not significantly associated in either our AA samples nor in the meta-analysis in the combination samples, and the effects of the SNP were opposite direction in the SAGE sample and the combined sample, suggesting a potential spurious significant SNP.
Conditional analysis
To evaluate whether identified SNPs contribute independently to MaxDrinks, we repeated the analyses, conditioning on the most significant ADH1B SNPs in each population: rs1229984 in EAs and rs2066702 in AAs. In EAs, after adjusting for rs1229984, rs2309169 on chromosome 2 remained highly significant (p=2.12 x 10⁻⁹) and rs1799876 on chromosome 1 was nearly significant (p=1.99 x 10⁻⁷). In AAs, after adjusting for rs2066702, among the eight SNPs identified as significant in the combined Yale-UPenn and the SAGE samples, only one SNP remained significant. Rs200475889 on chromosome 4 showed significant association in the Yale-UPenn AAs after adjusting for rs2066702 (p=4.80 x 10⁻⁸), suggesting that both of these SNPs contributed to genetic risk for MaxDrinks in this population. Thus, independent loci other than ADH1B contributed to Maxdrinks in both AAs and EAs.
Discussion
We identified multiple significant loci for peak daily alcohol consumption (MaxDrinks) in a large sample of EAs and AAs, thus expanding the existing literature in several ways. First, the association of the functional ADH1B SNP rs1229984 with MaxDrinks in EAs is consistent with previous observations. This finding provides additional support for a role of that locus in determining alcohol consumption, as well as increasing confidence in our findings implicating other loci relevant to drinking behavior. Second, this is the first report of a significant association of rs2066702 at ADH1B with MaxDrinks in an AA population – this finding is not unexpected, as it is similar to the finding in EAs. Third, additional protective loci, i.e., alleles mapped to genes not previously associated with either MaxDrinks or AD, were identified in both EA and AA populations. It is also noteworthy that the significant genes or alleles associated with MaxDrinks were population-specific (in all cases except ADH1B), suggesting that different genes and perhaps different biological pathways may be involved in this trait in different populations. This pattern of findings also reinforces the importance of stratifying populations for gene discovery when using a GWAS approach.
The ADH1B gene has been previously associated with MaxDrinks and related alcohol phenotypes in EA populations using linkage and candidate gene approaches. A genome scan of MaxDrinks identified significant loci in the 4q21.3 region (the maximal LOD=3.5), a region to which the ADH gene cluster maps. Drinkers with the ADH1B rs1229984*Arg48 allele were less likely to have a flushing response to alcohol (Bierut et al., 2012, Chen et al., 1999), report a higher Maxdrinks count (Bierut et al., 2012, Macgregor et al., 2009), and greater past year alcohol consumption (Macgregor et al., 2009, Edenberg, 2007) than those with the rs1229984*His48 allele. Consistent with earlier studies (Bierut et al., 2012), the genome-wide significance of rs1229984 in the current study was 10-15 in EAs, reflecting a relatively large effect size (β= -0.25). The individuals with His48 allele reported less Maxdrinks in EA population from our Yale-UPenn samples (Fig 4). Rs2066702, also at ADH1B, has not previously been associated with MaxDrinks, likely because of its low frequency in EAs and Asians, who are most heavily represented in studies of ADH1B variants and alcohol phenotypes. This SNP has a higher minor allele frequency in populations of African descent (0.19 in the present study). The p-value was 10-10 in the AA population in the combined Yale-UPenn and SAGE samples. Rs2066702 (Arg370Cys) is located in exon 9 and encodes the β3 subunit of ADH1B. The substitution of the cysteine residue, which results in more rapid alcohol metabolism than the common arginine residue, was associated with lower MaxDrinks. This finding is consistent with the substitution causing higher levels of acetaldehyde, which are aversive. In addition to the two known functional SNPs in ADH1B, rs20047889 was also associated with Maxdrinks, independent of the effect of rs2066702 in the AA samples. These findings, along with our previous findings of significant association of ALDH2 with MaxDrinks in a Chinese population (Quillen et al., 2014), provide additional strong evidence of a convergent biological pathway that involves alcohol metabolism in different populations.
Beyond the ADH cluster, we identified two potential novel loci for MaxDrinks in the EA population. Rs1799876 at SERPINC1 on chromosome 1 was significantly associated with Maxdrinks in our Yale-Upenn EA sample (p=4.0 x 10⁻⁸). It became nearly significant after adjusting for rs1229984 (p=1.99 x 10⁻⁷). SERPINC1, serpin peptidase inhibitor, clade C gene has been associated with thrombosis-related phenotypes (Fischer et al., 2013). Rs2309169 on chromosome 2 was significantly associated with Maxdrinks in the Yale-Upenn EA samples (p= 5.6 x 10⁻⁹). It remained highly significant after adjusting rs1229984 (p = 2.1 x 10⁻⁹). This SNP is close to Ankyrin Repeat Domain 36 (ANKRD36). The link of ANKRD36 with Maxdrinks is still unknown.
We previously found a significant association of ALDH2 with MaxDrinks in a Chinese population (Quillen et al., 2014). No such relationship was observed in either population in the present study, which is not surprising inasmuch as the allele that is protective in some Asian populations is not observed in either AAs or EAs.
Two other GWAS of alcohol consumption phenotypes have been reported in European-ancestry populations. Heath et al (2011) conducted a GWAS analysis with a well characterized quantitative phenotype for heaviness of alcohol consumption that included MaxDrinks in the Australian Twin Registry sample (a total of 8,300 subjects), and failed to identify a genome wide significant association (Heath et al., 2011). Our success in identifying potential novel loci for MaxDrinks is likely due to a higher density genotyping array and a greater proportion of affected subjects in the present study. Approximately 890,000 SNPs were genotyped in our samples compared to only 30K SNPs in Heath et al.'s study. More recently, Pan et al (2013) reported several SNPs at DDC that were associated with MaxDrinks in the SAGE sample (p=2.87 x 10⁻⁵) (Pan et al., 2013). They also reported an association of rs1128951 on chromosome 3 with MaxDrinks in the combined SAGE and COGA samples (p=4.3 x 10⁻⁸). It is noteworthy that the p value in that study did not reach the conventional value of 5x10⁻⁸. We did not replicate either finding. The SAGE sample is composed of both EA and AA populations and their study did not address population stratification, which makes it difficult to interpret these findings. As discussed above, risk loci for MaxDrinks may differ across populations. Thus, population admixture may contribute to inconsistent findings.
The present loci identified via GWAS for MaxDrinks overlap partially with loci identified in our previous GWAS for AD, but independent loci were also observed in each study. These findings suggest that shared genetic influences on MaxDrinks and AD phenotypes are attributable in large part to alcohol metabolism genes. These results are consistent with prior genetic epidemiologic findings from a twin study of alcohol consumption phenotypes, where a high degree of genetic overlap between the heaviness of consumption and AD symptoms was observed (Grant et al., 2009). In our Yale-UPenn sample, significant correlation of Maxdrinks and AD symptoms were also observed in both EAs and AAs (Sartor et al., 2014). Numerous genes that were reported genome wide significant in GWAS for AD (Gelernter et al., 2014), including PDL1M5 in EAs, METAP in AAs, MTIF2 and CCDC88A in both EAs and AAs, were not associated with MaxDrinks in the current study. Similarly, several of the genes associated with MaxDrinks in this study have not been reported previously to be associated with AD, suggesting specific genetic loci contribution to Maxdrinks.
Despite the strengths of the study, certain limitations should be noted. Some of our Yale-UPenn sample was recruited for studies of drug dependence rather than alcohol dependence, while the SAGE sample was primarily recruited for alcohol dependence. Although we adjusted for these comorbidities, greater substance dependence comorbidity in the Yale-UPenn sample may have contributed to the differences in findings with respect to the SAGE sample. We note that many prior studies have not taken note of substance use comorbidity at all, and the assumption that there is less comorbidity in those cases where it is not reported, is not necessarily warranted. We also acknowledged the proportion of sex and races are slightly different between two datasets. In the meta-analysis, we analyzed associations separately in EAs and AAs, and adjusted sex and other demographics.
Nevertheless, this is among the first study to apply GWAS in a large independent sample for MaxDrinks that included both EA and AA populations. The replication of findings related to the ADH1B validates the analytic strategies. Efforts to replicate the newly identified loci in independent samples are warranted.
Supplementary Material
Acknowledgments
We appreciate the work in recruitment and assessment provided at Yale University School of Medicine and the APT Foundation by James Poling, PhD; at McLean Hospital by Roger Weiss, M.D., at the Medical University of South Carolina by Kathleen Brady, M.D., Ph.D., and at the University of Pennsylvania by David Oslin, M.D. Genotyping services for a part of our GWAS study were provided by the Center for Inherited Disease Research (CIDR) and Yale University (Center for Genome Analysis). CIDR is fully funded through a federal contract from the National Institutes of Health to The Johns Hopkins University (contract number N01-HG-65403). We are grateful to Ann Marie Lacobelle, Catherine Aldi, and Christa Robinson for their excellent technical assistance, to the SSADDA interviewers, led by Yari Nuñez and Michelle Slivinsky, who devoted substantial time and effort to phenotype the study sample, and to John Farrell and Alexan Mardigan for database management assistance. We thank Amy Hart, PhD for her helpful comments on the manuscript.
The publicly available datasets used for the analyses described in this manuscript were obtained from dbGaP at http://www.ncbi.nlm.nih.gov/projects/gap/cgi-bin/study.cgi?study_id=phs000092.v1.p1 through dbGaP accession number phs000092.v1.p. Funding support for the Study of Addiction: Genetics and Environment (SAGE) was provided through the NIH Genes, Environment and Health Initiative [GEI] (U01 HG004422). SAGE is one of the genome-wide association studies funded as part of the Gene Environment Association Studies (GENEVA) under GEI. Assistance with phenotype harmonization and genotype cleaning, as well as with general study coordination, was provided by the GENEVA Coordinating Center (U01 HG004446).
Assistance with data cleaning was provided by the National Center for Biotechnology Information. Support for collection of datasets and samples was provided by the Collaborative Study on the Genetics of Alcoholism (COGA; U10 AA008401), the Collaborative Genetic Study of Nicotine Dependence (COGEND; P01 CA089392), and the Family Study of Cocaine Dependence (FSCD; R01 DA013423). Funding support for genotyping, which was performed at the Johns Hopkins University Center for Inherited Disease Research, was provided by the NIH GEI (U01HG004438), the National Institute on Alcohol Abuse and Alcoholism, the National Institute on Drug Abuse, and the NIH contract “High throughput genotyping for studying the genetic contributions to human disease” (HHSN268200782096C).
Funding and Disclosure: This study was supported by National Institutes of Health grants RC2 DA028909, R01 DA12690, R01 DA12849, R01 DA18432, R01 AA11330, R01 AA017535, K12 DA000167, K01 AA017921, and the Robert E. Leet and Clara Guthrie Patterson Trust; and the VA Connecticut and Philadelphia VA MIRECCs.
Dr. Kranzler has been a consultant or advisory board member for Alkermes, Lilly, Lundbeck, Pfizer and Roche. He is also a member of the American Society of Clinical Psychopharmacology's Alcohol Clinical Trial Initiative, which is supported by AbbVie, Alkermes, Ethypharm, Lilly, Lundbeck, and Pfizer
References
- Agrawal A, Freedman ND, Cheng YC, Lin P, Shaffer JR, Sun Q, Taylor K, Yaspan B, Cole JW, Cornelis MC, DeSensi RS, Fitzpatrick A, Heiss G, Kang JH, O’Connell J, Bennett S, Bookman E, Bucholz KK, Caporaso N, Crout R, Dick DM, Edenberg HJ, Goate A, Hesselbrock V, Kittner S, Kramer J, Nurnberger JI, Jr, Qi L, Rice JP, Schuckit M, van Dam RM, Boerwinkle E, Hu F, Levy S, Marazita M, Mitchell BD, Pasquale LR, Bierut LJ, Consortium G. Measuring alcohol consumption for genomic meta-analyses of alcohol intake: opportunities and challenges. The American journal of clinical nutrition. 2012;95:539–547. doi: 10.3945/ajcn.111.015545. [DOI] [PMC free article] [PubMed] [Google Scholar]
- Agrawal A, Grant JD, Littlefield A, Waldron M, Pergadia ML, Lynskey MT, Madden PA, Todorov A, Trull T, Bucholz KK, Todd RD, Sher K, Heath AC. Developing a quantitative measure of alcohol consumption for genomic studies on prospective cohorts. Journal of studies on alcohol and drugs. 2009;70:157–168. doi: 10.15288/jsad.2009.70.157. [DOI] [PMC free article] [PubMed] [Google Scholar]
- Baik I, Cho NH, Kim SH, Han BG, Shin C. Genome-wide association studies identify genetic loci related to alcohol consumption in Korean men. The American journal of clinical nutrition. 2011;93:809–816. doi: 10.3945/ajcn.110.001776. [DOI] [PubMed] [Google Scholar]
- Bierut LJ. Genetic variation that contributes to nicotine dependence. Pharmacogenomics. 2007;8:881–883. doi: 10.2217/14622416.8.8.881. [DOI] [PubMed] [Google Scholar]
- Bierut LJ, Agrawal A, Bucholz KK, Doheny KF, Laurie C, Pugh E, Fisher S, Fox L, Howells W, Bertelsen S, Hinrichs AL, Almasy L, Breslau N, Culverhouse RC, Dick DM, Edenberg HJ, Foroud T, Grucza RA, Hatsukami D, Hesselbrock V, Johnson EO, Kramer J, Krueger RF, Kuperman S, Lynskey M, Mann K, Neuman RJ, Nothen MM, Nurnberger JI, Jr, Porjesz B, Ridinger M, Saccone NL, Saccone SF, Schuckit MA, Tischfield JA, Wang JC, Rietschel M, Goate AM, Rice JP, Gene EASC. A genome-wide association study of alcohol dependence. Proceedings of the National Academy of Sciences of the United States of America. 2010;107:5082–5087. doi: 10.1073/pnas.0911109107. [DOI] [PMC free article] [PubMed] [Google Scholar]
- Bierut LJ, Goate AM, Breslau N, Johnson EO, Bertelsen S, Fox L, Agrawal A, Bucholz KK, Grucza R, Hesselbrock V, Kramer J, Kuperman S, Nurnberger J, Porjesz B, Saccone NL, Schuckit M, Tischfield J, Wang JC, Foroud T, Rice JP, Edenberg HJ. ADH1B is associated with alcohol dependence and alcohol consumption in populations of European and African ancestry. Mol Psychiatry. 2012;17:445–450. doi: 10.1038/mp.2011.124. [DOI] [PMC free article] [PubMed] [Google Scholar]
- Chen CC, Lu RB, Chen YC, Wang MF, Chang YC, Li TK, Yin SJ. Interaction between the functional polymorphisms of the alcohol-metabolism genes in protection against alcoholism. American journal of human genetics. 1999;65:795–807. doi: 10.1086/302540. [DOI] [PMC free article] [PubMed] [Google Scholar]
- Edenberg HJ. The collaborative study on the genetics of alcoholism: an update. Alcohol research & health : the journal of the National Institute on Alcohol Abuse and Alcoholism. 2002;26:214–218. [PMC free article] [PubMed] [Google Scholar]
- Edenberg HJ. The genetics of alcohol metabolism: role of alcohol dehydrogenase and aldehyde dehydrogenase variants. Alcohol research & health : the journal of the National Institute on Alcohol Abuse and Alcoholism. 2007;30:5–13. [PMC free article] [PubMed] [Google Scholar]
- Edenberg HJ, Foroud T. The genetics of alcoholism: identifying specific genes through family studies. Addiction biology. 2006;11:386–396. doi: 10.1111/j.1369-1600.2006.00035.x. [DOI] [PubMed] [Google Scholar]
- Edenberg HJ, Xuei X, Chen HJ, Tian H, Wetherill LF, Dick DM, Almasy L, Bierut L, Bucholz KK, Goate A, Hesselbrock V, Kuperman S, Nurnberger J, Porjesz B, Rice J, Schuckit M, Tischfield J, Begleiter H, Foroud T. Association of alcohol dehydrogenase genes with alcohol dependence: a comprehensive analysis. Human molecular genetics. 2006;15:1539–1549. doi: 10.1093/hmg/ddl073. [DOI] [PubMed] [Google Scholar]
- Fischer R, Sachs UJ, Heidinger KS, Eisenburger D, Kemkes-Matthes B. Prevalence of hereditary antithrombin mutations is higher than estimated in patients with thrombotic events. Blood coagulation & fibrinolysis : an international journal in haemostasis and thrombosis. 2013;24:444–448. doi: 10.1097/MBC.0b013e32835cc143. [DOI] [PubMed] [Google Scholar]
- Gelernter J, Kranzler HR, Sherva R, Almasy L, Koesterer R, Smith AH, Anton R, Preuss UW, Ridinger M, Rujescu D, Wodarz N, Zill P, Zhao H, Farrer LA. Genome-wide association study of alcohol dependence:significant findings in African- and European-Americans including novel risk loci. Mol Psychiatry. 2014;19:41–49. doi: 10.1038/mp.2013.145. [DOI] [PMC free article] [PubMed] [Google Scholar]
- Gelernter J, Panhuysen C, Weiss R, Brady K, Hesselbrock V, Rounsaville B, Poling J, Wilcox M, Farrer L, Kranzler HR. Genomewide linkage scan for cocaine dependence and related traits: significant linkages for a cocaine-related trait and cocaine-induced paranoia. American journal of medical genetics Part B, Neuropsychiatric genetics : the official publication of the International Society of Psychiatric Genetics. 2005;136B:45–52. doi: 10.1002/ajmg.b.30189. [DOI] [PubMed] [Google Scholar]
- Gelernter J, Sherva R, Koesterer R, Almasy L, Zhao H, Kranzler HR, Farrer L. Genome-wide association study of cocaine dependence and related traits: FAM53B identified as a risk gene. Molecular psychiatry. 2013 doi: 10.1038/mp.2013.99. [DOI] [PMC free article] [PubMed] [Google Scholar]
- Grant JD, Agrawal A, Bucholz KK, Madden PA, Pergadia ML, Nelson EC, Lynskey MT, Todd RD, Todorov AA, Hansell NK, Whitfield JB, Martin NG, Heath AC. Alcohol consumption indices of genetic risk for alcohol dependence. Biological psychiatry. 2009;66:795–800. doi: 10.1016/j.biopsych.2009.05.018. [DOI] [PMC free article] [PubMed] [Google Scholar]
- Grucza RA, Wang JC, Stitzel JA, Hinrichs AL, Saccone SF, Saccone NL, Bucholz KK, Cloninger CR, Neuman RJ, Budde JP, Fox L, Bertelsen S, Kramer J, Hesselbrock V, Tischfield J, Nurnberger JI, Jr, Almasy L, Porjesz B, Kuperman S, Schuckit MA, Edenberg HJ, Rice JP, Goate AM, Bierut LJ. A risk allele for nicotine dependence in CHRNA5 is a protective allele for cocaine dependence. Biological psychiatry. 2008;64:922–929. doi: 10.1016/j.biopsych.2008.04.018. [DOI] [PMC free article] [PubMed] [Google Scholar]
- Heath AC, Whitfield JB, Martin NG, Pergadia ML, Goate AM, Lind PA, McEvoy BP, Schrage AJ, Grant JD, Chou YL, Zhu R, Henders AK, Medland SE, Gordon SD, Nelson EC, Agrawal A, Nyholt DR, Bucholz KK, Madden PA, Montgomery GW. A quantitative-trait genome-wide association study of alcoholism risk in the community: findings and implications. Biological psychiatry. 2011;70:513–518. doi: 10.1016/j.biopsych.2011.02.028. [DOI] [PMC free article] [PubMed] [Google Scholar]
- Kapoor M, Wang JC, Wetherill L, Le N, Bertelsen S, Hinrichs AL, Budde J, Agrawal A, Bucholz K, Dick D, Harari O, Hesselbrock V, Kramer J, Nurnberger JI, Jr, Rice J, Saccone N, Schuckit M, Tischfield J, Porjesz B, Edenberg HJ, Bierut L, Foroud T, Goate A. A meta-analysis of two genome-wide association studies to identify novel loci for maximum number of alcoholic drinks. Human genetics. 2013;132:1141–1151. doi: 10.1007/s00439-013-1318-z. [DOI] [PMC free article] [PubMed] [Google Scholar]
- Kendler KS, Myers J, Dick D, Prescott CA. The relationship between genetic influences on alcohol dependence and on patterns of alcohol consumption. Alcohol Clin Exp Res. 2010;34:1058–1065. doi: 10.1111/j.1530-0277.2010.01181.x. [DOI] [PMC free article] [PubMed] [Google Scholar]
- Kuo PH, Neale MC, Riley BP, Webb BT, Sullivan PF, Vittum J, Patterson DG, Thiselton DL, van den Oord EJ, Walsh D, Kendler KS, Prescott CA. Identification of susceptibility loci for alcohol-related traits in the Irish Affected Sib Pair Study of Alcohol Dependence. Alcohol Clin Exp Res. 2006;30:1807–1816. doi: 10.1111/j.1530-0277.2006.00217.x. [DOI] [PubMed] [Google Scholar]
- Macgregor S, Lind PA, Bucholz KK, Hansell NK, Madden PA, Richter MM, Montgomery GW, Martin NG, Heath AC, Whitfield JB. Associations of ADH and ALDH2 gene variation with self report alcohol reactions, consumption and dependence: an integrated analysis. Hum Mol Genet. 2009;18:580–593. doi: 10.1093/hmg/ddn372. [DOI] [PMC free article] [PubMed] [Google Scholar]
- Meyers JL, Shmulewitz D, Wall MM, Keyes KM, Aharonovich E, Spivak B, Weizman A, Frisch A, Edenberg HJ, Gelernter J, Grant BF, Hasin D. Childhood adversity moderates the effect of ADH1B on risk for alcohol-related phenotypes in Jewish Israeli drinkers. Addiction biology. 2013 doi: 10.1111/adb.12102. [DOI] [PMC free article] [PubMed] [Google Scholar]
- Pan Y, Luo X, Liu X, Wu LY, Zhang Q, Wang L, Wang W, Zuo L, Wang KS. Genome-wide association studies of maximum number of drinks. Journal of psychiatric research. 2013;47:1717–1724. doi: 10.1016/j.jpsychires.2013.07.013. [DOI] [PMC free article] [PubMed] [Google Scholar]
- Park BL, Kim JW, Cheong HS, Kim LH, Lee BC, Seo CH, Kang TC, Nam YW, Kim GB, Shin HD, Choi IG. Extended genetic effects of ADH cluster genes on the risk of alcohol dependence: from GWAS to replication. Human genetics. 2013;132:657–668. doi: 10.1007/s00439-013-1281-8. [DOI] [PubMed] [Google Scholar]
- Patterson N, Price AL, Reich D. Population structure and eigenanalysis. PLoS genetics. 2006;2:e190. doi: 10.1371/journal.pgen.0020190. [DOI] [PMC free article] [PubMed] [Google Scholar]
- Pierucci-Lagha A, Gelernter J, Feinn R, Cubells JF, Pearson D, Pollastri A, Farrer L, Kranzler HR. Diagnostic reliability of the Semi-structured Assessment for Drug Dependence and Alcoholism (SSADDA) Drug and alcohol dependence. 2005;80:303–312. doi: 10.1016/j.drugalcdep.2005.04.005. [DOI] [PubMed] [Google Scholar]
- Price AL, Patterson NJ, Plenge RM, Weinblatt ME, Shadick NA, Reich D. Principal components analysis corrects for stratification in genome-wide association studies. Nature genetics. 2006;38:904–909. doi: 10.1038/ng1847. [DOI] [PubMed] [Google Scholar]
- Quillen EE, Chen XD, Almasy L, Yang F, He H, Li X, Wang XY, Liu TQ, Hao W, Deng HW, Kranzler HR, Gelernter J. ALDH2 is associated to alcohol dependence and is the major genetic determinant of “daily maximum drinks” in a GWAS study of an isolated rural chinese sample. Am J Med Genet B Neuropsychiatr Genet. 2014;165B:103–110. doi: 10.1002/ajmg.b.32213. [DOI] [PMC free article] [PubMed] [Google Scholar]
- Saccone NL, Kwon JM, Corbett J, Goate A, Rochberg N, Edenberg HJ, Foroud T, Li TK, Begleiter H, Reich T, Rice JP. A genome screen of maximum number of drinks as an alcoholism phenotype. American journal of medical genetics. 2000;96:632–637. doi: 10.1002/1096-8628(20001009)96:5<632::aid-ajmg8>3.0.co;2-#. [DOI] [PubMed] [Google Scholar]
- Saccone SF, Saccone NL, Neuman RJ, Rice JP. Genetic analysis of the maximum drinks phenotype. BMC genetics. 2005;6(Suppl 1):S124. doi: 10.1186/1471-2156-6-S1-S124. [DOI] [PMC free article] [PubMed] [Google Scholar]
- Sartor CE, Wang Z, Xu K, Kranzler HR, Gelernter J. The joint effects of ADH1B variants and childhood adversity on alcohol related phenotypes in African-American and European-American women and men. Alcohol Clin Exp Res. 2014;38:2907–2914. doi: 10.1111/acer.12572. [DOI] [PMC free article] [PubMed] [Google Scholar]
- Schumann G, Coin LJ, Lourdusamy A, Charoen P, Berger KH, Stacey D, Desrivieres S, Aliev FA, Khan AA, Amin N, Aulchenko YS, Bakalkin G, Bakker SJ, Balkau B, Beulens JW, Bilbao A, de Boer RA, Beury D, Bots ML, Breetvelt EJ, Cauchi S, Cavalcanti-Proenca C, Chambers JC, Clarke TK, Dahmen N, de Geus EJ, Dick D, Ducci F, Easton A, Edenberg HJ, Esko T, Fernandez-Medarde A, Foroud T, Freimer NB, Girault JA, Grobbee DE, Guarrera S, Gudbjartsson DF, Hartikainen AL, Heath AC, Hesselbrock V, Hofman A, Hottenga JJ, Isohanni MK, Kaprio J, Khaw KT, Kuehnel B, Laitinen J, Lobbens S, Luan J, Mangino M, Maroteaux M, Matullo G, McCarthy MI, Mueller C, Navis G, Numans ME, Nunez A, Nyholt DR, Onland-Moret CN, Oostra BA, O’Reilly PF, Palkovits M, Penninx BW, Polidoro S, Pouta A, Prokopenko I, Ricceri F, Santos E, Smit JH, Soranzo N, Song K, Sovio U, Stumvoll M, Surakk I, Thorgeirsson TE, Thorsteinsdottir U, Troakes C, Tyrfingsson T, Tonjes A, Uiterwaal CS, Uitterlinden AG, van der Harst P, van der Schouw YT, Staehlin O, Vogelzangs N, Vollenweider P, Waeber G, Wareham NJ, Waterworth DM, Whitfield JB, Wichmann EH, Willemsen G, Witteman JC, Yuan X, Zhai G, Zhao JH, Zhang W, Martin NG, Metspalu A, Doering A, Scott J, Spector TD, Loos RJ, Boomsma DI, Mooser V, Peltonen L, Stefansson K, van Duijn CM, Vineis P, Sommer WH, Kooner JS, Spanagel R, Heberlein UA, Jarvelin MR, Elliott P. Genome-wide association and genetic functional studies identify autism susceptibility candidate 2 gene (AUTS2) in the regulation of alcohol consumption. Proceedings of the National Academy of Sciences of the United States of America. 2011;108:7119–7124. doi: 10.1073/pnas.1017288108. [DOI] [PMC free article] [PubMed] [Google Scholar]
- Treutlein J, Cichon S, Ridinger M, Wodarz N, Soyka M, Zill P, Maier W, Moessner R, Gaebel W, Dahmen N, Fehr C, Scherbaum N, Steffens M, Ludwig KU, Frank J, Wichmann HE, Schreiber S, Dragano N, Sommer WH, Leonardi-Essmann F, Lourdusamy A, Gebicke-Haerter P, Wienker TF, Sullivan PF, Nothen MM, Kiefer F, Spanagel R, Mann K, Rietschel M. Genome-wide association study of alcohol dependence. Archives of general psychiatry. 2009;66:773–784. doi: 10.1001/archgenpsychiatry.2009.83. [DOI] [PMC free article] [PubMed] [Google Scholar]
- Wang JC, Foroud T, Hinrichs AL, Le NX, Bertelsen S, Budde JP, Harari O, Koller DL, Wetherill L, Agrawal A, Almasy L, Brooks AI, Bucholz K, Dick D, Hesselbrock V, Johnson EO, Kang S, Kapoor M, Kramer J, Kuperman S, Madden PA, Manz N, Martin NG, McClintick JN, Montgomery GW, Nurnberger JI, Jr, Rangaswamy M, Rice J, Schuckit M, Tischfield JA, Whitfield JB, Xuei X, Porjesz B, Heath AC, Edenberg HJ, Bierut LJ, Goate AM. A genome-wide association study of alcohol-dependence symptom counts in extended pedigrees identifies C15orf53. Mol Psychiatry. 2013;18:1218–1224. doi: 10.1038/mp.2012.143. [DOI] [PMC free article] [PubMed] [Google Scholar]
- Willer CJ, Li Y, Abecasis GR. METAL: fast and efficient meta-analysis of genomewide association scans. Bioinformatics. 2010;26:2190–2191. doi: 10.1093/bioinformatics/btq340. [DOI] [PMC free article] [PubMed] [Google Scholar]
Associated Data
This section collects any data citations, data availability statements, or supplementary materials included in this article.