

Supplemental Digital Content is available in the text
Abstract
Analyses of the Third National Health and Nutrition Examination Survey (NHANES III) in 1988 to 1994 found an association of increasing blood lead levels <10 μg/dL with a higher risk of cardiovascular disease (CVD) mortality. The potential need to correct blood lead for hematocrit/hemoglobin and adjust for biomarkers for other metals, for example, cadmium and iron, had not been addressed in the previous NHANES III-based studies on blood lead-CVD mortality association.
We analyzed 1999 to 2010 NHANES data for 18,602 participants who had a blood lead measurement, were ≥40 years of age at the baseline examination and were followed for mortality through 2011. We calculated the relative risk for CVD mortality as a function of hemoglobin- or hematocrit-corrected log-transformed blood lead through Cox proportional hazard regression analysis with adjustment for serum iron, blood cadmium, serum C-reactive protein, serum calcium, smoking, alcohol intake, race/Hispanic origin, and sex.
The adjusted relative risk for CVD mortality was 1.44 (95% confidence interval = 1.05, 1.98) per 10-fold increase in hematocrit-corrected blood lead with little evidence of nonlinearity. Similar results were obtained with hemoglobin-corrected blood lead. Not correcting blood lead for hematocrit/hemoglobin resulted in underestimation of the lead-CVD mortality association while not adjusting for iron status and blood cadmium resulted in overestimation of the lead-CVD mortality association.
In a nationally representative sample of U.S. adults, log-transformed blood lead was linearly associated with increased CVD mortality. Correcting blood lead for hematocrit/hemoglobin and adjustments for some biomarkers affected the association.
INTRODUCTION
Over the last several decades, studies have identified lead as a risk factor for a number of health outcomes, including cardiovascular morbidity, cancer, and renal dysfunction.1 Associations between blood lead levels and mortality were investigated using data from the Third National Health and Nutrition Examination Survey (NHANES III) linked to mortality follow-up through 2006: higher whole blood lead levels were associated with higher all-cause and cardiovascular disease (CVD) mortality.2,3
The relationship between whole blood lead and CVD mortality may be confounded by anemia since anemia has been found to be associated with increased CVD mortality4 and may affect whole blood lead levels due to the fact that the majority of lead in blood is in red blood cells.5 As a result, hematocrit-corrected blood lead or hemoglobin-corrected blood lead may be better biomarkers of exposure than whole blood lead.5 In addition, iron and calcium status may affect lead absorption and confound the lead-mortality association. Exposure to cadmium is also a potential confounder since cigarette smoke, a known causal agent for CVD, contains both lead and cadmium. In prior studies of lead-mortality association based on NHANES III data, there was no adjustment for biomarkers of exposure or body burden of these bivalent metals. There was also no correction of blood lead for hematocrit or hemoglobin.2,3
The main aim of this study is to examine the blood lead-cardiovascular mortality association with hematocrit/hemoglobin-corrected blood lead using NHANES 1999 to 2010 with mortality follow-up through 2011. As secondary objectives, we assess adjustment for cadmium and other biomarkers on the effect estimates and compare results using hematocrit/hemoglobin-corrected blood lead to those using whole blood lead. The consideration of hematocrit/hemoglobin and other biomarkers may lead to more accurate estimates for policy decisions.
This study focuses on CVD mortality for a few reasons. CVDs, including diseases of heart, cerebrovascular diseases, and hypertension, are leading causes of death in the U.S., accounting for approximately 30% of deaths.6 The National Toxicology Program concluded that there is “sufficient” evidence of an association between lead exposure below 10 μg/dL and both increased blood pressure and hypertension.7 The U.S. Environmental Protection Agency has concluded that lead exposure is causally related to coronary heart disease and hypertension.8 Yet, epidemiological studies with estimates that allow quantitation of CVD mortality reduction corresponding to a specific magnitude of relative reduction in blood lead still remain scarce.
METHODS
Study Design and Population
We used the 1999 to 2010 NHANES with mortality follow-up information through 2011.9 NHANES is conducted by the National Center for Health Statistics (NCHS) of the Centers for Disease Control and Prevention and designed to assess the health and nutritional status of the civilian, noninstitutionalized U.S. population through interviews and physical examinations. The NHANES uses a complex, multistage, probability sampling design, and certain subgroups are oversampled to improve the precision of estimates. The survey includes an interview at home and a subsequent visit to a mobile examination center. For the six 2-year NHANES data releases from 1999 to 2010, the final response rates for the exam component for adults age 40 years and over ranged from 53.9% to 76.7%.10 The NCHS Research Ethics Review Board approved NHANES, and all participants aged 17 years and older provided written informed consent. NHANES participants aged 17 years and over were eligible for passive mortality follow-up, which was based on a probabilistic match between NHANES and the National Death Index.9
There were 20,004 participants in NHANES 1999 to 2010 who underwent the physical examination and blood draw and were age 40 years and over at the time of the physical examination. Of those, 1305 participants had missing laboratory measurements needed for constructing the variables used in the main Cox regression model described later, and an additional 97 participants had missing questionnaire responses. The remaining 18,602 participants formed the analytic sample. A subset of the analytic sample from NHANES 1999 to 2006 (n = 10,264) was used for the analyses involving multiply imputed bone mineral density (BMD) data, which were measured only in 1999 to 2006.
Baseline Data Collection
During the in-home interview, a standardized questionnaire was administered that included information on demographic factors (age, race/Hispanic origin, sex, and education). Race/ethnic groups were: non-Hispanic white, non-Hispanic black, Mexican American, and other (including other Hispanic, other races and ethnicities, and multiracial). Education levels were: less than high school, high school, and college or higher. Census region and level of urbanization were determined based on the county of residence.
At the examination, information on cigarette smoking and alcohol consumption was collected, and a blood specimen was drawn. Hematocrit11 and hemoglobin12 were measured immediately. For the 1999 to 2002 survey years, whole blood lead and cadmium were measured using adaptations of the methods of Miller et al,13 Parsons and Slavin,14 and Stoeppler and Brandt.15 Whole blood lead and cadmium were simultaneously measured by inductively coupled plasma mass spectrometry in 2003 to 2010.16 For other biomarkers, there was no change in the methods used across survey periods. Serum iron was measured by the ferrozine colorimetric method adapted for automated analysers.17 Serum calcium was measured by the methods of Sarkar and Chauhan18 modified by Baginski et al19 and adapted for automated analyzers. A detailed description of laboratory procedures and analytical methods for these analytes, as well as serum cotinine and C-reactive protein, is available elsewhere.20 BMD was measured using dual energy X-ray absorptiometry.21
Smoking was categorized as never, former, or current, based on both questionnaire response and serum cotinine measurement (“never” status assigned if reported smoking less than 100 cigarettes during lifetime and “current” status assigned if serum cotinine >10 ng/mL irrespective of self-reported status). Alcohol consumption was expressed as the number of alcoholic drinks consumed per week.
The main exposure variables were hematocrit-corrected blood lead and hemoglobin-corrected blood obtained by dividing whole blood lead by hematocrit and hemoglobin, respectively. Each corrected variable was multiplied by the weighted geometric mean of hematocrit or hemoglobin, respectively, in the analytic sample so that the results for the corrected variables would be comparable to those for whole blood lead. The rationale for correcting blood lead for hematocrit or hemoglobin hinges on the facts that more than 99% of whole blood lead exists in red blood cells, and the concentration of red blood cells in whole blood varies across individuals.5 In lead-induced anemia, a person's lead status could be underestimated by whole blood lead, and such underestimation can be avoided by the use of hematocrit- and hemoglobin-correction.5 Additional rationale for correcting blood lead for hematocrit or hemoglobin is provided in eAppendix (Supplemental Digital Content). Results for the hematocrit and hemoglobin corrected blood lead variables were compared to those for uncorrected whole blood.
Mortality Follow-Up
Participants were followed up for mortality from the date of the physical examination through December 31, 2011. Participants without a match in a death record were considered alive through this date. Participants who died of causes other than CVD were censored at the time of death. CVD deaths were identified with International Classification of Diseases revision 10 codes I00-I99 on death certificates.
Statistical Methods
We fit Cox proportional hazard regression to the analytic sample to model the association between blood lead and CVD mortality using age during the follow-up as the time scale. The use of age, instead of elapsed time since enrollment to the cohort, as time scale has been recommended by Korn et al (1997)22 and implemented in previous NHANES-based longitudinal studies.2,3 Each of the 3 blood lead measures were included in separate Cox models as a main exposure variable: hematocrit-corrected blood lead; hemoglobin-corrected blood lead; and (uncorrected) whole blood lead. These, as well as other right-skewed variables (blood cadmium and C-reactive protein), were log-transformed to be used in Cox regression. The main measures of association used were hazard ratios, which are also referred to as relative risks.
For each of the 3 blood lead measures, results based on a fully adjusted Cox model with covariates of basic demographic factors (race/Hispanic origin and sex), non-lead biomarkers (blood cadmium, serum iron, serum C-reactive protein, and serum calcium), smoking, education, and alcohol intake were reported. For hematocrit- and hemoglobin-corrected blood lead, results from 9 additional models with varying degrees of adjustment were reported to illustrate the nature of the confounding due to nonlead biomarkers. To facilitate interpretation, each model was assigned a code consisting of a letter and number: a letter designating the blood lead variable (“A” for hematocrit-corrected/adjusted lead, “B” for hemoglobin-corrected/adjusted blood lead, and “C” for whole blood lead) and a number differentiating the degree of adjustment/correction (“1” for a fully adjusted model). In 6 of the 9 additional models (A2-A7, B1-B7, and C1-C7), 1 or 2 nonlead biomarkers were dropped from the fully adjusted model. Models A8, B8, and C8, which included BMD in addition to the covariates in a fully adjusted model, were fit to a subset of the analytic sample (1999–2006 survey periods) because of the aforementioned limited data availability. Models A9 and B9, which used whole blood lead in place of corrected blood lead, were adjusted for all other covariates used in the fully adjusted model as well as for hematocrit or hemoglobin, respectively, by including either as one of the covariates. Models A0, B0, and C0 are minimally adjusted with no adjustment for nonlead metal biomarkers. Results from interim models are included in eTable 2 (Supplemental Digital Content). Multiple linear regression models with adjustment for all covariates included in the fully adjusted Cox regression models were used to describe associations between metal biomarkers and corrected blood lead. Our analyses accounted for the complex survey design of NHANES23 using the svy suite of Stata version 13 (College Station, TX).24
Continuous independent variables, except for alcohol consumption, were initially entered into Cox regression as 5 knot natural spline terms using cut-offs of weighted percentiles at 5, 25, 50, 75, and 95% in order to explore possible nonlinearity in their association with CVD mortality. Nonlinearity of association was tested by a Wald test for coefficients of nonlinear spline terms. Alcohol consumption was modeled using a quadratic function.
As mentioned earlier, some participants were not included in the analytic sample due to missing covariates. We performed a sensitivity analysis to examine whether the participants with blood lead measurements who were outside of the analytic sample (n = 435) had a blood lead-CVD mortality association different from the analytic sample (n = 18,602) using Cox regression models with hematocrit- or hemoglobin-corrected blood lead interacted with an indicator for the “outside” sample and a minimum set of covariates (sex and race/Hispanic origin). There was little evidence that the sample outside of the analytic sample had different blood lead-CVD mortality associations; the difference expressed as ratios of relative risks (out-of-analytic-sample vs analytic-sample) were 1.35 (95% confidence interval [CI]: 0.20–9.34) and 1.30 (0.19–8.96), respectively, for hematocrit- and hemoglobin-corrected blood lead.
RESULTS
Characteristics by blood lead categories are summarized in Table 1. Compared with the previously reported NHANES III cohort (for which baseline data were collected in 1988–1994),2 a lower proportion of participants had whole blood lead levels greater than 10 μg/dL, reflecting the secular decline reported for the U.S. population.25–27 There were 985 CVD deaths with a median follow-up time of 6.2 years in the analytic sample.
TABLE 1.
Baseline Characteristics and Cardiovascular Mortality Outcome by Whole Blood Lead Levels: National Health and Nutrition Examination Survey (NHANES) 1999 to 2010 as Baseline Survey with Follow-Up Through 2011
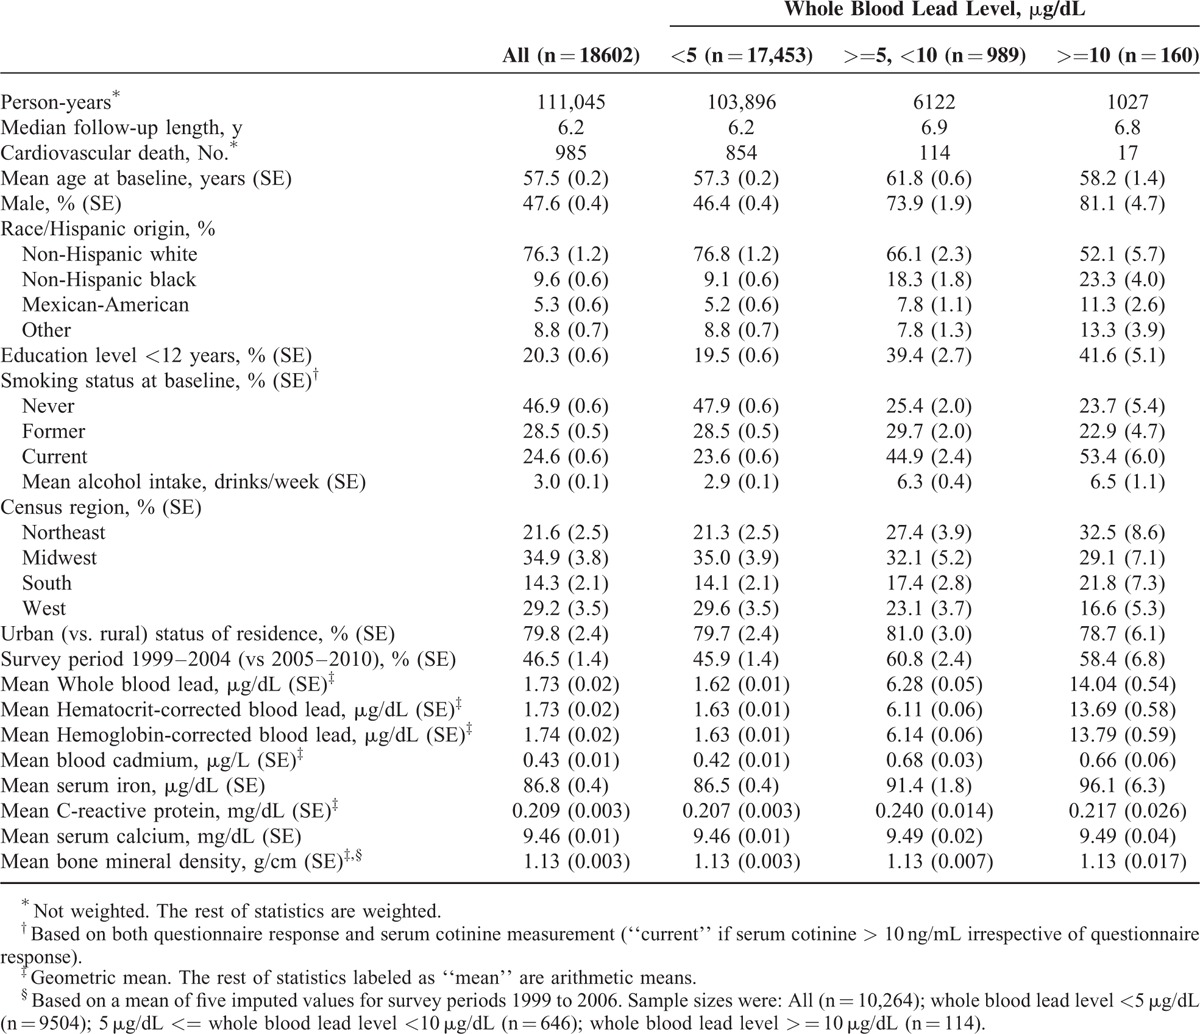
The log-transformed hematocrit-corrected blood lead and hemoglobin-corrected blood lead were highly correlated (correlation coefficient, 0.999, eTable 1, Supplemental Digital Content). These variables were also strongly correlated with whole blood lead, but to a slightly lesser degree (0.985 and 0.984, respectively).
Sex, race/Hispanic origin, education level, smoking, and alcohol intake were correlated with blood lead (Table 1). These variables were associated with cardiovascular mortality in preliminary analyses, and are, therefore, included in subsequent models. Census region and urban status of county of residence were not associated with cardiovascular mortality.
Shown in Table 2 are relative risks (or associated P-values for serum iron and serum calcium) from multiple models including those from the 3 fully adjusted models for hematocrit-corrected lead (model A1) and hemoglobin-corrected lead (model B1) with adjustment for metal biomarkers (blood cadmium, serum iron, and serum calcium). Relative risks for metal biomarkers from the fully adjusted hematocrit-corrected blood model (model A1) are depicted in Figure 1. Results from whole blood-based models (ie, no correction nor adjustment for hematocrit or hemoglobin) are also shown in Table 2. Additional results from models with just 1 nonlead biomarker are shown in eTable 2 (Supplemental Digital Content). Generally, results are similar for hematocrit- and hemoglobin-corrected blood lead, and the description below focuses mostly on results based on hematocrit-corrected blood lead levels.
TABLE 2.
Adjusted Relative Risk for Cardiovascular Mortality From Models With Varying Correction for Blood Lead and Adjustment for Other Covariates: NHANES 1999 to 2010 With Mortality Follow-Up Through 2011
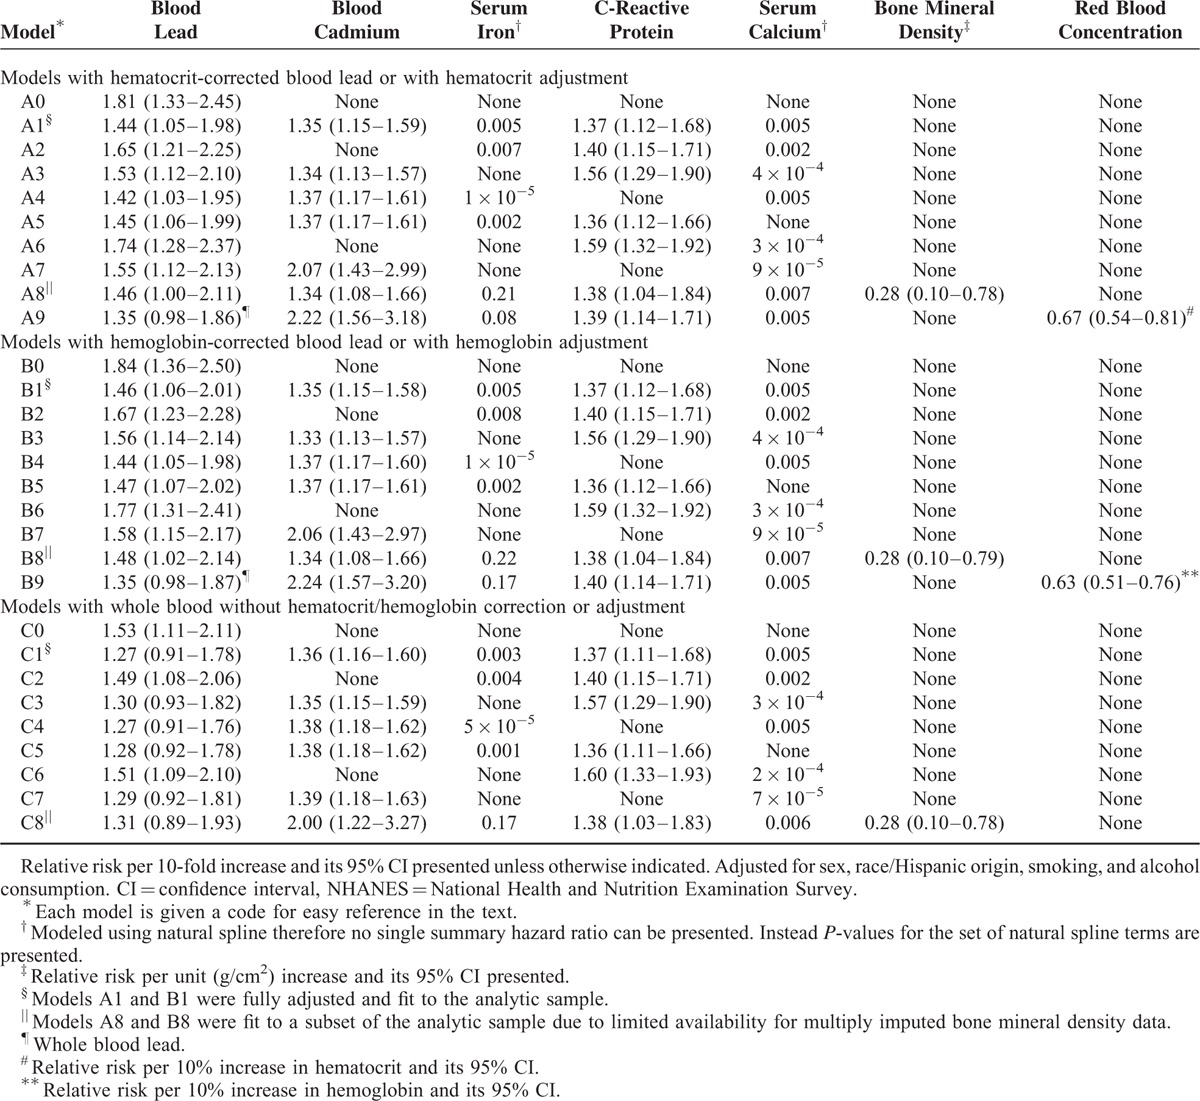
FIGURE 1.
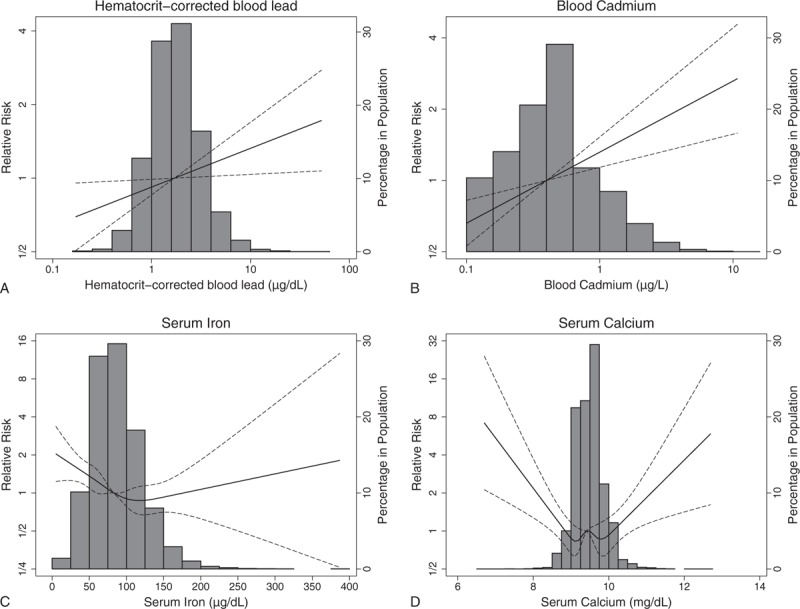
Adjusted relative risk of cardiovascular disease mortality for metal biomarkers (hematocrit-corrected blood lead levels [A], blood cadmium [B], serum iron [C], and serum calcium [D]) compared with referent level for median biomarker level: National Health and Nutrition Examination Survey (NHANES) 1999 to 2010 with mortality follow-up through 2011. The solid line or curve shows the relative risk; the dashed lines show the point-wise 95% confidence intervals. Histogram for biomarker is overlaid.
Log-transformed hemoglobin-corrected blood lead and hematocrit-corrected blood lead were linearly associated with CVD mortality. Using the fully adjusted models (A1 and B1), relative risks for CVD mortality associated with 10-fold increases for hematocrit- and hemoglobin-corrected blood were estimated to be 1.44 (95% confidence interval [CI]: 1.05–1.98) and 1.46 (1.06–2.01), respectively. Compared to the relative risks for these 2 corrected blood lead measures, the corresponding relative risk for whole blood lead (1.27, 95%CI: 0.91–1.78) was closer to one and its CI included one (model C1). For each of the 3 blood lead variables, a 10-fold increase roughly corresponds to a shift from the 2.5th percentile to 97.5th percentile of the respective blood lead variable, allowing direct comparisons among the 3 corresponding relative risks. There was little evidence for nonlinear association between any of these log-transformed blood lead measures and CVD mortality; P-values for nonlinearity were 0.97, 0.97, and 0.81, respectively, for hemoglobin-corrected blood lead, hematocrit-corrected blood lead, and whole blood lead.
Log-transformed blood cadmium was linearly associated with CVD mortality (Table 2). Serum iron and serum calcium had a U-shaped association with CVD mortality (Fig. 1).
Relative risks for blood lead from the models with whole blood lead and adjustment for hematocrit or hemoglobin (A9 and B9) were close to the relative risk from the whole blood-based model with adjustment for other metal biomarkers (C1) with CIs including one and were attenuated compared to the relative risks from the models with hematocrit or hemoglobin correction (A1 and B1). Other relative risks for whole blood lead (models C0 and C2–C8) were attenuated compared to the relative risks for hematocrit- or hemoglobin-corrected blood lead and were often accompanied by a CI including 1.
The patterns of change in the relative risk estimates when not adjusting for a covariate(s) were similar for the 2 corrected blood lead measures. Not adjusting for either blood cadmium (models A2 and B2) or serum iron (models A3 and B3), or both (models A6 and B6), was accompanied by higher relative risks for hematocrit- and hemoglobin-corrected blood lead. Similar patterns of changes in estimates were seen for whole blood-based models (C1–C8). Although removing serum iron alone (models A3 and B3) resulted in a noticeable upward shift in the relative risks for blood lead, removing C-reactive protein alone (models A4 and B4) did not substantially change the relative risks for blood lead (Table 2). When both serum iron and C-reactive protein were removed, the estimated relative risks for blood lead were similar to the results from the models without serum iron alone (model A7 vs A3 and B7 vs B3). These change-in-estimate patterns are consistent with known associations and suggest that blood cadmium and serum iron, but not C-reactive protein, may confound the lead-CVD mortality association.
Examination of eTable 2 (Supplemental Digital Content) and fully adjusted results in Table 2 revealed that adjusting for cadmium alone, without adjusting for other metal biomarkers, resulted in the greatest shift of blood lead relative risks toward the fully adjusted blood lead relative risks. Cadmium-adjusted blood lead relative risks, however, were still appreciably higher than the fully adjusted counterparts. That is, adjusting for cadmium alone was important but not sufficient.
Adjustment for serum calcium (model A5 [B5] vs A1 [B1]) and further adjustment for BMD (model A8 [B8] vs A1 [B1]) did not result in appreciable changes in relative risks for hematocrit- and hemoglobin-corrected blood lead compared to the fully adjusted models, indicating calcium status was not operating as a strong confounder for the observed blood lead-CVD mortality association. Serum calcium had a U-shaped association with hematocrit-corrected blood lead (eFigure 1, Supplemental Digital Content).
DISCUSSION
With adjustment for demographic factors and some important potential confounders, we observed a positive association between hematocrit- or hemoglobin-corrected blood lead and CVD mortality with estimated relative risks of 1.44 and 1.46, respectively, per 10-fold increase in corrected blood lead. The associations were linear in terms of relative changes in hematocrit- or hemoglobin-corrected blood lead with little evidence for nonlinearity. Two previous studies based on NHANES III baseline data and mortality follow-up showed that whole blood lead was associated with mortality outcomes in a nonmonotonic manner. Specifically, Menke et al3 observed that all-cause mortality, myocardial infarction mortality, and cancer mortality changed per a function of whole blood lead, with a negative slope when whole blood lead levels <2 μg/dL, a positive slope when whole blood lead >=2 and <5 μg/dL, then a negative slope when >5 μg/dL. Schober et al2 observed a similar pattern with the lowest risk of all-cause mortality at a whole blood lead level of approximately 3 μg/dL, yet they did not see a negative slope at the highest levels. The subtle differences in these results are likely due to variations in statistical adjustments. Neither of these 2 studies included graphical presentation of the lead-CVD mortality relationship nor formal assessment of nonlinearity of the relationship. As such, our finding on the linearity of association between whole blood lead and CVD mortality cannot be compared directly. Nonetheless, in our study the confidence interval for the estimated slope for the linear whole blood lead-CVD mortality association with adjustment for nonlead biomarkers (model C1) included the null value of 1, indicating only a weak association at best.
There has been a continuing debate over whether hematocrit and hemoglobin correction is appropriate for studies of blood lead.28 Hemoglobin or hematocrit “correction” is not exactly the same as a corresponding (statistical) “adjustment”. To contrast the 2 different approaches, we use “correction” to mean dividing whole blood lead by hemoglobin (or hematocrit) and using the resultant ratio-type variable as a single lead-related predictor in the right-hand side of a regression. In an alternative approach of “adjustment,” both whole blood lead and red blood cell concentration (hemoglobin or hematocrit) are included in the right-hand side of a regression. In the present application, if red blood cell concentration acted as an intermediate variable in the causal pathway between exposure to lead and mortality then the lead exposure's effects would have been absorbed into the coefficient representing the association between low red blood concentration and mortality. In fact, we found that the hematocrit/hemoglobin-adjusted relative risks for whole blood lead were attenuated compared to the corresponding relative risks for hematocrit/hemoglobin-corrected blood lead. We also observed that the relative risks for whole blood were attenuated, presumably because of uncontrolled confounding due to antecedent anemia (or subclinical reduction in red blood cells). Interestingly, the fully adjusted relative risks for hematocrit- or hemoglobin-corrected blood lead are close to the relative risk for whole blood lead without adjustment for nonlead biomarkers, that is, the estimate without justifiable correction or adjustment (see the rest of Discussion) because not correcting for red blood cell concentration and not adjusting for nonlead metal biomarkers bias blood lead relative risks in the opposite directions.
The comparison of the results from models with varying adjustment for biomarkers closely related to lead exposure and absorption indicated the importance of adjusting for blood cadmium and iron status in assessing the lead-CVD mortality association. As shown in the Results, when one or both of these variables were dropped from the fully adjusted models (models A2, A3, and A6 in Table 2), higher relative risks were observed for hematocrit-corrected blood lead. Similar patterns were seen for hemoglobin-corrected blood lead (models B2, B3, and B6). Neither of the 2 previous NHANES III studies on lead-mortality association adjusted for cadmium or iron.2,3 Our analysis is adjusted crudely for exposure to tobacco smoke by a 3-category smoking status variable, and so the observed blood cadmium relative risks should be interpreted to represent a mixture of presumed effects of nontobacco sources of cadmium exposure and smoking intensity within former and current smokers.
Iron deficiency is known to cause increased absorption of lead,29 and iron deficiency and anemia (often induced by iron deficiency) are risk factors for CVD mortality.4,30 Preferred biomarkers of iron status such as ferritin, soluble transferrin receptor, and body iron31 were not measured in some of the NHANES cycles studied. Consequently, we used serum iron, although it has a known limitation of being influenced by inflammation (serum iron decreases in the presence of inflammation).32 In order to keep the serum iron-CVD mortality association from reflecting the direct inflammation-CVD mortality association not mediated through serum iron, we examined a marker of inflammation, serum C-reactive protein. The observed change-in-estimate patterns for the blood lead relative risk as well as associations between serum iron and C-reactive protein indicate that C-reactive protein was not operating as a strong confounder in the lead-CVD mortality association and the lead-CVD mortality association was not mediated through inflammation as represented by C-reactive protein.
Serum calcium also was suspected to be a potential confounder for the lead-CVD mortality association based on previous findings. Investigations of the association between serum calcium and whole blood lead have produced mixed results, and the reported positive associations could have arisen from confounding due to factors such as socioeconomic status.33 On the other hand, most, if not all, recent studies have reported positive associations between serum calcium and CVD risk.34 In the current study, extremely low and high serum calcium levels were associated with slightly higher hematocrit-corrected blood lead (eFigure 1, Supplemental Digital Content) and with higher CVD mortality (Fig. 1), showing different patterns from the monotonic relationship seen in other studies.34 Nonetheless, the small changes in the blood lead relative risks after removing serum calcium from the fully adjusted models indicated that serum calcium was not operating as a strong confounder in the lead-CVD mortality association. We also examined BMD, a proxy for long-term calcium status. The relative risks for blood lead from the models with the BMD data (models A8 and B8) did not deviate appreciably from relative risks estimated in the fully adjusted models (A1 and B1), indicating that BMD was not a strong confounder for lead-CVD mortality association. Higher BMD was associated with lower CVD mortality, showing consistency with previously published results.35 Lead exposure could adversely affect BMD.36 Therefore, BMD may operate as a variable in causal pathway, and adjustment for BMD may induce bias toward the null. However, there was little indication of BMD operating as a variable in causal pathway as the observed blood lead relative risks from models A8 and B8 were not shifted toward the null compared to models A2 and B2.
Our analysis contributes to the understanding of the effects of blood lead levels less than 10 μg/dL on CVD. Correcting blood lead for hematocrit or hemoglobin resulted in the upward shifts in the relative risks. Adjusting blood lead for hematocrit or hemoglobin, on the other hand, yielded attenuated relative risks. There was little statistical evidence for nonlinearity in the lead-CVD mortality association, thus the estimates of relative risk can be used for a direct, simple estimation of mortality reduction associated with a specific degree of hypothetical reduction in blood lead. Results obtained with varying degrees of adjustment indicated that adjustments for cadmium exposure and iron status help avoid overestimating the effects of lead while results obtained with correction, adjustment, or neither for a red blood cell concentration measure (hematocrit or hemoglobin) indicated that the correction is justified and helps avoid underestimating the effects of lead.
Supplementary Material
Acknowledgments
The findings and conclusions in this article are those of the authors and do not necessarily represent the views of the Centers for Disease Control or the U.S. Environmental Protection Agency. The authors thank Dr Anne Looker at NCHS for thoughtful guidance on biomarkers of iron and calcium.
Footnotes
Abbreviations: BMD = bone mineral density, CVD = cardiovascular disease, NHANES = National Health and Nutrition Examination Survey.
The authors have no funding and conflicts of interest to disclose.
REFERENCES
- 1.ATSDR. Toxicological Profile for Lead. http://www.atsdr.cdc.gov/toxprofiles/tp13.pdf. Published August, 2007. Accessed November 14, 2014. [Google Scholar]
- 2.Schober SE, Mirel LB, Graubard BI, et al. Blood lead levels and death from all causes, cardiovascular disease, and cancer: results from the NHANES III mortality study. Environ Health Perspect 2006; 114:1538–1541. [DOI] [PMC free article] [PubMed] [Google Scholar]
- 3.Menke A, Muntner P, Batuman V, et al. Blood lead below 0.48 micromol/L (10 microg/dL) and mortality among US adults. Circulation 2006; 114:1388–1394. [DOI] [PubMed] [Google Scholar]
- 4.Sarnak MJ, Tighiouart H, Manjunath G, et al. Anemia as a risk factor for cardiovascular disease in The Atherosclerosis Risk in Communities (ARIC) study. J Am Coll Cardiol 2002; 40:27–33. [DOI] [PubMed] [Google Scholar]
- 5.deSilva PE. Blood lead levels and the haematocrit correction. Ann Occup Hygiene 1984; 28:417–428. [DOI] [PubMed] [Google Scholar]
- 6.Murphy SL, Xu J, Kochanek KD. Deaths: final data for 2010. National vital statistics reports: from the Centers for Disease Control and Prevention, National Center for Health Statistics. Natl Vital Stat Syst 2013; 61:1–117. [PubMed] [Google Scholar]
- 7.National Toxicology, Program. NTP monograph: health effects of low-level lead. NTP Monogr 2012. i–i148. [PubMed] [Google Scholar]
- 8.U.S. EPA. 2013 Final Report: Integrated Science Assessment for Lead. U.S. Environmental Protection Agency, Washington, DC, EPA/600/R-10/075F. http://ofmpub.epa.gov/eims/eimscomm.getfile?p_download_id=518908. Published June, 2013. Accessed November 14, 2014. [Google Scholar]
- 9.CDC. NCHS Data Linked to Mortality Files. http://www.cdc.gov/nchs/data_access/data_linkage/mortality.htm Accessed November 4, 2014. [Google Scholar]
- 10.CDC. NHANES Response Rates and Population Totals. http://www.cdc.gov/nchs/nhanes/response_rates_CPS.htm Accessed June 15, 2015. [Google Scholar]
- 11.National Committee for Clinical Laboratory Standards. Procedure for determining packed cell volume by the micro hematocrit method (NCCLS document H7-A). Villanova, PA, 1985. [Google Scholar]
- 12.National Committee for Clinical Laboratory Standards. Reference procedure for the quantitative determination of hemoglobin in blood (NCCLS document H15-A). Villanova, PA, 1984. [Google Scholar]
- 13.Miller DT, Paschal DC, Gunter EW, et al. Determination of lead in blood using electrothermal atomisation atomic absorption spectrometry with a L’vov platform and matrix modifier. Analyst 1987; 112:1701–1704. [DOI] [PubMed] [Google Scholar]
- 14.Parsons PJ, Slavin W. A rapid Zeeman graphite-furnace atomic-absorption spectrometric method for the determination of lead in blood. Spectroc Acta Pt B-Atom Spectr [Article] 1993; 48:925–939. [Google Scholar]
- 15.Stoeppler M, Brandt K. Contributions to automated trace analysis Part V. determination of cadmium in whole-blood and urine by electrothermal atomic-absorption spectrophotometry. Fresenius Zeitschrift Fur Analytische Chemie 1980; 300:372–380. [Google Scholar]
- 16.Date AR, Gray AL. Applications of Inductively Coupled Plasma Mass Spectrometry. New York, NY: Chapman and Hall; 1989. [Google Scholar]
- 17.CDC. 2009–2010 Data Documentation, Codebook, and Frequencies Standard Biochemistry Profile (BIOPRO_F). http://wwwn.cdc.gov/nchs/nhanes/2009-2010/BIOPRO_F.htm Accessed December 14, 2014. [Google Scholar]
- 18.Sarkar BC, Chauhan UP. A new method for determining micro quantities of calcium in biological materials. Anal Biochem 1967; 20:155–166. [DOI] [PubMed] [Google Scholar]
- 19.Baginski ES, Marie SS, Clark WL, et al. Direct microdetermination of serum calcium. Clin Chim Acta 1973; 46:49–54. [DOI] [PubMed] [Google Scholar]
- 20.CDC. NHANES Laboratory Data. http://wwwn.cdc.gov/nchs/nhanes/search/datapage.aspx?Component=Laboratory Accessed December 9, 2014. [Google Scholar]
- 21.Looker AC, Borrud LG, Hughes JP, Fan B, Shepherd JA, Sherman M. Total body bone area, bone mineral content, and bone mineral density for individuals aged 8 years and over: United States, 1999–2006. Vital and health statistics Series 11, Data from the national health survey. 2013:1–86. [PubMed] [Google Scholar]
- 22.Korn EL, Graubard BI, Midthune D. Time-to-event analysis of longitudinal follow-up of a survey: choice of the time-scale. Am J Epidemiol 1997; 145:72–80. [DOI] [PubMed] [Google Scholar]
- 23.Johnson CL, Paulose-Ram R, Ogden CL, et al. National health and nutrition examination survey: analytic guidelines, 1999–2010. Vital and Health Statistics Series 2, Data Evaluation and Methods Research. 2013, 161:1–24. [PubMed] [Google Scholar]
- 24.Stata Statistical Software [computer program]. Release 13. College Station, TX: StataCorp LP; 2013. [Google Scholar]
- 25.Blood lead levels – United States, 1999–2002. MMWR Morb Mortal Wkly Rep 2005; 54:513–516. [PubMed] [Google Scholar]
- 26.CDC. Blood lead levels States, 1988–1991. MMWR Morb Mortal Wkly Rep 1994; 43:545–548. [PubMed] [Google Scholar]
- 27.CDC. Fourth National Report on Human Exposure to Environmental Chemicals Updated Tables, August, 2014. http://www.cdc.gov/exposurereport/pdf/fourthreport_updatedtables_aug2014.pdf. Published August, 2014 Accessed December 9, 2014. [Google Scholar]
- 28.Hertz-Picciotto I, Croft J. Review of the relation between blood lead and blood pressure. Epidemiol Rev 1993; 15:352–373. [DOI] [PubMed] [Google Scholar]
- 29.Goyer RA. Toxic and essential metal interactions. Ann Rev Nutr 1997; 17:37–50. [DOI] [PubMed] [Google Scholar]
- 30.Corti MC, Guralnik JM, Salive ME, et al. Serum iron level, coronary artery disease, and all-cause mortality in older men and women. Am J Cardiol 1997; 79:120–127. [DOI] [PubMed] [Google Scholar]
- 31.CDC. Second National Report on Biochemical Indicators of Diet and Nutrition in the U.S. Population. http://www.cdc.gov/nutritionreport/pdf/Nutrition_Book_complete508_final.pdf. Published April, 2012. Accessed December 7, 2014. [DOI] [PMC free article] [PubMed] [Google Scholar]
- 32.Nemeth E, Ganz T. Regulation of iron metabolism by hepcidin. Ann Rev Nutr 2006; 26:323–342. [DOI] [PubMed] [Google Scholar]
- 33.Ballew C, Bowman B. Recommending calcium to reduce lead toxicity in children: a critical review. Nutr Rev 2001; 59 (3 Pt 1):71–79. [DOI] [PubMed] [Google Scholar]
- 34.Lutsey PL, Michos ED. Vitamin D, calcium, and atherosclerotic risk: evidence from serum levels and supplementation studies. Curr Atherosclerosis Rep 2013; 15:293. [DOI] [PMC free article] [PubMed] [Google Scholar]
- 35.Qu X, Huang X, Jin F, et al. Bone mineral density and all-cause, cardiovascular and stroke mortality: a meta-analysis of prospective cohort studies. Int J Cardiol 2013; 166:385–393. [DOI] [PubMed] [Google Scholar]
- 36.Wong AK, Beattie KA, Bhargava A, et al. Bone lead (Pb) content at the tibia is associated with thinner distal tibia cortices and lower volumetric bone density in postmenopausal women. Bone 2015; 79:58–64. [DOI] [PMC free article] [PubMed] [Google Scholar]
Associated Data
This section collects any data citations, data availability statements, or supplementary materials included in this article.