

Abstract
Background
Lean body mass (LBM) represents the “fat-free” muscle mass in hemodialysis (HD) patients and is an important nutritional measure. Previous studies have found that both higher LBM and body mass index (BMI) were related to greater survival in HD patients. Additional studies have shown differences in survival across racial-ethnic groups of HD patients. However, the association of LBM and mortality across racial-ethnic subgroups has not been examined.
Objective
We hypothesize that racial differences in LBM affect the mortality in HD patients.
Setting and Participants
chronic HD patients from a large dialysis organization in the US
Predictors
estimated LBM (eLBM), self-identified racial subgroups
Outcome variable
5 year survival
Study Design
We examined the association between baseline eLBM and survival using Cox proportional hazard models adjusted for demographics, comorbidities and laboratory measures. Associations were examined across subgroups of race-ethnicity (Non-Hispanic white, African American, and Hispanic) and BMI.
Results
The final cohort included 117,683 HD patients, who were 62±15 (mean ± SD) years old, 43% women and 59% with diabetes mellitus. Higher eLBM was linearly associated with lower mortality. Compared to the reference group (48.4–<50.5 kg), patients with the lowest eLBM (<41.3 kg) had a 1.4-fold higher risk of mortality (HR: 1.37, 95%CI: 1.30–1.44) in the fully adjusted model. A similar linear association was seen among patients with BMI <35 kg/m2 and in non-Hispanic whites and African American subgroups. However, higher eLBM was not associated with improved survival in Hispanic patients or patients with BMI ≥35 kg/m2.
Limitation
Potential Residual Confounding.
Conclusions
Higher eLBM is associated with a lower mortality risk in HD patients, especially among non-Hispanic white and African American groups. Hispanic patients do not demonstrate a similar inverse relationship. The association between LBM and mortality among different racial groups of HD patients deserves additional study.
Keywords: Race, ethnicity, mortality, lean body mass, hemodialysis
INTRODUCTION
In maintenance hemodialysis (HD) patients, higher body mass index (BMI) has been consistently shown to correlate with greater survival (1–4). But BMI per se is not an adequate indicator of body composition because it does not differentiate lean body mass (LBM) from body fat (5). LBM, on the other hand, as an indicator of muscle mass and somatic protein, is a significant clinical marker as it has been shown to be associated with better clinical outcomes in the general population (6). While previous studies (7, 8) have found that LBM was significantly lower in dialysis patients than in the general population, Beddhu et al., (9) suggested that the protective effect of high BMI in the maintenance HD population is mostly conferred to those patients with higher LBM and muscle mass. Huang et al., (10) reported that low mid-arm muscle circumference, a marker of LBM, was associated with higher all-cause mortality in maintenance HD patients.
LBM also differs across race and ethnicity. Noori et al., (11) found that in a 6-year contemporary cohort of 799 HD patients matched on age, sex and diabetes, African American HD patients exhibited higher measures of muscle mass and LBM. Among the US population, African Americans have lower life expectancy than non-Hispanic whites (12–14). However, in the chronic kidney disease (CKD) and end stage renal disease (ESRD) population, African American and Hispanic patients with ESRD have consistently greater survival, with crude death rates of 187 and 180 per 1000 patient-years at risk respectively, compared to 207 per 1000 patient-years at risk for non-Hispanic whites (15, 16). Streja et al., (17) further examined this racial paradox in HD patients and found that African American and Hispanic maintenance HD patients had better survival than non-Hispanic whites. However, after additional multivariable adjustment for surrogates of nutrition and inflammation, together known as the malnutrition-inflammation complex syndrome (MICS), African Americans had poorer survival than Hispanics or non-Hispanic whites. Ricks et al., (18) further examined differences in the association between BMI and mortality across racial-ethnic subgroups of HD patients. The study found that Hispanics and African-Americans conferred the greatest benefit in survival from higher BMI, further suggesting that better nutritional status explained the improved survival seen in these racial-ethnic subgroups of HD patients.
Although distributions of estimated lean body mass (eLBM), a marker of nutritional status, have been shown to differ across racial-ethnic subgroups in HD patients, the interaction between LBM and race/ethnicity and their roles in clinical outcomes in ESRD is unclear. We hypothesized that the association between LBM and survival in HD patients varied across subgroups of race and ethnicity.
MATERIALS AND METHODS
Patients
The study was approved by the institutional review committees of the XXX and XXX, Because of the large sample size, the anonymity of the patients studies, and the nonintrusive nature of the research, the study was exempt from the requirement of written consent.
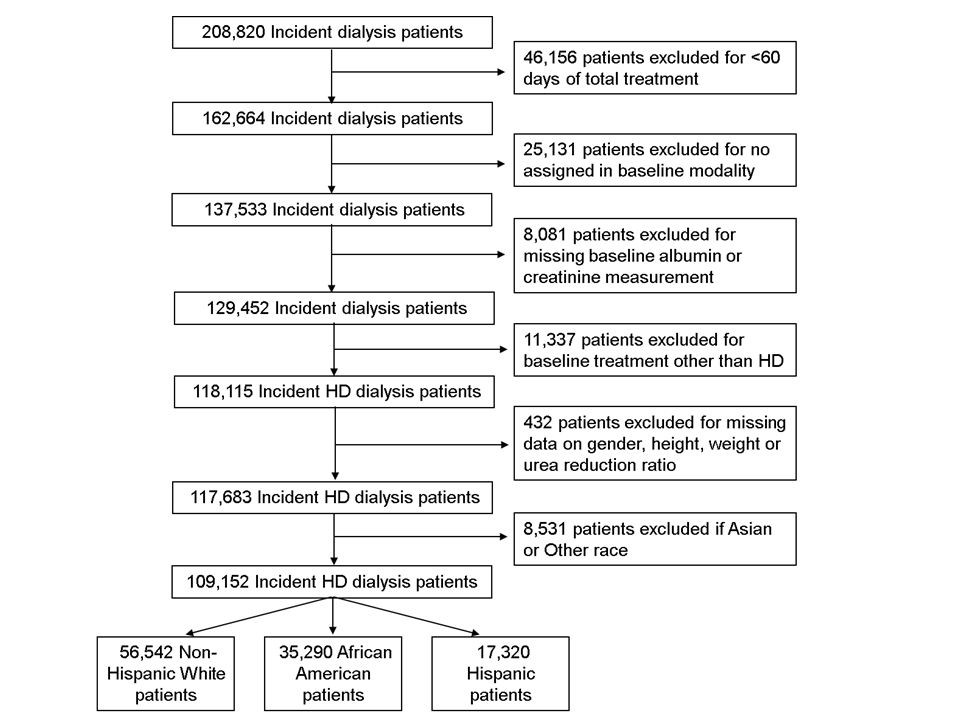
We extracted and examined data from a total of 208,820 patients with ESRD who initiated dialysis therapy from January 2007 to December 2011 in a large dialysis care organization in the United States. We excluded 46,156 patients in whom total dialysis treatment duration lasted less than 60 days, 25,131 patients who had missing baseline information on modality assignment, 8,081 patients missing baseline albumin or creatinine measurement and 11,337 who were treated with a modality other than thrice weekly in-center HD. We excluded 432 patients missing any information on the remaining variables in the eLBM equation; sex, height, weight or urea reduction ratio. The final study population consisted of 117,683 HD patients (Figure 1). There were no significant differences in demographics between the included and excluded HD patients. Patients were followed from date of dialysis initiation until death, renal transplantation, departure from XXX facilities, or end of the study period (December 31, 2011), whichever occurred first.
Figure 1.

Cohort Construction.
Demographic and Clinical Measures
Information on dialysis modality and treatment, body weight, demographics, laboratory values, and intravenous medications were obtained from the large dialysis care organization facilities. Data on comorbid conditions were obtained from ICD-9 codes and included: diabetes mellitus, hypertension, atherosclerotic heart disease, congestive heart failure, other cardiovascular diseases, cerebrovascular disease, chronic obstructive pulmonary disease, HIV, history of cancer, alcohol dependence and substance abuse.
Race and Ethnicity
The large dialysis care organization national database includes race and ethnicity for more than 98% of all patients. Race and ethnicity determination were based on the self-selection of the race and ethnicity with which they most closely identified, according to the definitions set forth by the US Census Bureau and the Federal Office of Management and Budget (19, 20). In our study, three mutually exclusive racial/ethnic categories (non-Hispanic whites, African Americans and Hispanics) were created. Other racial/ethnic groups, such as Asian or American Indians, were not included in these analyses because of small sample sizes.
Laboratory Values
In all large dialysis care organization clinics, blood samples were drawn using standardized techniques and were transported to a centralized laboratory in Deland, Florida, typically within 24 hours, where they were measured using automated and standardized methods. Serum creatinine, phosphorus, calcium, urea, albumin, bicarbonate and total iron binding capacity (TIBC) were measured monthly. Serum intact parathyroid hormone (PTH) and ferritin were measured at least quarterly. Hemoglobin was measured weekly to bi-weekly in most patients. Delivered dialysis dose was estimated by single-pooled Kt/V using the urea kinetic model. Post-HD body weight was measured to the nearest 0.1 kg on a GSE digital platform scale, model 350 (GSE Scale Systems, www.gseinc.com). Height was measured to the nearest 0.1 cm using a wall-mounted stadiometer (model S100; Ayrton Corp) with participants standing erect and arms hanging freely at their side. BMI was calculated as body weight in kilograms divided by height in meters squared (kg/m2). To minimize measurement variability, all repeated measures for each 91-day interval from date of dialysis initiation were averaged, and the summary estimates were reported and used in all models. Measurements during the first 91 days on dialysis were used as baseline values.
Although dual-energy X-ray absorptiometry (DEXA) is considered a reference method for assessing body composition (21–23), few dialysis clinics have direct access to DEXA machines. Thus, we used a validated creatinine-based formula to estimate LBM in all HD patients (24). The formula is as follows: estimated LBM (kg) = 0.34*Serum Creatinine (mg/dl) + 5.58*sex (1 if female; 0 if male) + 0.30*weight (kg) +0.67*height (inch)-0.23*URR (URR, urea reduction ratio)-5.75. We divided eLBM into 10 categories (<41.3, 41.3–<44.1, 44.1–<46.4, 46.4–<48.4, 48.4–< 50.5, 50.5–< 52.7, 52.7–< 55.2, 55.2–< 58.4, 58.4–<63.2 and ≥63.2 kg) based on each 10th percentile of baseline HD patients’ values. Patients with eLBM level of 48.4–< 50.5 kg were defined as the reference group.
Statistical Methods
Descriptive data were summarized using proportions, mean (±standard deviation, SD) and median (interquartile range, IQR) as appropriate, and were compared across eLBM groups using test for trend analyses. Correlation between eLBM and BMI was examined using Pearson correlation.
We analyzed the relationship between all-cause mortality and eLBM using Cox proportional hazard models. Three levels of adjustment were examined: 1) unadjusted models that included eLBM, the main predictor variable, and patient calendar quarter of entry; 2) case-mix adjusted models that included covariates in model 1 and age, sex, race/ethnicity (non-Hispanic white, African American, Hispanic, Asian, Other), comorbidities previously listed, primary insurance and delivered dialysis dose; and 3) case-mix plus MICS adjusted models which included all of the covariates in model 2 as well as 13-surrogates of nutritional and inflammatory status: hemoglobin, serum levels of albumin, potassium, calcium, phosphorus, PTH, iron saturation ratio (ISAT), TIBC, ferritin, bicarbonate, peripheral white blood cell count (WBC), lymphocyte percentage and normalized protein catabolic rate (nPCR).
Additionally, associations of eLBM with all-cause mortality were examined across racial-ethnic subgroups (non-Hispanic white, African American, Hispanic), BMI categories (<22, 22–<25, 25–<30, 30–<35 and ≥35 kg/m2), age at dialysis initiation (<65, ≥65 years), residual renal function (<3.0, ≥ 3.0 mL/min/1.73 m2) and race and sex adjusted height tertiles.
Missing covariate data (<2% for most laboratory and demographic variables) were imputed using the mean or median of existing values. Plots of log [-log (survival rate)] against log (survival time) were used to check the proportionality assumption. All analyses were carried out with SAS version 9.4 (SAS Institute, Inc., Cary, North Carolina).
RESULTS
Baseline demographics and clinical characteristics according to eLBM
The cohort included 117,683 incident HD patients. Baseline characteristics stratified by each eLBM category are presented in Table 1. The mean (± SD) age was 62±15 years old. At baseline, 59% of patients had diabetes mellitus and 52% had hypertension. The mean eLBM in was 51.6±8.9 kg (Median [IQR]: 50.5[45.3–56.7] kg). Patients with higher eLBM levels tended to be younger and male, have higher body weight, BMI, serum levels of creatinine, phosphorus, PTH and a higher prevalence of diabetes mellitus and congestive heart failure.
Table 1.
Baseline characteristics stratified by groups of estimated Lean Body Mass (eLBM) in 117,683 HD patients
| Estimate Lean Body Mass Group | ||||||||||||
|---|---|---|---|---|---|---|---|---|---|---|---|---|
|
| ||||||||||||
| Variables | Total | <41.3 | 41.3–<44.1 | 44.1–<46.4 | 46.4–<48.4 | 48.4–<50.5 | 50.5–<52.7 | 52.7–<55.2 | 55.2–<58.4 | 58.4–<63.2 | ≥63.2 | P value |
| N | 117,683 | 11,768 | 11,768 | 11,768 | 11,769 | 11,769 | 11,767 | 11,770 | 11,768 | 11,767 | 11,769 | |
| Age (years) | 62±15 | 67± 16 | 66 ±16 | 65±16 | 64 ±15 | 64±15 | 63±15 | 61 ±14 | 60 ±14 | 58±13 | 54 ±12 | <.0001 |
| Female (%) | 43 | 59 | 53 | 48 | 45 | 41 | 40 | 38 | 38 | 37 | 36 | <.0001 |
| Race/Ethnicity (%) | ||||||||||||
| Non-Hispanic White | 48 | 40 | 45 | 47 | 48 | 50 | 51 | 50 | 50 | 51 | 49 | <.0001 |
| African American | 30 | 18 | 22 | 25 | 27 | 29 | 31 | 33 | 36 | 38 | 41 | <.0001 |
| Hispanic | 15 | 25 | 21 | 19 | 17 | 15 | 14 | 12 | 10 | 8 | 6 | <.0001 |
| Asian | 3 | 12 | 7 | 4 | 3 | 2 | 2 | 1 | 1 | 1 | 0 | <.0001 |
| Other | 4 | 5 | 4 | 4 | 4 | 3 | 3 | 3 | 3 | 3 | 3 | <.0001 |
| Insurance (%) | ||||||||||||
| Medicare | 53 | 57 | 57 | 56 | 56 | 55 | 53 | 52 | 50 | 48 | 45 | <.0001 |
| Medicaid | 7 | 9 | 8 | 7 | 7 | 6 | 6 | 6 | 6 | 6 | 7 | 0.0251 |
| Other | 40 | 34 | 35 | 37 | 37 | 39 | 41 | 42 | 43 | 46 | 48 | <.0001 |
| Access (%) | ||||||||||||
| CVC | 78 | 81 | 79 | 78 | 78 | 78 | 78 | 78 | 78 | 77 | 77 | <.0001 |
| AV Fistula | 15 | 10 | 13 | 14 | 15 | 15 | 16 | 16 | 16 | 17 | 17 | <.0001 |
| AV Graft | 4 | 5 | 5 | 5 | 4 | 4 | 4 | 4 | 4 | 3 | 3 | <.0001 |
| AV Other | <1 | <1 | <1 | <1 | <1 | <1 | <1 | <1 | <1 | <1 | <1 | 0.4865 |
| Unknown | 3 | 3 | 3 | 3 | 3 | 3 | 3 | 3 | 3 | 3 | 3 | 0.5548 |
| Weight (kg) | 80.3±22.6 | 52.1±7.4 | 59.9±6.5 | 65.0±6.6 | 69.4±6.6 | 74.1±6.8 | 79.0±7.2 | 84.6±7.3 | 91.6±7.7 | 101.4±8.6 | 125.9±18.8 | <.0001 |
| Body Mass Index (kg/m2) | 28.2±7.3 | 21.7±4.4 | 23.1±3.9 | 24.2±4.0 | 25.1±4.1 | 26.2±4.3 | 27.5±4.7 | 28.9±5.0 | 30.9±5.3 | 33.5±5.8 | 40.3±8.0 | <.0001 |
| eLBM (kg) | 51.6±8.9 | 38.4±2.5 | 42.8±0.8 | 45.3±0.7 | 47.4±0.6 | 49.5±0.6 | 51.6±0.6 | 53.9±0.7 | 56.7±0.9 | 60.5±1.4 | 69.4±5.9 | <.0001 |
| Comorbidities (%) | ||||||||||||
| Diabetes (%) | 59 | 50 | 53 | 55 | 56 | 59 | 60 | 62 | 63 | 65 | 67 | <.0001 |
| Atherosclerotic Disease | 15 | 14 | 15 | 16 | 16 | 16 | 15 | 16 | 16 | 15 | 15 | 0.3662 |
| Congestive Heart Failure | 38 | 31 | 33 | 34 | 35 | 35 | 37 | 39 | 40 | 43 | 48 | <.0001 |
| Hypertension | 52 | 53 | 54 | 54 | 53 | 52 | 51 | 51 | 51 | 50 | 50 | <.0001 |
| Other Cardiovascular Diseases | 16 | 14 | 15 | 16 | 16 | 17 | 16 | 16 | 16 | 15 | 16 | 0.0117 |
| Cerebrovascular Disease | 2 | 2 | 2 | 2 | 2 | 2 | 2 | 2 | 2 | 1 | 1 | 0.0005 |
| Chronic Obstructive Pulmonary Disease | 5 | 5 | 5 | 5 | 5 | 5 | 5 | 5 | 5 | 5 | 6 | <.0001 |
| History of cancer | 2 | 2 | 2 | 3 | 2 | 3 | 3 | 2 | 2 | 2 | 2 | 0.0011 |
| Substance Abuse | 0.2 | 0.2 | 0.3 | 0.3 | 0.2 | 0.2 | 0.2 | 0.3 | 0.2 | 0.3 | 0.1 | 0.496 |
| Alcohol Dependence | 0.2 | 0.3 | 0.3 | 0.3 | 0.3 | 0.2 | 0.2 | 0.2 | 0.2 | 0.1 | 0.2 | 0.0009 |
| HIV | 0.5 | 0.5 | 0.5 | 0.5 | 0.6 | 0.6 | 0.5 | 0.5 | 0.5 | 0.4 | 0.3 | 0.0585 |
| Laboratory values | ||||||||||||
| Calcium (mg/dl) | 8.7±0.6 | 8.6±0.7 | 8.7±0.6 | 8.7±0.6 | 8.7±0.6 | 8.7±0.6 | 8.7±0.6 | 8.7±0.6 | 8.7±0.6 | 8.7±0.6 | 8.7±0.6 | 0.0002 |
| Phosphorus (mg/dl) | 4.9±1.2 | 4.7±1.1 | 4.8±1.1 | 4.8±1.1 | 4.9±1.1 | 4.9±1.2 | 4.9±1.2 | 5.0±1.2 | 5.0±1.2 | 5.1±1.2 | 5.2±1.2 | <.0001 |
| Intact Parathyroid Hormone (pg/dl) | 312[197,483] | 264[161,415] | 282[177,432] | 291[180,449] | 295[189,455] | 305[195,466] | 310[201,477] | 325[209,498] | 335[213,516] | 352[224,535] | 381[241,582] | <.0001 |
| Ferritin (ng/mL) | 281[163,482] | 365[208,625] | 314[182,545] | 312[179,534] | 294[170,500] | 281[161,488] | 275[162,460] | 267[157,458] | 256[150,432] | 248[147,413] | 234[140,387] | <.0001 |
| White Blood Cell Count (×103/μL) | 7.8±2.7 | 7.9±2.8 | 7.8±2.7 | 7.8±2.7 | 7.8±2.6 | 7.7±2.9 | 7.8±2.8 | 7.8±2.7 | 7.7±2.5 | 7.9±2.5 | 8.1±2.4 | 0.0167 |
| Hemoglobin (g/dl) | 11.1±1.2 | 11.2±1.2 | 11.2±1.2 | 11.2±1.2 | 11.2±1.2 | 11.2±1.2 | 11.1±1.2 | 11.1±1.2 | 11.1±1.2 | 11.1±1.2 | 11.0±1.2 | <.0001 |
| Residual Renal Function (ml/min) | 4.4±3.6 | 3.3±3.1 | 3.5±2.7 | 3.7±2.8 | 3.9±3.3 | 4.2±3.2 | 4.2±3.1 | 4.5±3.3 | 4.7±3.7 | 5.0±4.0 | 5.7±4.5 | <.0001 |
| Single Pool Kt/V | 1.5±0.3 | 1.8±0.3 | 1.6±0.3 | 1.6±0.3 | 1.5±0.3 | 1.5±0.3 | 1.4±0.3 | 1.4±0.3 | 1.4±0.3 | 1.3±0.3 | 1.2±0.3 | <.0001 |
| Urea Reduction Ratio (%) | 68.3±7.4 | 76.3±5.2 | 73.4±5.2 | 71.8±5.2 | 70.2±5.4 | 68.9±5.6 | 67.7±5.7 | 66.5±5.8 | 65.1±6.0 | 63.4±6.2 | 59.9±6.8 | <.0001 |
| Albumin (g/dl) | 3.5±0.5 | 3.4±0.5 | 3.5±0.5 | 3.5±0.5 | 3.5±0.5 | 3.5±0.5 | 3.5±0.5 | 3.5±0.5 | 3.6±0.5 | 3.6±0.5 | 3.6±0.6 | <.0001 |
| Bicarbonate (mEq/l) | 23.6±2.7 | 23.6±2.8 | 23.5±2.8 | 23.6±2.7 | 23.6±2.7 | 23.6±2.7 | 23.6±2.7 | 23.5±2.7 | 23.5±2.7 | 23.5±2.6 | 23.4±2.6 | 0.0096 |
| Creatinine (mg/dl) | 5.9±2.4 | 5.0±1.9 | 5.4±2.1 | 5.6±2.1 | 5.7±2.2 | 5.8±2.3 | 5.9±2.3 | 6.1±2.5 | 6.3±2.5 | 6.4±2.7 | 6.6±2.8 | <.0001 |
| nPCR (g/Kg/day) | 0.8±0.2 | 0.8±0.2 | 0.8±0.2 | 0.8±0.2 | 0.8±0.2 | 0.8±0.2 | 0.8±0.2 | 0.8±0.2 | 0.8±0.2 | 0.8±0.2 | 0.8±0.2 | <.0001 |
| Potassium (mg/dl) | 4.4±0.5 | 4.4±0.5 | 4.4±0.5 | 4.4±0.5 | 4.4±0.5 | 4.4±0.5 | 4.4±0.5 | 4.4±0.5 | 4.4±0.5 | 4.4±0.5 | 4.4±0.5 | 0.1669 |
| ISAT (%) | 23.1±9.0 | 24.8±10.2 | 24.1±9.5 | 24.0±9.6 | 23.4±9.1 | 23.3±9.2 | 23.0±9.1 | 22.7±8.9 | 22.3±8.3 | 22.0±8.2 | 21.3±7.7 | <.0001 |
| TIBC (μg/dl) | 225.7±48.9 | 213.2±48.1 | 218.4±47.7 | 220.7±47.9 | 222.3±48.7 | 224.8±48.5 | 225.6±48.3 | 228.7±48.4 | 231.5±48.5 | 234.1±48.3 | 238.2±49.3 | <.0001 |
| Lymphocytes (%) | 20.7±7.5 | 20.0±7.5 | 20.4±7.5 | 20.5±7.4 | 20.7±7.6 | 20.8±7.7 | 20.6±7.6 | 20.8±7.5 | 21.0±7.4 | 20.9±7.4 | 21.0±7.3 | 0.0003 |
Note: Categorical variables are presented as percentages; continuous variables as mean (standard deviation) or median (interquartile range).
Abbreviations: eLBM, estimated lean body mass; nPCR, normalized protein catabolic rate; ISAT, iron saturation ratio; TIBC, total iron-binding capacity
Baseline demographics and clinical characteristics according to race
After excluding Asian or Other races, our cohort included 109,152 patients, which was composed of 56,542 non-Hispanic white, 35,290 African American and 17,320 Hispanic HD patients, with mean (± SD) age of 66±14, 58±15, and 59±15 years old, respectively. The baseline demographic and clinical characteristics are presented in Table 2. The African American and Hispanic patients were younger than the non-Hispanic white patients, and the African American group had higher body weight, BMI, eLBM, serum levels of ferritin, PTH and creatinine, as well as a higher prevalence of hypertension.
Table 2.
Baseline characteristics stratified by race/ethnicity in 109,152 HD patients
| Race/Ethnicity | ||||
|---|---|---|---|---|
|
| ||||
| Variables | Total w/Known Race | Non-Hispanic White | African American | Hispanic |
| N | 109,152 | 56,542 | 35,290 | 17,320 |
| Age (years) | 62±15 | 66±14 | 58±15 | 59±15 |
| Female (%) | 43 | 41 | 48 | 42 |
| Insurance (%) | ||||
| Medicare | 53 | 58 | 50 | 45 |
| Medicaid | 7 | 4 | 7 | 14 |
| Other | 40 | 38 | 43 | 41 |
| Access (%) | ||||
| CVC | 78 | 77 | 78 | 82 |
| AV Fistula | 15 | 17 | 13 | 13 |
| AV Graft | 4 | 3 | 6 | 3 |
| AV Other | <1 | <1 | <1 | <1 |
| Unknown | 3 | 3 | 3 | 3 |
| Weight (kg) | 81.0±22.6 | 81.7±22.6 | 83.3±23.6 | 74.2±18.9 |
| Body Mass Index (kg/m2) | 28.3±7.4 | 28.1±7.3 | 28.7±7.9 | 27.5±6.4 |
| eLBM (kg) | 51.9±8.9 | 52.0±8.7 | 53.6±9.1 | 48.3±7.7 |
| Comorbidities (%) | ||||
| Diabetes (%) | 59 | 56 | 58 | 69 |
| Atherosclerotic Disease | 15 | 18 | 14 | 13 |
| Congestive Heart Failure | 38 | 38 | 37 | 38 |
| Hypertension | 52 | 49 | 62 | 45 |
| Other Cardiovascular Diseases | 16 | 19 | 14 | 12 |
| Cerebrovascular Disease | 2 | 2 | 2 | 1 |
| Chronic Obstructive Pulmonary Disease | 5 | 7 | 5 | 3 |
| History of cancer | 2 | 3 | 2 | 1 |
| Substance Abuse | 0.2 | 0.1 | 0.5 | 0.1 |
| Alcohol Dependence | 0.2 | 0.2 | 0.3 | 0.2 |
| HIV | 0.5 | 0.2 | 1 | 0.2 |
| Laboratory values | ||||
| Calcium (mg/dl) | 8.7±0.6 | 8.7±0.6 | 8.7±0.6 | 8.5±0.6 |
| Phosphorus (mg/dl) | 4.9±1.2 | 4.9±1.2 | 4.9±1.1 | 5.1±1.2 |
| Intact Parathyroid Hormone (pg/dl) | 313[196,486] | 264[165,403] | 405[261,616] | 330[217,486] |
| Ferritin (ng/mL) | 278[162,477] | 275[162,469] | 294[169,509] | 259[151,438] |
| White Blood Cell Count (×103/μL) | 7.8±2.7 | 8.0±2.8 | 7.4±2.5 | 7.8±2.3 |
| Hemoglobin (g/dl) | 11.1±1.2 | 11.2±1.2 | 10.9±1.2 | 11.3±1.1 |
| Residual Renal Function (ml/min) | 4.4±3.6 | 4.6±3.6 | 4.1±3.6 | 4.1±3.5 |
| Single Pool Kt/V | 1.5±0.3 | 1.5±0.4 | 1.4±0.3 | 1.5±0.3 |
| Urea Reduction Ratio (%) | 68.2±7.4 | 68.2±7.4 | 67.5±7.4 | 69.4±7.0 |
| Albumin (g/dl) | 3.5±0.5 | 3.5±0.5 | 3.5±0.5 | 3.5±0.5 |
| Bicarbonate (mEq/l) | 23.6±2.7 | 23.6±2.7 | 23.8±2.6 | 23.1±2.7 |
| Creatinine (mg/dl) | 5.9±2.4 | 5.2±2.0 | 6.7±2.6 | 6.2±2.5 |
| nPCR (g/Kg/day) | 0.8±0.2 | 0.8±0.2 | 0.8±0.2 | 0.8±0.2 |
| Potassium (mg/dl) | 4.4±0.5 | 4.4±0.5 | 4.3±0.5 | 4.6±0.5 |
| ISAT (%) | 23.0±9.0 | 22.9±9.2 | 23.1±9.0 | 23.4±8.7 |
| TIBC (μg/dl) | 225.7±49.0 | 228.6±50.7 | 220.4±47.0 | 227.0±46.5 |
| Lymphocytes (%) | 20.7±7.6 | 19.1±7.3 | 22.9±7.7 | 21.2±6.7 |
Note: Categorical variables are presented as percentages; continuous variables as mean (standard deviation) or median (interquartile range).
Abbreviations: eLBM, estimated lean body mass; nPCR, normalized protein catabolic rate; ISAT, iron saturation ratio; TIBC, total iron-binding capacity.
The distribution of baseline eLBM differed across racial/ethnic groups (p<0.0001) and is presented in Figure 2. Among the three groups, African Americans had the highest mean eLBM (53.6±9.1 kg) and BMI (28.7 ±7.9 kg/m2) while the Hispanics had the lowest eLBM (48.3.4±7.7 kg) and BMI (27.5±6.4 kg/m2) (Table 2, Figure 2).
Figure 2.

Distribution of Estimated LBM in 117,683 HD patients and Non-Hispanic White (n=56,542), African American (n=35,290) and Hispanic (n=17,320) HD patients over 5 years (1/2007–12/2011).
Mortality outcome according to eLBM
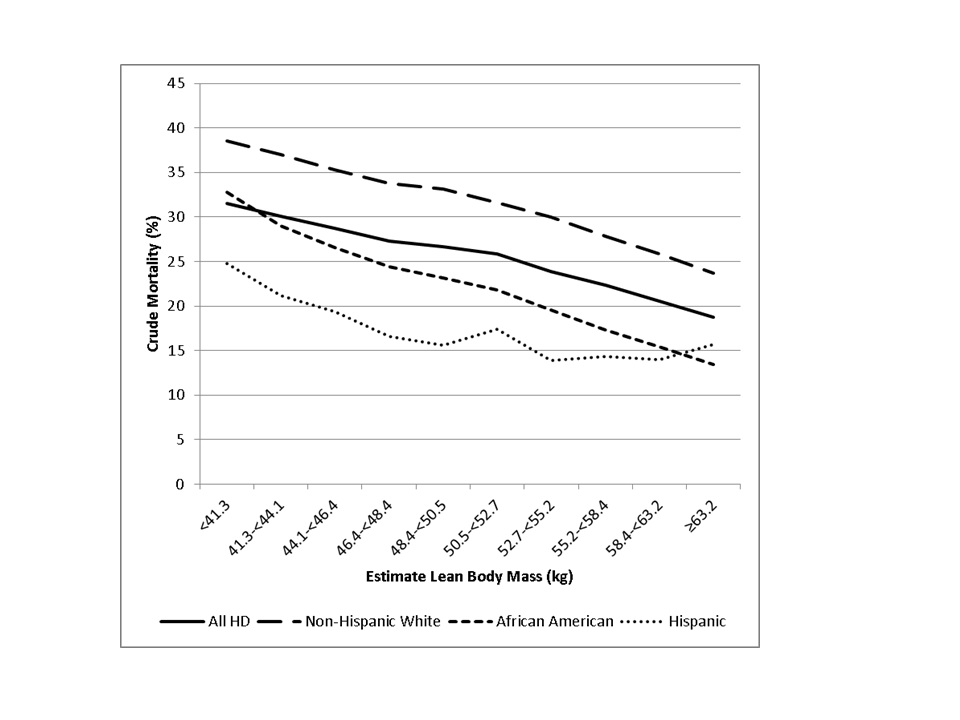
In the unadjusted model, higher eLBM was linearly associated with better survival (Figure 3, Supplement Table 1). This relationship remained robust after further adjustment in subsequent models. In the fully adjusted model, compared to the reference group (eLBM 48.4–<50.5 kg), patients in the lowest eLBM group had a 37% increased risk of crude mortality (HR: 1.37, 95%CI: 1.30–1.44), and patients with the highest eLBM had 17% lower death risk (HR: 0.83, 95%CI: 0.79–0.88).
Figure 3.

Crude mortality (%) per each estimated Lean Body Mass category in All (n=117,683), Non-Hispanic White (n=56,542), African American (n=35,290), and Hispanic (n=17,320) HD patients
Racial differences among mortality outcome
Associations between eLBM and mortality differed across racial-ethnic groups. The interaction between eLBM and racial groups was significant in the fully adjusted model (p-interaction <.0001). Hispanic patients had lowest crude mortality rate across all eLBM strata (Supplemental Tables 2–4). In the unadjusted model, both non-Hispanic white and African American patients had a linear inverse relationship between eLBM and mortality. Compared to the reference group, non-Hispanic white and African American patients with the lowest eLBM (<41.3 kg) had a 1.3-fold (HR: 1.33, 95%CI: 1.25–1.42) and 1.7-fold (HR: 1.72, 95%CI: 1.55–1.90) higher mortality risk respectively. In non-Hispanic whites and African Americans, patients in the highest eLBM groups had a 35% (HR: 0.65, 95%CI: 0.60–0.69) and 47% lower death risk (HR: 0.53, 95%CI: 0.47–0.58) respectively, in comparison to the reference group (Figure 4). After adjustment for case-mix and surrogate markers of malnutrition and inflammation, the linear and inverse relationship between mortality and eLBM remained robust among non-Hispanic white and African American HD patients.
Figure 4.

Association of Estimated LBM with 5 year all-cause mortality in 117,683 HD patients and in subgroups of Non-Hispanic White (n=56,542), African American (n=35,290) and Hispanic (n=17,320) HD patients*.
The X-axis presented on a logarithmic-scale. Data adjusted for case-mix and MICS covariates (see text for covariate list). The reference group is eLBM 48.4–<50.5 kg.
The linear relationship was not as evident among Hispanic patients. Among Hispanic patients, the lower eLBM groups were inversely associated with higher mortality across all models (Figure 4). Conversely, an eLBM ≥63.2 kg in Hispanic patients also had a significantly higher risk of death (HR: 1.50, 95% CI: 1.20–1.87) in fully adjusted models. The eLBM-mortality associations across racial-ethnic strata showed similar results when deciles of eLBM according to the distribution of eLBM in each racial-ethnic group were used (Supplemental Figure 1).
BMI differences among mortality outcome
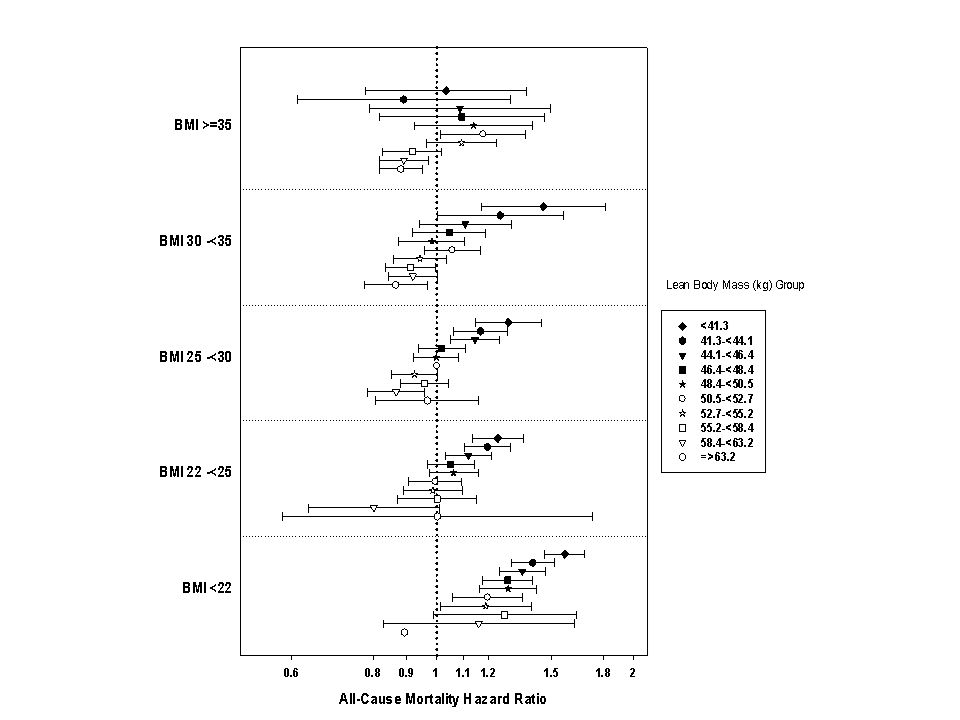
Associations between eLBM and mortality also differed across strata of baseline BMI (p-interaction <0.0001). Patients with a baseline BMI <35 kg/m2 exhibited a similar linear inverse relationship as seen in the total cohort (Figure 5). However, patients with a BMI ≥35 kg/m2 had a lower risk of mortality compared to the referent groups in both very high and very low eLBM, albeit not significant in the latter group. When all patients with various combined BMI and eLBM levels were compared to those who had a BMI 25–<30 kg/m2 and eLBM 50.5–<52.7 kg, we found similar results, but additionally found that almost all patients with BMI<22, regardless of eLBM decile, had a comparatively higher risk of mortality (Supplemental Figure 2).
Figure 5.

Association of Estimated LBM with 5 year all-cause mortality in 117,683 HD patients according to categories of BMI**.
The X-axis is presented on a logarithmic scale. Data adjusted for case-mix and MICS covariates (see text for covariate list). A very small number of patients were included in the BMI<22 kg/m2 and eLBM ≥63.2 kg groups, thus confident intervals were very wide and not presented.
In sensitivity analysis, we also examined eLBM-mortality associations across strata of age (<65 and ≥65 years), baseline residual renal function (RRF <3.0 and ≥3.0 ml/min/1.73m2), and race-sex adjusted tertiles of height. Our results for each stratum showed a linear inverse relationship, similar to the overall cohort and no significant differences across strata (Supplemental Figures 3 and 4).
DISCUSSION
In a contemporary cohort of 117,683 adult HD patients composed from a diverse racial/ethnic population, we found an inverse relationship between eLBM and mortality in the ESRD population. The highest eLBM group was associated with greatest survival, while the lowest eLBM group had the highest mortality risk. This relationship was also seen in African American and non-Hispanic white patients and patients with a baseline BMI <35 kg/m2. However, this inverse-linear association was not seen among the Hispanic patients and patients with BMI ≥35 kg/m2 after full adjustment for case mix covariates as well as nutritional and inflammatory markers. Our findings present an important observation in the role of lean muscle mass in the obesity paradox among HD patients and provide insight into racial/ethnic differences in the survival of ESRD patients.
LBM is a reliable indicator of muscle mass and somatic protein mass. Previous studies (7, 8) have found that LBM was significantly lower in dialysis patients than in the general population, likely because protein-energy wasting (PEW) is highly prevalent among HD patients (25, 26). As protein nutritional status is determined by visceral and somatic protein stores (27), and evaluation of muscle mass is an important method to assess protein nutritional status (1, 28–31), LBM can be a crucial and useful marker of nutritional assessment in HD patients (27). Several studies (32–34) have underlined the prognostic significance of PEW as a strong predictor of morbidity and mortality independent of other risk factors in HD patients. In our study, HD patients with higher eLBM were more likely to have a higher level of BMI and serum creatinine, phosphorus and PTH and had better long term survival. Since serum creatinine has been used as a surrogate of muscle mass and several previous studies have shown that increased serum creatinine level among HD patients is associated with greater survival (11, 30, 35, 36), our study is supportive of the relationship between LBM and survival. Furthermore, a combination of low serum phosphorus and low PTH levels likely reflect PEW and inflammation (37, 38). Thus, in our cohort, HD patients with higher eLBM probably had better nutritional status and were at a lower inflammatory state, thus leading to better survival.
The linear inverse relationship between eLBM and survival parallels the epiphenomenon known as the obesity paradox. In contrast to the general population, HD patients with a lower BMI have a higher mortality, while patients with a higher BMI, reflecting overweight status or obesity, seem to have better survival. The obesity paradox has been observed in various large, nationally representative or international cohorts of patients with kidney disease requiring dialysis. While BMI is accepted as one of the most reliable anthropometric indices for obesity, it is unclear if the protection is derived from the lean muscle mass or visceral and peripheral fat components. Our analysis showed that eLBM and BMI are well-correlated (r=0.74, p<0.0001), and eLBM is strongly associated with survival among patients with BMI < 35 kg/m2. Prior studies have also demonstrated a sophisticated relationship between total fat or LBM and mortality. Noori et al., (39) and Huang et al., (10) examined the relationship between anthropometric measures and mortality in HD patients using triceps skin-fold thickness as a measure of body fat and mid-arm muscle circumference as a surrogate for muscle mass. They found that higher BMI as well as higher fat and muscle mass are collectively associated with decreased mortality risk. However, Postorino et al., (40) evaluated the role of abdominal obesity and mortality in a contemporary European cohort. Although a higher BMI was found to be protective, abdominal obesity was significantly related to higher all-cause and cardiovascular mortality. Similarly in our study, among extremely obese patients (BMI ≥35 kg/m2), the protective effects of BMI and eLBM were not as evident.
To our knowledge, few studies have investigated the association between eLBM and risk of mortality in HD patients across different racial and ethnic groups. In the United States, African Americans have lower life expectancy than the non-Hispanic whites (12–14). However, in the CKD and ESRD population, African American and Hispanic patients have consistently greater survival than non-Hispanic whites (15–17). This epiphenomenon is known as the racial survival paradox observed in patients with kidney disease. In our study, we confirmed the racial survival paradox among HD patients as seen in other studies. While we cannot conclude that the observed mortality trends in the racial paradox are attributed to LBM differences, it is plausible that eLBM may contribute to the survival advantages in both the non-Hispanic white and the African American HD patients, and appear to be particularly robust for the African Americans.
Notably, the role of eLBM is not as clear among the Hispanic HD population. Others have similarly reported a strong modifying role of race in the relationship between BMI and dialysis patient survival. For example, Streja et al., (17) observed that African American and Hispanic HD patients had greater survival than non-Hispanic whites. However, after additional multivariable adjustment for surrogates of nutrition and inflammation, Hispanics had essentially the same mortality as non-Hispanic white patients, whereas African American patients had a greater death risk compared to Hispanic or non-Hispanic white patients. Ricks et al., (18) found that higher BMI was associated with greater survival in all non-Hispanic whites, African Americans and Hispanic HD patients, but African American and Hispanic HD patients experienced higher survival gains compared with non-Hispanic whites across higher BMI categories. Thus, racial differences in ESRD may be affected by socio-economic factors and nutritional status, resulting in mortality differences. A possible explanation for our findings in the Hispanic subgroup may be the uneven racial and ethnic distribution of each LBM stratum. In our study, only a small number of Hispanics had high eLBM; this may result in the masking of the effect of LBM by other important clinical or nutritional risk factors.
Our study has several limitations that should be mentioned. First, our study excluded Asians and other minorities due to the small number of patients and observed outcomes. Secondly, we did not have comprehensive data that may affect HD patient outcomes, such as dialysis access type, hospitalizations, socioeconomic status, and other known or unknown confounders. Therefore, we could not account for unmeasured or residual confounding. We also did not have information on cause of death and could not examine cardiovascular mortality outcomes. Finally, to the best of our knowledge, there are no other validated equations used to calculate lean body mass in HD patients and we therefore could not conduct sensitivity analyses estimating potential type I and II error due to misclassification of lean body mass levels. Our equation may also be subject to overestimation errors due to unmeasured free water content in HD patients. Race, age, and residual renal function are not currently included in the LBM equation developed by Noori et al. because they did not find these to be significant predictors of LBM levels in their analyses (24). In our study, residual renal function, race and sex adjusted height tertiles, and age did not significantly modify associations of LBM and mortality. However, differences were noted across racial groups, suggesting perhaps that LBM equations need to be reexamined accounting for such racial-ethnic differences. While the estimated LBM equation has previously been shown to an accurate metric of lean body mass ascertained by validated tools such as DEXA and near-infrared interactance in a previous study of maintenance HD patients (24), due to data limitations we were unable to determine if this equation accurately estimates LBM within the present study population. While further studies are needed to validate this equation’s accuracy in other HD cohorts, given the high costs and time-consuming nature of gold-standard measurements of LBM, the estimated LBM equation has the potential to serve as a clinically relevant, readily available, and practical tool to estimate somatic protein mass, and may be used to prognosticate mortality risk among HD patients.
CONCLUSION
Estimated LBM and mortality exhibited a linear inverse relationship in HD patients. Higher LBM are correlated with BMI and are associated with better survival in the CKD population treated with HD. This finding is particularly marked among the African American and non-Hispanic white HD population. The association of LBM and mortality among Hispanics is less clear and deserves further examination in additional studies.
Supplementary Material
Supplemental Table 1. Baseline survival of HD patients over 5 years according to estimated Lean Body Mass (n=117,683)
Supplemental Table 2. Baseline survival of Non-Hispanic White H D patients over 5 years according to estimated Lean Body Mass (n=56,542)
Supplemental Table 3. Baseline survival of African American HD patients over 5 years according to estimated Lean Body Mass (n=35,290)
Supplemental Table 4. Baseline survival of Hispanic HD patients over 5 years according to estimated Lean Body Mass (n=17,320)
Association of Estimated LBM with 5 year all-cause mortality in 117,683 HD patients and in subgroups of Non-Hispanic White (n=56,542), African American (n=35,290) and Hispanic (n=17,320) HD patients according to within race/ethnicity deciles of estimated LBM****
eLBM groups were created from percentiles within each racial/ethnic group and are as the following:
Association of BMI and Estimated LBM with 5 year all-cause mortality in 117,683 HD patients***
Reference is BMI 25–<30 kg/m2 and eLBM50.5–<52.7 kg.
Association of Age and Estimated LBM; and Residual Renal Function and Estimated LBM with 5 year all-cause mortality in 117,683 HD patients
Association of Height Tertiles derived by race and sex and Estimated LBM with 5 year all-cause mortality in 109,152 HD patients
Practical Application.
Among the non-Hispanic white and African American HD patients, higher “fat-free” muscle mass may infer lower mortality risk, but this inverse relationship is tempered in Hispanic patients.
Acknowledgments
Funding Source: The study was supported by Dr. Kalantar-Zadeh’s research grants from the National Institute of Diabetes, Digestive and Kidney Disease of the National Institute of Health (R01-DK078106), a research grant from DaVita Clinical Research (DCR), and a philanthropic grant from Mr. Harold Simmons.
The authors express their sincere appreciation to DaVita clinics that ensure the extensive data collection on which their work is based. They thank DaVita Clinical Research for their commitment to clinical research.
Footnotes
Relevant Potential Conflict of Interest: Dr. Kalantar-Zadeh was medical director of the DaVita Harbor-UCLA Long Beach during 2007–2012. Other authors have not declared any conflicts of interest.
The abstract of this report was presented as a poster at the Kidney Week, American Society of Nephrology, November 11–16, 2014, in Philadelphia, US.
Publisher's Disclaimer: This is a PDF file of an unedited manuscript that has been accepted for publication. As a service to our customers we are providing this early version of the manuscript. The manuscript will undergo copyediting, typesetting, and review of the resulting proof before it is published in its final citable form. Please note that during the production process errors may be discovered which could affect the content, and all legal disclaimers that apply to the journal pertain.
References
- 1.Kalantar-Zadeh K, Kopple JD, Kilpatrick RD, McAllister CJ, Shinaberger CS, Gjertson DW, Greenland S. Association of morbid obesity and weight change over time with cardiovascular survival in hemodialysis population. Am J Kidney Dis. 2005;46:489–500. doi: 10.1053/j.ajkd.2005.05.020. [DOI] [PubMed] [Google Scholar]
- 2.Kalantar-Zadeh K, Kuwae N, Wu DY, Shantouf RS, Fouque D, Anker SD, Block G, Kopple JD. Associations of body fat and its changes over time with quality of life and prospective mortality in hemodialysis patients. Am J Clin Nutr. 2006;83:202–10. doi: 10.1093/ajcn/83.2.202. [DOI] [PubMed] [Google Scholar]
- 3.Kopple JD, Zhu X, Lew NL, Lowrie EG. Body weight-for-height relationships predict mortality in maintenance hemodialysis patients. Kidney Int. 1999;56:1136–48. doi: 10.1046/j.1523-1755.1999.00615.x. [DOI] [PubMed] [Google Scholar]
- 4.Kalantar-Zadeh K, Aronoff GR. Hemoglobin variability in anemia of chronic kidney disease. J Am Soc Nephrol. 2009;20:479–87. doi: 10.1681/ASN.2007070728. [DOI] [PubMed] [Google Scholar]
- 5.Sarkar SR, Kuhlmann MK, Kotanko P, Zhu F, Heymsfield SB, Wang J, Meisels IS, Gotch FA, Kaysen GA, Levin NW. Metabolic consequences of body size and body composition in hemodialysis patients. Kidney Int. 2006;70:1832–39. doi: 10.1038/sj.ki.5001895. [DOI] [PubMed] [Google Scholar]
- 6.Atlantis E, Martin SA, Haren MT, Taylor AW, Wittert GA. Inverse associations between muscle mass, strength, and the metabolic syndrome. Metabolism. 2009;58:1013–22. doi: 10.1016/j.metabol.2009.02.027. [DOI] [PubMed] [Google Scholar]
- 7.Woodrow G, Oldroyd B, Turney JH, Smith MA. Influence of changes in peritoneal fluid on body-composition measurements by dual-energy X-ray absorptiometry in patients receiving continuous ambulatory peritoneal dialysis. Am J Clin Nutr. 1996;64:237–41. doi: 10.1093/ajcn/64.2.237. [DOI] [PubMed] [Google Scholar]
- 8.Dumler F, Kilates C. Body composition analysis by bioelectrical impedance in chronic maintenance dialysis patients: comparisons to the National Health and Nutrition Examination Survey 3. J Ren Nutr. 2003;13:166–72. doi: 10.1053/jren.2003.50022. [DOI] [PubMed] [Google Scholar]
- 9.Beddhu S, Pappas LM, Ramkumar N, Samore M. Effects of body size and body composition on survival in hemodialysis patients. J Am Soc Nephrol. 2003 Sep;14(9):2366–72. doi: 10.1097/01.asn.0000083905.72794.e6. [DOI] [PubMed] [Google Scholar]
- 10.Huang CX, Tighiouart H, Beddhu S, Cheung AK, Dwyer JT, Eknoyan G, Beck GJ, Levey AS, Sarnak MJ. Both low muscle mass and low fat are associated with higher all-cause mortality in hemodialysis patients. Kidney Int. 2010;77:624–9. doi: 10.1038/ki.2009.524. [DOI] [PMC free article] [PubMed] [Google Scholar]
- 11.Noori N, Kovesdy CP, Dukkipati R, Feroze U, Molnar MZ, Bross R, Nissenson AR, Kopple JD, Norris KC, Kalantar-Zadeh K. Racial and ethnic differences in mortality of hemodialysis patients: role of dietary and nutritional status and inflammation. Am J Nephrol. 2011;33:157–67. doi: 10.1159/000323972. [DOI] [PMC free article] [PubMed] [Google Scholar]
- 12.Mortality patterns-United States, 1997. MMWR Morb Mortal Wkly Rep. 1999;48:664–8. [PubMed] [Google Scholar]
- 13.Asher CR, Topol EJ, Moliterno DJ. Insights into the pathophysiology of atherosclerosis and prognosis of black Americans with acute coronary syndromes. Am Heart J. 1999;138:1073–81. doi: 10.1016/s0002-8703(99)70072-4. [DOI] [PubMed] [Google Scholar]
- 14.Davey Smith G, Neaton JD, Wentworth D, Stamler R, Stamler J. Mortality differences between black and white men in the USA: contribution of income and other risk factors among men screened for the MRFIT. MRFIT Research Group. Multiple Risk Factor Intervention Trial. Lancet. 1998;351 (9107):934–9. doi: 10.1016/s0140-6736(00)80010-0. [DOI] [PubMed] [Google Scholar]
- 15.United States Renal Data System. United States Renal Data System 2006 Annual Data Report: Atlas of Chronic Kidney Disease&End-Stage Renal Disease in the United States. Am J Kidney Dis. 2007;49:1–296. doi: 10.1053/j.ajkd.2006.11.019. [DOI] [PubMed] [Google Scholar]
- 16.United States Renal Data System. United States Renal Data System 2005 Annual Data Report: Atlas of End-Stage Renal Disease in the United States, National Institute of Diabetes and Digestive and Kidney Disease. Am J Kidney Dis. 2006;47:1–286. [Google Scholar]
- 17.Streja E, Kovesdy CP, Molnar MZ, Norris KC, Greenland S, Nissenson AR, Kopple JD, Kalantar-Zadeh K. Role of nutritional status and inflammation in higher survival of African American and Hispanic hemodialysis patients. Am J Kidney Dis. 2011;57:883–93. doi: 10.1053/j.ajkd.2010.10.050. [DOI] [PMC free article] [PubMed] [Google Scholar]
- 18.Ricks J, Molnar MZ, Kovesdy CP, Kopple JD, Norris KC, Mehrotra R, Nissenson AR, Arah OA, Greenland S, Kalantar-Zadeh K. Racial and ethnic differences in the association of body mass index and survival in maintenance hemodialysis patients. Am J Kidney Dis. 2011;58:574–582. doi: 10.1053/j.ajkd.2011.03.023. [DOI] [PMC free article] [PubMed] [Google Scholar]
- 19.US Census Bureau. [accessed 18 April 2014];Version current 1 April 2014. Internet. No authors listed. http://www.census.gov.
- 20.Federal Office of Management and Budget. [accessed 18 April 2014];Version current 1 April 2014. Internet. No authors listed. http://www.whitehouse.gov/omb.
- 21.Donadio C, Halim AB, Caprio F, Grassi G, Khedr B, Mazzantini M. Single-and multi-frequency bioelectrical impedance analyses to analyse body composition in maintenance haemodialysis patients: comparison with dual-energy X-ray absorptiometry. Physiol Meas. 2008;29:S517–24. doi: 10.1088/0967-3334/29/6/S43. [DOI] [PubMed] [Google Scholar]
- 22.Negri AL, Barone R, Veron D, Fraga A, Arrizurieta E, Zucchini A, Zanchetta JR. Lean mass estimation by creatinine kinetics and dual-energy X-ray absorptiometry in peritoneal dialysis. Nephron Clin Pract. 2003;95:c9–14. doi: 10.1159/000073013. [DOI] [PubMed] [Google Scholar]
- 23.Kamimura MA, Avesani CM, Cendoroglo M, Canziani ME, Draibe SA, Cuppari L. Comparison of skinfold thicknesses and bioelectrical impedance analysis with dual-energy X-ray absorptiometry for the assessment of body fat in patients on long-term haemodialysis therapy. Nephrol Dial Transplant. 2003;18:101–5. doi: 10.1093/ndt/18.1.101. [DOI] [PubMed] [Google Scholar]
- 24.Noori N, Kovesdy CP, Bross R, Lee M, Oreopoulos A, Benner D, Mehrotra R, Kopple JD, Kalantar-Zadeh K. Novel equations to estimate lean body mass in maintenance hemodialysis patients. Am J Kidney Dis. 2011;57:130–9. doi: 10.1053/j.ajkd.2010.10.003. [DOI] [PMC free article] [PubMed] [Google Scholar]
- 25.Aparicio M, Cano N, Chauveau P, Azar R, Canaud B, Flory A, Laville M, Leverve X. Nutritional status of haemodialysis patients: a French national cooperative study. French Study Group for Nutrition in Dialysis Nephrol Dial Transplant. 1999;14:1679–86. doi: 10.1093/ndt/14.7.1679. [DOI] [PubMed] [Google Scholar]
- 26.Rocco MV, Paranandi L, Burrowes JD, Cockram DB, Dwyer JT, Kusek JW, Leung J, Makoff R, Maroni B, Poole D. Nutritional status in the HEMO Study cohort at baseline. Hemodialysis Am J Kidney Dis. 2002;39:245–56. doi: 10.1053/ajkd.2002.30543. [DOI] [PubMed] [Google Scholar]
- 27.Pupim LB, Ikizler TA. Assessment and monitoring of uremic malnutrition. J Ren Nutr. 2004;14:6–19. doi: 10.1053/j.jrn.2003.10.001. [DOI] [PubMed] [Google Scholar]
- 28.Park J, Jin DC, Molnar MZ, Dukkipati R, Kim YL, Jing J, Levin NW, Nissenson AR, Lee JS, Kalantar-Zadeh K. Mortality predictability of body size and muscle mass surrogates in Asian vs white and African American hemodialysis patients. Mayo Clin Proc. 2013;88:479–86. doi: 10.1016/j.mayocp.2013.01.025. [DOI] [PMC free article] [PubMed] [Google Scholar]
- 29.Kalantar-Zadeh K, Streja E, Molnar MZ, Lukowsky LR, Krishnan M, Kovesdy CP, Greenland S. Mortality prediction by surrogates of body composition:an examination of the obesity paradox in hemodialysis patients using composite ranking score analysis. Am J Epidemiol. 2012;175:793–803. doi: 10.1093/aje/kwr384. [DOI] [PMC free article] [PubMed] [Google Scholar]
- 30.Huang JW, Lien YC, Wu HY, Yen CJ, Pan CC, Hung TW, Su CT, Chiang CK, Cheng HT, Hung KY. Lean body mass predicts long-term survival in Chinese patients on peritoneal dialysis. PLoS One. 2013;8:e54976. doi: 10.1371/journal.pone.0054976. [DOI] [PMC free article] [PubMed] [Google Scholar]
- 31.Noori N, Kopple JD, Kovesdy CP, Feroze U, Sim JJ, Murali SB, Luna A, Gomez M, Luna C, Bross R, et al. Mid-arm muscle circumference and quality of life and survival in maintenance hemodialysis patients. Clin J Am Soc Nephrol. 2010;5:2258–68. doi: 10.2215/CJN.02080310. [DOI] [PMC free article] [PubMed] [Google Scholar]
- 32.Combe C, Chauveau P, Laville M, Fouque D, Azar R, Cano N, Canaud B, Roth H, Leverve X, Aparicio M. Influence of nutritional factors and hemodialysis adequacy on the survival of 1,610 French patients. Am J Kidney Dis. 2001;37(1 Suppl 2):S81–8. doi: 10.1053/ajkd.2001.20756. [DOI] [PubMed] [Google Scholar]
- 33.Dwyer JT, Larive B, Leung J, Rocco MV, Greene T, Burrowes J, Chertow GM, Cockram DB, Chumlea WC, Daugirdas J, et al. HEMO Study Group. Are nurtitional status indicators associated with mortality in the Hemodialysis(HEMO) Study? Kidney Int. 2005;68:1766–76. doi: 10.1111/j.1523-1755.2005.00593.x. [DOI] [PubMed] [Google Scholar]
- 34.Kalantar-Zadeh K, Supasyndh O, Lehn RS, McAllister CJ, Kopple JD. Normalized protein nitrogen appearance is correlated with hospitalization and mortality in hemodialysis patients with Kt/V greater than 1. 20. J Ren Nutr. 2003;13:15–25. doi: 10.1053/jren.2003.50005. [DOI] [PubMed] [Google Scholar]
- 35.Walther CP, Carter CW, Low CL, Williams P, Rifkin DE, Steiner RW, Ix JH. Interdialytic creatinine change versus predialysis creatinine as indicators of nutritional status in maintenance hemodialysis. Nephrol Dial Transplant. 2012;27:771–6. doi: 10.1093/ndt/gfr389. [DOI] [PMC free article] [PubMed] [Google Scholar]
- 36.Kalantar-Zadeh K, Streja E, Kovesdy CP, Oreopoulos A, Noori N, Jing J, Nissenson AR, Krishnan M, Kopple JD, Mehrotra R, et al. The obesity paradox and mortality associated with surrogates of body size and muscle mass in patients receiving hemodialysis. Mayo Clin Proc. 2010;85:991–1001. doi: 10.4065/mcp.2010.0336. [DOI] [PMC free article] [PubMed] [Google Scholar]
- 37.Kalantar-Zadeh K, Kuwae N, Regidor DL, Kovesdy CP, Kilpatrick RD, Shinaberger CS, McAllister CJ, Budoff MJ, Salusky IB, Kopple JD. Survival predictability of time-varying indicators of bone disease in maintenance hemodialysis patients. Kidney Int. 2006;70:771–80. doi: 10.1038/sj.ki.5001514. [DOI] [PubMed] [Google Scholar]
- 38.Feroze U, Molnar MZ, Dukkipati R, Kovesdy CP, Kalantar-Zadeh K. Insights into nutritional and inflammatory aspects of low parathyroid hormone in dialysis patients. J Ren Nutr. 2011;21:100–4. doi: 10.1053/j.jrn.2010.10.006. [DOI] [PMC free article] [PubMed] [Google Scholar]
- 39.Noori N, Kovesdy CP, Dukkipati R, Kim Y, Duong U, Bross R, Oreopoulos A, Luna A, Benner D, Kopple JD, et al. Survival predictability of lean and fat mass in men and women undergoing maintenance hemodialysis. Am J Clin Nutr. 2010;92:1060–70. doi: 10.3945/ajcn.2010.29188. [DOI] [PMC free article] [PubMed] [Google Scholar]
- 40.Postorino M, Marino C, Tripepi G, Zoccali C. Abdominal obesity and all-cause and cardiovascular mortality in end-stage renal disease. J Am Coll Cardiol. 2009;53:1265–72. doi: 10.1016/j.jacc.2008.12.040. [DOI] [PubMed] [Google Scholar]
Associated Data
This section collects any data citations, data availability statements, or supplementary materials included in this article.
Supplementary Materials
Supplemental Table 1. Baseline survival of HD patients over 5 years according to estimated Lean Body Mass (n=117,683)
Supplemental Table 2. Baseline survival of Non-Hispanic White H D patients over 5 years according to estimated Lean Body Mass (n=56,542)
Supplemental Table 3. Baseline survival of African American HD patients over 5 years according to estimated Lean Body Mass (n=35,290)
Supplemental Table 4. Baseline survival of Hispanic HD patients over 5 years according to estimated Lean Body Mass (n=17,320)
Association of Estimated LBM with 5 year all-cause mortality in 117,683 HD patients and in subgroups of Non-Hispanic White (n=56,542), African American (n=35,290) and Hispanic (n=17,320) HD patients according to within race/ethnicity deciles of estimated LBM****
eLBM groups were created from percentiles within each racial/ethnic group and are as the following:
Association of BMI and Estimated LBM with 5 year all-cause mortality in 117,683 HD patients***
Reference is BMI 25–<30 kg/m2 and eLBM50.5–<52.7 kg.
Association of Age and Estimated LBM; and Residual Renal Function and Estimated LBM with 5 year all-cause mortality in 117,683 HD patients
Association of Height Tertiles derived by race and sex and Estimated LBM with 5 year all-cause mortality in 109,152 HD patients