Abstract
Purpose:
To evaluate the accuracy and robustness of a simple, linear, separable, two-parameter model (basis vector model, BVM) in mapping proton stopping powers via dual energy computed tomography (DECT) imaging.
Methods:
The BVM assumes that photon cross sections (attenuation coefficients) of unknown materials are linear combinations of the corresponding radiological quantities of dissimilar basis substances (i.e., polystyrene, CaCl2 aqueous solution, and water). The authors have extended this approach to the estimation of electron density and mean excitation energy, which are required parameters for computing proton stopping powers via the Bethe–Bloch equation. The authors compared the stopping power estimation accuracy of the BVM with that of a nonlinear, nonseparable photon cross section Torikoshi parametric fit model (VCU tPFM) as implemented by the authors and by Yang et al. [“Theoretical variance analysis of single- and dual-energy computed tomography methods for calculating proton stopping power ratios of biological tissues,” Phys. Med. Biol. 55, 1343–1362 (2010)]. Using an idealized monoenergetic DECT imaging model, proton ranges estimated by the BVM, VCU tPFM, and Yang tPFM were compared to International Commission on Radiation Units and Measurements (ICRU) published reference values. The robustness of the stopping power prediction accuracy of tissue composition variations was assessed for both of the BVM and VCU tPFM. The sensitivity of accuracy to CT image uncertainty was also evaluated.
Results:
Based on the authors’ idealized, error-free DECT imaging model, the root-mean-square error of BVM proton stopping power estimation for 175 MeV protons relative to ICRU reference values for 34 ICRU standard tissues is 0.20%, compared to 0.23% and 0.68% for the Yang and VCU tPFM models, respectively. The range estimation errors were less than 1 mm for the BVM and Yang tPFM models, respectively. The BVM estimation accuracy is not dependent on tissue type and proton energy range. The BVM is slightly more vulnerable to CT image intensity uncertainties than the tPFM models. Both the BVM and tPFM prediction accuracies were robust to uncertainties of tissue composition and independent of the choice of reference values. This reported accuracy does not include the impacts of I-value uncertainties and imaging artifacts and may not be achievable on current clinical CT scanners.
Conclusions:
The proton stopping power estimation accuracy of the proposed linear, separable BVM model is comparable to or better than that of the nonseparable tPFM models proposed by other groups. In contrast to the tPFM, the BVM does not require an iterative solving for effective atomic number and electron density at every voxel; this improves the computational efficiency of DECT imaging when iterative, model-based image reconstruction algorithms are used to minimize noise and systematic imaging artifacts of CT images.
Keywords: dual energy, computed tomography, proton therapy, stopping power
1. INTRODUCTION
Dual energy computed tomography (DECT) imaging consists of scanning an object (patient) at two distinct energies, usually at low- and high-energy photon spectra. The underlying problem of establishing one-to-one correspondence between CT image intensity [i.e., Hounsfield Units (HUs)] and material composition is addressed by quantitative dual energy CT (QDECT). QDECT measures two properties of each voxel, thereby disambiguating the dependence of HU on material composition and density. For example, the earliest QDECT applications characterized tissues in terms of the effective atomic number Z* and electron density ρe.1 Numerous QDECT applications have been developed, including bone mineral density estimation2,3 and production of iodine-free images from contrast images.4 Recently, it has been proposed that QDECT be applied to estimate radiological quantities5 in support of radiation therapy treatment planning both for charged particle therapy6 and low-energy brachytherapy.7 In proton-beam therapy, the goal is to more accurately estimate the depth of the Bragg peak in patients. For example, Schneider et al.8 found that the measured Bragg peak depth in dogs treated for nasal tumor deviated from the estimated peak depth by 3.6 mm on average when a state-of-the-art quantitative single energy CT (QSECT) stoichiometric calibration method9 was used to determine the proton stopping power. Yang et al.6 first proposed a QDECT process for imaging stopping power ratios (SPRs) based upon a simplified parametric fit model of linear attenuation coefficients first introduced by Torikoshi.10 Using idealized simulated QDECT, Yang et al.6 showed that DECT can outperform single energy CT (SECT) in prediction accuracy and robustness. A root-mean-square error (RMSE) of 0.26% with maximum relative errors of about 1% was reported for standard human tissues. Bourque et al.11 extended SECT stoichiometric calibration to DECT and found that the mean absolute error of proton stopping power is about 0.08% for 34 standard human tissues, excluding the thyroid tissue. Hünemohr et al.12 first experimentally implemented post processing DECT SPR mapping and validated it for different materials. By taking into account both the effective atomic number Z* and electron density ρe, indicating that a mean accuracy of 0.6% could be achieved from the measured 80/140Sn kVp DECT images. Hünemohr et al.13 also estimated SPR by correlating electron density ρe calculated from acquired DECT images. In the application of tissue characterization, Landry et al.14 first proposed that DECT outperforms the assignments of % wt. of oxygen and carbon than SECT in the absence of image noise. Hünemohr et al.15 suggested that QDECT can improve the accuracy of tissue characterization in predicting mass density and elemental compositions of representative tissues.
A possible problem of current proton QDECT is that most models are based on nonlinear, nonseparable parametric models that are computationally complex. Obtaining estimates of requires solving nonlinear equations iteratively using Newton–Raphson or similar techniques, at each voxel x. While this is not a problem for the postprocessing (image domain) QDECT techniques investigated to date, it could significantly add to the computational burden of iterative model-based QDECT reconstruction algorithms. Since QDECT solutions are sensitive to noise and image artifacts,11,12 there is growing interest in iterative techniques, e.g., maximum likelihood techniques or compressed sensing,17 to implement principled beam hardening and scatter corrections to improve the image uniformity and dose efficiency beyond the level achieved by sinogram preprocessing corrections.5 Such techniques use physically realistic signal formation models, i.e., polyenergetic forward projectors, based upon the previously characterized scanning beam spectra, with judiciously chosen regularization penalties, to produce smoother, more uniform, and less artifactual images with a lower patient dose than conventional filtered backprojection techniques.5,18 Forward projections require an accurate estimation of linear attenuation coefficients, at any energy E in the scanning spectrum and voxel x in the scan subject. The polyenergetic forward projectors used by the iterative QDECT techniques reported to date5,18,19 have been based upon the linear, separable, closed basis vector model (BVM),16 which was first introduced into the CT image reconstruction field by Alvarez and Macovski.20
In this study, we propose an adaptation of the linear separable two-parameter DECT BVM model for estimating proton stopping powers. Previously, our group demonstrated the accuracy of the two-parameter model in parameterizing linear attenuation coefficients in the photon energy range of 20 keV to 1 MeV for elemental and composite biological media.21 In this work, we show that our simple BVM extension accurately estimates proton stopping powers for 175 MeV protons with an accuracy equivalent to that of the more computationally intensive Torikoshi parametric fit models (tPFMs).10 In addition, we assess the sensitivity of QDECT performance to both image uncertainties and tissue composition variations lying outside the International Commission on Radiation Units and Measurements (ICRU) published values.
2. METHODS AND MATERIALS
In this study, we evaluated two-parameter models for mapping the proton stopping power by means of an idealized QDECT process. Using this highly idealized model, we were able to isolate radiological quantity modeling errors from image intensity uncertainties and artifacts. Hence the errors identified in this study represent the lower bound of clinically achievable performance. The images intensity HUSk of each pixel in CT images for unknown tissue were termed
| (1) |
where μwat, μ are the linear attenuation coefficients of water and unknown tissue. The subscripts Sk = 1, 2 represent the low- and high-energy CT spectra, respectively. By convention, ASk and BSk take values near 1000 and 1, in quantitative CT, these parameters are determined by maximizing the fit between experimentally measured HUSk values and spectrally averaged values calculated values for scanned samples of known composition and density.
Protons lose energies primarily by means of Coulombic interactions with electrons when passing through tissues. The Bethe–Bloch equation22 approximates the rate of energy loss and stopping power of tissues at a given proton energy (Eproton) as follows:
| (2) |
where k1 and k2 are products of physical constants; β = v/c; c is the speed of light; Tmax is the maximum energy transferred to a single electron; and ρe and I are the electron density and mean excitation energy (I-value), respectively. The I-value depends on the composition and the density of the medium. The density correction, δ(β) is significant only at proton energies above several hundred MeV. The shell correction, C(β) is significant only when proton velocity is comparable to that of atomic electrons. These two corrections were ignored since they are negligible for the energies considered in this study.
In this work, reference stopping power values were computed by Eq. (2) for 34 standard tissues6 using the elemental compositions, electron density and mass density data, along with I-value for each constituent element from ICRU reports.23,24 The mean excitation energy for each tissue was computed from elemental I-values (including ICRU recommended solid/liquid phase to gaseous phase corrections)35 using the Bragg additivity rule:
| (3) |
where ωi, Zi, Ai and Ii are the mass fraction, atomic number, atomic mass and mean excitation energy of the i-th element in the tissue, respectively. For water and polystyrene, the experimentally measured I-values recommended by ICRU were used,25 while for CaCl2 solution, the I-value was estimated by applying the Bragg additivity rule to the recommended water I-value of water and the I-value of CaCl2, which is estimated by the Bragg additivity rule from elemental values.
In this study, we evaluated the accuracy of stopping power predicted by competing DECT models at proton energy of 175 MeV for 34 standard tissues. To assess the relationship between accuracy and proton energy, prediction errors were evaluated for three typical tissues (adipose, muscle, and cortical bone) for energies ranging from 5 to 300 MeV.26 We also computed proton range for each of 34 tissues starting from 175 MeV by utilizing the continuous slowing down approximation (CSDA),
| (4) |
S(Eproton) is the stopping power of protons at energy E. E0 is the initial energy at the tissue-phantom surfaces. Emin is the energy where integration of the model is terminated, which was set to 1 MeV.
2.A. Basis vector model
The BVM (Ref. 16) assumes that the linear attenuation coefficient of an unknown material at location x can be represented as a linear combination of the linear attenuation coefficients of two dissimilar basis materials, e.g., polystyrene and aluminum,
| (5) |
where represents the linear attenuation coefficient of pure samples of the basis materials, k = 1, 2. Once the voxel dependent, but energy independent and possibly negative c1(x) and c2(x) images from DECT images are derived, the linear attenuation coefficient for any energy within the range that the BVM has been validated can be obtained. Let us assume that a phantom consisting of unknown compounds and/or mixtures is scanned with a commercial CT scanner at low- (Sk = 1) and high-energy (Sk = 2) spectra, characterized by normalized photon fluence spectra φSk(E), where . Because the BVM is separable and expressed as the sum of the products of energy- and position-dependent terms, Eq. (5) becomes
| (6) |
Since spectra of commercial CT scanner are generally unknown, and HU measurements may be affected by beam hardening, scattering, noise and preprocessing corrections, Sk(E) is often approximated by a single effective energy, ESk, such that for the two basis materials. Experimentally, this is commonly achieved27 by scanning a series of samples, x, of known composition, including pure basis materials, and then finding the effective energy for each spectrum that maximizes the accuracy of Eq. (1). With this calibration in hand, Eq. (6) becomes
| (7) |
For low- and high-energy scans, Eq. (7) describes a system of two linear equations with two unknowns which can be solved for c1(x) and c2(x) at each voxel. If the scanning beam spectra are known, then the need for effective mean energies can be avoided since can be calculated directly, simplifying the identification of optimal parameters ASk and BSk. In iterative statistical image reconstruction, the need for this calibration procedure is completely avoided. Given estimates of the spectra and detector scatter profiles, optimal c1(x) and c2(x) images can be iteratively estimated by minimizing the discrepancy between the predicted polyenergetic forward projections and measured transmission sinograms. Since this investigation focuses only on the accuracy of the BVM model itself, in isolation from any additional uncertainties with the image acquisition process, the idealized monoenergetic DECT scanning process described by Eq. (7) is assumed. In this study, DECT with 90 and 140 kVp beams was approximated5,16 using effective energies of 45 (E1) and 80 (E2) keV. Thus, the linear attenuation coefficients of the basis materials and 34 ICRU standard human tissues were evaluated at these two effective energies based on the knowledge of the elemental composition.
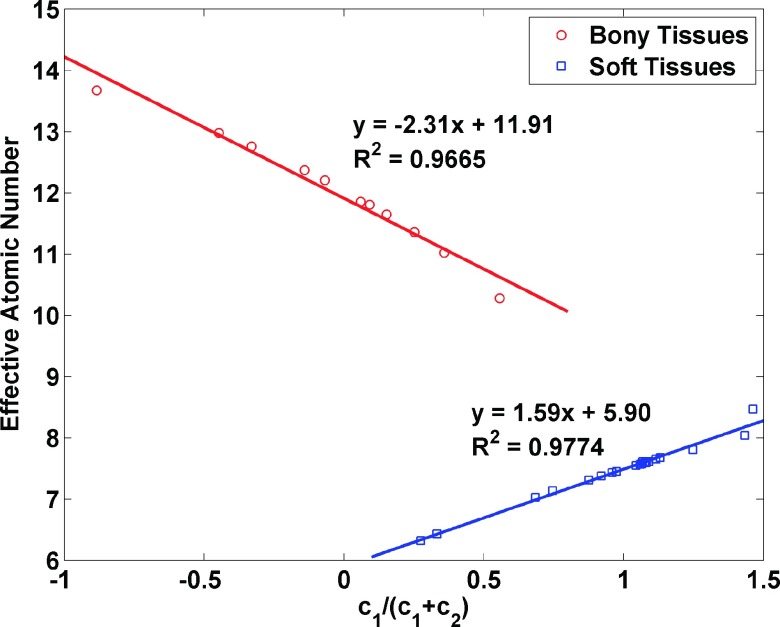
The choice of basis material has been discussed previously by Weaver and Huddleston,28 who used principal components analysis. However, the choice of water as the boundary material between low-Z and high-Z mixtures was suggested by Williamson et al.16 For our study, a water and polystyrene pair was selected for soft tissues (low-Z materials), while a water and aqueous CaCl2 solution (23% concentration) pair was chosen for bony tissues (high-Z materials).16 The ratio of coefficients c1/(c1 + c2) for each material is closely correlated with its effective atomic number, Z* (Fig. 1). The details of the Z* calculation are described in Sec. 2.B. As suggested by Williamson et al.,16 the basis pair for a given voxel x can be selected by evaluating the ratio : x is assigned to the polystyrene–water pair if ξ(x) ≥ 1 and water–CaCl2 solution otherwise. Figure 1 shows that the boundary between low-Z and high-Z tissues falls near the thyroid tissue data point, which has about 8.4. Figure 1 also shows that c1/(c1 + c2) can be used as an alternative to Z* for characterizing material composition.
FIG. 1.
The linear relationship between c1/(c1 + c2) and effective atomic number of the 34 human tissues selected from the ICRU reports. The effective atomic number was calculated based on the knowledge of the elemental composition.
To apply the BVM to the estimation of proton stopping power, we hypothesized that the electron density and mean excitation energy of an arbitrary biological material can be accurately predicted by the following linear combinations where c1 and c2 were derived from DECT analysis Eq. (7):
| (8) |
where ρe1 and ρe2 are the electron density of water and polystyrene or CaCl2 solution. The electron densities of basis mixtures was estimated by
| (9) |
where ρm is the mass density of the mixture and ωi is the mass fraction of the ith element. The mean excitation energy of an arbitrary tissue is given by
| (10) |
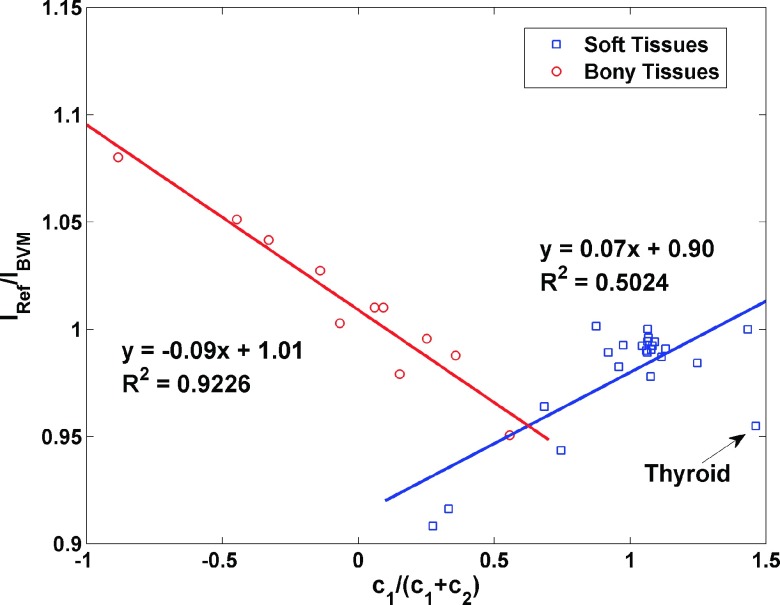
where fI is an empirical correction function that mitigates the residual error of the prediction of I-value by Eq. (8). It was assumed that the ratio of I-values from Eq. (8) to the ICRU reference values and c1/(c1 + c2) is linearly dependent,
| (11) |
To determine the parameters a and b in Eq. (11), the precomputed ratios of IRef/IBVM for 34 standard human tissues were separated into two groups: soft tissues and bony tissues, and each of which had the best linear fit that minimized the summed squared difference between predicted ratios and precomputed ratios. The linear empirical correction function was then used to update the estimation of I-values from Eq. (8). This correction function can also be generated from scanning calibration phantoms for a specific scanner. For example, CT numbers of calibration phantoms acquired by scanning at two different energies can be used to compute c1 and c2, which can then be used to estimate the uncorrected I-value of calibration phantoms from Eq. (8). Since the references of I-value can be obtained using the Bragg additivity rule given the exact elemental compositions of phantoms, the correction function was constructed by comparing reference values against uncorrected I-values with respect to c1/(c1 + c2). In our study, the linear fits for the soft and bony tissues are shown in Fig. 2. A voxel falling into the overlap region of Fig. 2 would be described as a bony tissue or soft tissue depending upon which basis pair it was assigned based on the ratio of its DECT image intensities as described above.
FIG. 2.
The linear relationships between c1/(c1 + c2) and I-value prediction error by the BVM for soft tissues and bony tissues. This empirical function was used to correct the error of the I-value estimated by the BVM.
2.B. Torikoshi parametric fit models
The previously investigated model for two-parameter estimation of proton stopping power by Yang et al.6 was based on Torikoshi’s nonseparable model of photon cross sections, termed tPFMs, which assumed that the linear attenuation coefficient of each unknown material is a function of ρe and Z*. For photon energies lower than 1.02 MeV, the linear attenuation coefficient of tissue was modeled by Torikoshi et al.10 as
| (12) |
where and are the effective atomic number and electron density at voxel x. The terms and represent photoelectric absorption and scattering, respectively. The pretabulated correction functions and were determined by forcing Eq. (12) to reproduce exact linear attenuation coefficients for the elements (Z = 2 − 20), as tabulated by the National Institute of Standards and Technology (NIST) XCOM database.29 For tissues that are unknown mixtures of elements with Z between 1 and 20, Eq. (12) can be solved iteratively for noninteger Z* and ρe values for each CT voxel. To apply these results to proton stopping power estimation, an empirical relationship between ln I and Z* or I and Z* is required. The standard effective atomic number of human tissue was defined as
| (13) |
respectively, since it is repeated in Eq. (3). m was determined to be 3.4 by minimizing the sum of the squared difference between Zstd and Z*, which was calculated using Eq. (12).
In Yang’s simulation study, the linear attenuation coefficients were approximated by
| (14) |
where ϕl,j is the weighting function of the l-th energy bin of the j-th spectrum (j = 1, 2 denoting 100 and 140 kVp spectra, respectively). The beam spectra of the CT scanner at two energies were calculated by the SpekCalc x-ray spectrum generator in the implementation of Yang et al.6
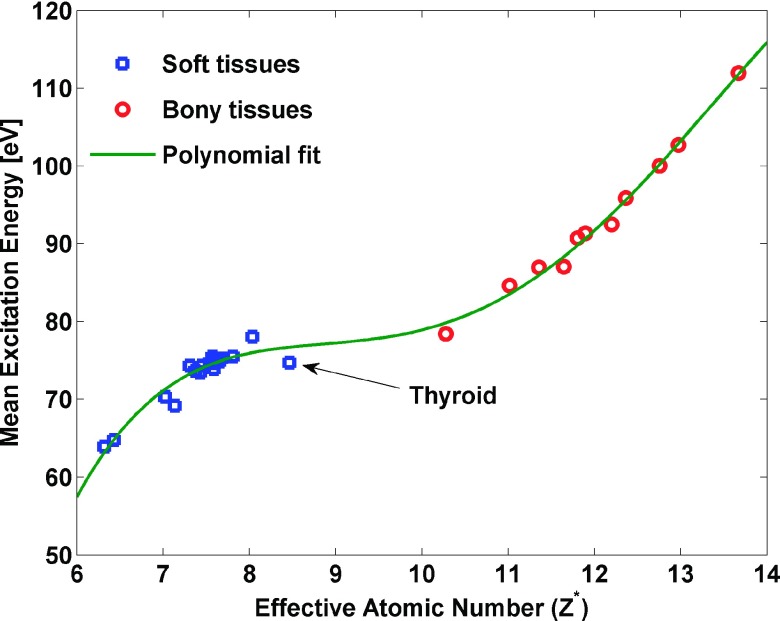
To fairly and consistently compare the tPFM to our BVM model, we have implemented a modified version of Yang’s process (hereafter termed the Yang tPFM) and a second model (hereafter designated as the VCU tPFM). There are two differences between the VCU tPFM and Yang tPFM. In the VCU tPFM, each energy spectrum was approximated by its effective energy, while in the Yang tPFM, two synthetic energy spectra were used. The VCU tPFM used a different empirical relationship for inferring mean excitation energy from effective atomic number than the Yang tPFM (shown for the same set of human tissues in Fig. 3). In addition, the thyroid tissue was assigned to the soft tissues category for estimating I-values in the Yang tPFM of our study; however, the thyroid tissue was excluded from the Yang et al.6 analysis. The nonlinear equation with unknowns Z* and ρe were solved iteratively using the matlab (version 12.0, The Math Works, Inc., Natick, MA) function fminsearch in the implementation of the VCU tPFM. To reproduce the results of the SPR estimation from the Yang et al.,6 I-values and electron density of tissues estimation from the Yang et al.6 were used in the Yang tPFM study.
FIG. 3.
The polynomial relationship (Ref. 11) between Z* and mean excitation energy was implemented in the VCU tPFM. Data for 34 soft tissues and bony tissues are shown.
2.C. Robustness analysis of the DECT models’ estimation of the proton stopping power
Our idealized QDECT simulation used the elemental compositions, mass, and electron densities for different body tissues recommended by ICRU reports23,24 and other studies.30,31 To make conservative estimates of the impact of poorly characterized tissue composition variability on QDECT estimates, we varied the elemental compositions of the unknown soft tissues by varying the mass fractions of the following major components: water, lipid, protein, carbohydrate, and ash (Table I), each of which has a fixed elemental composition according to the Table A1 in ICRU report 46.23 Using adipose tissue as an example, assuming that the main component is lipid with a range of mass fraction of 30%–80%,23,32 protein mass fraction range of 1%–7.5%, and constant mineral mass fraction, the water content can be computed based on the normalization of all components to 100%. Note that since the range of each component was chosen in a way that can accommodate large variability reported by ICRU report 44,24 the values of mass fraction reported here may not be realistic. For trabecular bone tissues, the cortical bone and marrow tissues as major components were varied. The mass densities of tissues were estimated from the mass fractions and mass densities of the components.33
TABLE I.
Variations in the components of soft tissues and trabecular tissues (percentage by mass or volume) considered in this study.
| Body tissues (mass fraction) | Water | Lipid | Protein | Carbohydrate | Ash (mineral) |
|---|---|---|---|---|---|
| Adipose-like tissue | 62.2–4.7 | 30–88 | 1.0–7.5 | — | 0.3 |
| Muscle-like tissue | 83–73 | 1–5 | 10–20 | 1 | 0.9 |
| Cortical bone (volume fraction) | Red marrow (mass fraction) | ||||
| Trabecular bone (spongiosa) | 5–70 | 30–100 |
2.D. Accuracy analysis
The reference stopping power of representative human tissues was computed using the electron density and composition data from ICRU report 44 (Ref. 24) based on the Bethe–Bloch equation.22 To quantify the accuracy of the stopping power prediction by different QDECT models, including the BVM, Yang tPFM, and VCU tPFM, the relative error and RMSE, defined below, were evaluated at a single proton energy where Eproton = 175 MeV,
| (15) |
| (16) |
where SPi′ refers to the stopping power of the i′th tissue. The distribution of the relative error of the proton stopping power and range for all human tissues are also presented.
2.E. Sensitivity to CT image uncertainty
As mentioned above, our study ignores the uncertainties inherent in commercial CT scanners, including image noise, beam hardening, nonuniformity, and other nonlinear artifacts. These uncertainties can undermine the one-to-one correspondence between underlying tissue characteristics and CT image intensity. Williamson et al.16 pointed out that QDECT estimates of photon cross sections are particularly vulnerable to measurement uncertainties. In this study, the impact of uncertainties in CT image intensities on proton stopping power estimation was evaluated for both of the BVM and VCU tPFM.
We defined image density as , where j = 1 and 2 denote E1 and E2 and k = 1, 2, and 3 denote basis material 1, basis material 2, and unknown material, respectively. c1 and c2 are functions of six independent image intensities, which are assumed to have uncertainties of σj,k. The uncertainties of electron density prediction by the law of error propagation for a coverage factor of 1.0 can be written as
| (17) |
The uncertainty of the product of electron density and the logarithmic of I-value can be obtained in a similar fashion.
Thus, the uncertainty of the stopping power estimation via the BVM was given by
| (18) |
where the constants K and k1 were defined by Eq. (2), and Cov(ρe, ρelnI) was the covariance of ρe and ρelnI. For the parameterized QDECT models, the uncertainty of the stopping power can be obtained similarly. All uncertainties described above were evaluated numerically (ratio of change in numerator to 1% change in denominator), at three different image uncertainty levels for standard human tissues.
Following Williamson et al.,16 three different levels of CT image intensity uncertainty were investigated. Following the NIST technical note34 on uncertainty analysis guidelines, the image intensity uncertainties were the quadrature sum of random (type A) and systematic errors (type B), e.g., streak and cupping, in terms of coefficients of variation (COV). The lowest uncertainty levels, with COV of 0.2% and 0.1% for low- and high-energy scans, respectively, supported recovery for a low-energy photon cross section with 3% accuracy and acceptable spatial resolution but are not achievable on current commercial scanners with clinically acceptable patient doses. The intermediate levels (0.6%, 0.3%) are minimum uncertainties achievable by fourth-generation CT scanners, while the highest uncertainties (1.5%, 1.0%) are characteristic of clinical pelvic CT imaging. The readers are referred to Ref. 16 for the choice of uncertainties level. The uncertainties in the calibration scan of the basis material were not taken into account due to averaging of many voxels in the calibration scan.16
3. RESULTS
3.A. Prediction of the mean excitation energy and electron density of human tissues
The mean excitation energy and electron density of the three basis materials used in this study are summarized in Table II.
TABLE II.
Electron densities and I-values of basis materials.
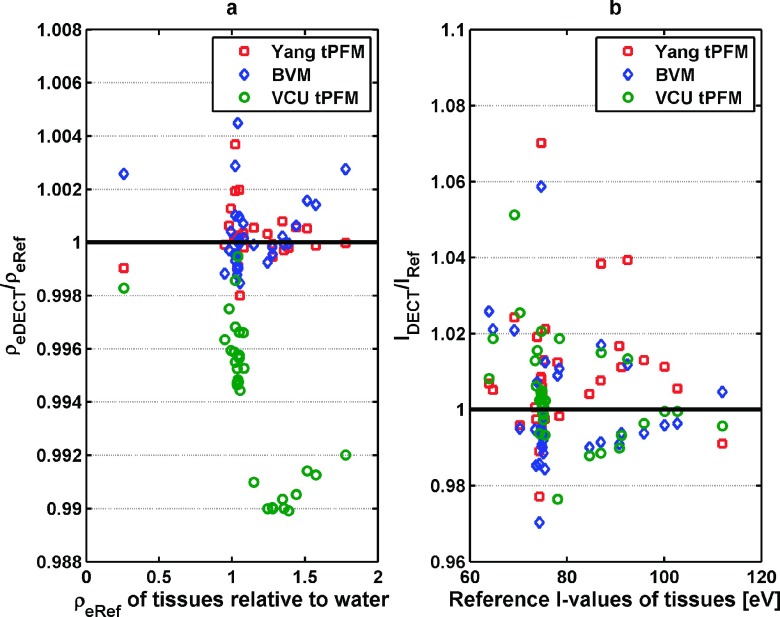
Figure 4(a) shows that the Yang tPFM and BVM both predict the electron density within 0.5% for most tissues, while the VCU tPFM has a slightly larger prediction error of nearly 1%.
FIG. 4.
The ratio of electron density and I-values estimation by three different models: the Yang tPFM, BVM, and VCU tPFM, respectively, to the reference value of stopping power. (a) Electron density and (b) I-values. The reference electron density of tissues is shown in the form of electron density relative to water. The reference I-values were computed based on the Bragg additivity rule.
The mean relative errors in estimated electron density averaged over 34 standard tissues were 0.09% ± 0.10% for the BVM, 0.07% ± 0.08% for the Yang tPFM, and 0.57% ± 0.29% for the VCU tPFM. Within the different DECT models, the BVM showed comparable accuracy to the Yang tPFM, while the VCU tPFM was slightly less accurate. Due to large errors incurred by including the thyroid tissue in estimation of I-value of soft tissues, Yang et al. omitted the thyroid tissue from their empirical fit of I-values versus Zstd, whereas it was included in the BVM and VCU tPFM fits. Figure 4(b) shows that the BVM, Yang tPFM, and VCU tPFM models predict the I-values with comparable accuracy with mean errors of 1.14% ± 1.15%, 1.16% ± 1.06%, and 0.94% ± 1.03%, respectively. For the thyroid tissue, I-value prediction errors were 5.9%, 7.0%, and 2.1% for the BVM, Yang tPFM, and VCU tPFM models, respectively. The BVM had slightly reduced I-values prediction errors compared to the Yang tPFM. The RMSE for electron density and I-values are summarized in Table III.
TABLE III.
RMSE of electron density and I-values for standard tissues, including the thyroid tissue by different models.
| DECT Models | ρe (%) | I-value (%) |
|---|---|---|
| BVM | 0.13 | 1.56 |
| Yang tPFM | 0.11 | 1.84 |
| VCU tPFM | 0.63 | 1.38 |
3.B. Prediction of the proton stopping power at 175 MeV
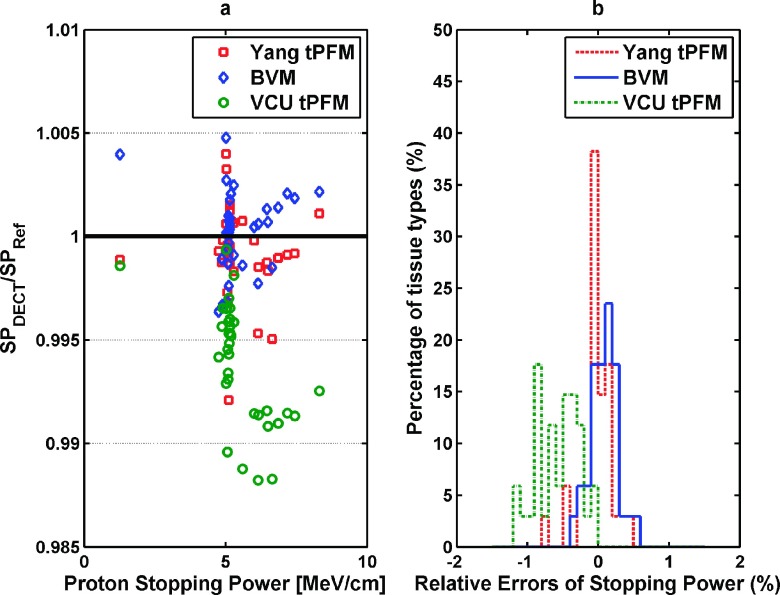
Figure 5(a) shows the errors in estimating the stopping power of 34 human tissues by the three different DECT models. The mean relative errors of the BVM, Yang tPFM, and VCU tPFM were 0.16% ± 0.12%, 0.14% ± 0.12%, and 0.62% ± 0.29%, respectively.
FIG. 5.
(a) A comparison of errors in the stopping power predictions from different DECT models with reference values. The maximum relative error of prediction using the BVM was well below 0.5%. (b) The distribution of relative errors of the stopping power of 34 standard human tissues estimated by the BVM, Yang tPFM, and VCU tPFM is shown.
The RMSEs of the stopping power estimation for the BVM, Yang tPFM, and VCU tPFM were 0.20%, 0.23%, and 0.68%, respectively. Figure 5(b) shows the error distribution of the predicted stopping power using three different models for 34 human tissues. These data indicate that BVM had similar prediction accuracy to the Yang tPFM model but better accuracy than the VCU tPFM.
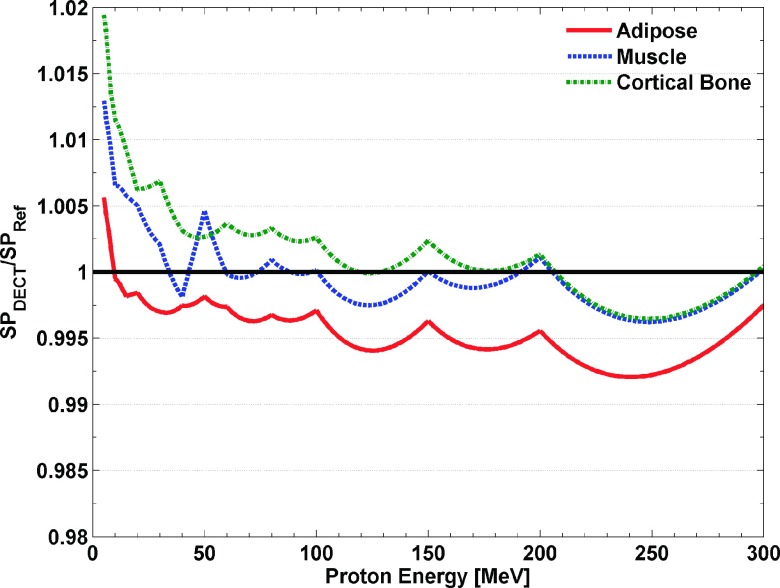
3.C. Dependence of the proton stopping power prediction accuracy on proton energy and tissue type
Figure 6 shows that the BVM proton stopping power estimation accuracy for a typical set of tissues (adipose, muscle, and cortical bone)26 for proton energies ranging from 5 to 300 MeV. Figure 6 shows that estimation errors are constant at ±0.3% above 40 MeV. Only below 10–20 MeV did these errors begin to exceed 1% but remained within 2% at the lowest energy 5 MeV evaluated. Although larger errors would be expected below 5 MeV, the residual range of such low energy protons is less than 0.5 mm and hence is of limited clinical significance.
FIG. 6.
The ratio of stopping power estimation by the BVM and VCU tPFM, respectively, to the reference value of in the energy range from 5 to 300 MeV.
3.D. Range analysis of different DECT models
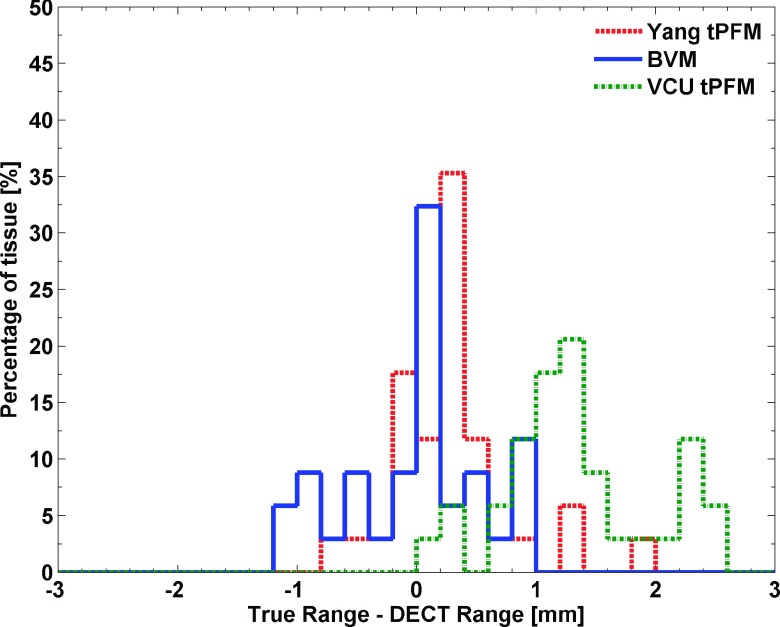
The distribution of the range prediction errors, defined by the difference between Eq. (4) and the ICRU report35 for the 34 standard tissues, is shown in Fig. 7.
FIG. 7.
The distribution of the relative proton range error with respect to reference values at 1 MeV for 34 standard human tissues with an initial proton energy at 175 MeV. Computation of the proton range was based on a CSDA approximation.
Figure 7 shows that along the proton path, the BVM predictions on the range of most tissues were well below 1 mm. The RMSEs for the proton range prediction of the BVM, Yang tPFM, and VCU tPFM were 0.26%, 0.25%, and 0.65%, respectively. The root-mean-square of CSDA range errors of the BVM, Yang tPFM, and VCU tPFM for 34 standard human tissues were 0.55, 0.52, and 1.40 mm.
3.E. DECT sensitivity to measurement uncertainties
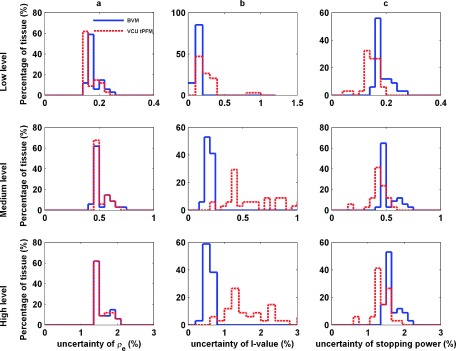
Figure 8 shows the impact of image intensity uncertainties on electron densities, I-values, and stopping power estimated by the BVM and VCU tPFM. Since the BVM and VCU tPFM models use the same monoenergetic approximation of CT spectra, the Yang tPFM is excluded from the sensitivity study.
FIG. 8.
The distribution of the uncertainties of 34 standard human tissues in electron density (a), I-values (b), and stopping power (c) from three different CT image uncertainty levels (low-, medium-, and high-level): top row: low level 0.2% and 0.1%; middle row: medium level 0.6% and 0.3%; and bottom row: high level 1.5% and 1.0%.
The electron density and stopping power in Fig. 8 show that the BVM is slightly more sensitive to image uncertainty than the VCU tPFM, especially for low level of image uncertainties. The BVM showed less susceptibility to image uncertainties in estimating I-value than the VCU tPFM did possibly due to the implementation of the empirical correction function fI.
In contrast to low-energy photon cross section imaging,16 stopping power images are much less sensitive to image uncertainty. Uncertainties less than 1% (coverage factor of 1) can be achieved using acquisition protocols at the limit of commercial capability, around 0.3% and 0.6% for the high- and low-energy scans, respectively.
3.F. Dependence of QDECT accuracy on tissue composition
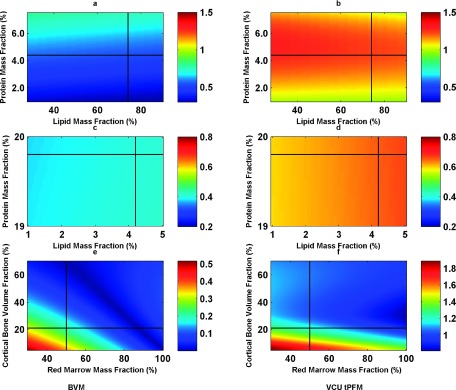
Figures 9(a) and 9(b) show the relative error estimated for 175 MeV of stopping power by the BVM and VCU tPFM models for hypothetical adipose-like tissues over the range of lipid and water concentrations in table. The relative errors for adipose-like tissues were below 0.8% for the BVM, while the VCU tPFM had a slightly larger maximum error of 1%, primarily because of its larger errors in predicting electron densities.
FIG. 9.
The relative error distribution of adipose-like [(a) and (b)] and muscle-like [(c) and (d)] stopping power at 175 MeV as a function of lipid and water mass fractions for constant mass fractions of 0.3% and 0.9% ash was predicted by BVM [(a) and (c)] and the VCU tPFM [(b) and (d)], respectively. The relative errors distribution of trabecular bone [(e) and (f)] stopping power are predicted by BVM (e) and VCU tPFM (f) by varying cortical volume (5%–70%), and red marrow mass fraction over the range of 30%–100%. Note the difference in the color bar scale in (e) and (f). The black cross corresponds to ICRU report 44 (Ref. 24) published values of adipose, muscle, and spongiosa composition.
Figures 9(c) and 9(d) show that the BVM and tPFM models’ prediction errors for muscle-like tissues were insensitive to variations in lipid and water mass fractions for constant protein and mineral ash mass fractions, with a maximum error of 0.8%. The BVM performs better than the tPFM model. In the case of bony tissues, Figs. 9(e) and 9(f) show that in BVM stopping power predictions, trabecular bone was not sensitive to the variation in composition. The errors were all well below 0.8%, which was better than the performance of the tPFM model.
The results of this study demonstrate that both the BVM and nonseparable parametric models maintain good accuracy over a wide range of assumed bony and soft tissue compositions that were not included in the original ICRU training dataset from ICRU reports.
4. DISCUSSION
Overall, our results demonstrate that our simple linear, separable BVM model achieved stopping power estimation accuracy that is comparable to the more complex Yang tPFM at 175 MeV. Preliminary results also show that the achieved accuracy is independent of energy for adipose, muscle, and cortical bone down to low proton energies of 30 MeV. Compared to our implementation of the parametric fit model, the BVM can achieve improved accuracy in stopping power estimation: 0.20% compared to 0.68%. The mean absolute error of electron density 0.08% (excluding the thyroid tissue) was obtained by using the BVM model. This is also comparable to the DECT stoichiometric algorithm proposed by Bourque et al.,11 which showed that the mean absolute error of electron density is 0.08% for standard human tissues excluding the thyroid tissue. It should be noted that in this study, the accuracy of the proton stopping power estimation was evaluated in an idealized scenario. Thus, the accuracy claimed in this paper may not be achieved at clinically acceptable patient doses using currently available CT systems.
The errors reported here are smaller than those reported by investigators who have experimentally implemented DECT-based postprocessing imaging of stopping power ratio.11–13 For example, Hünemohr et al.13 reported that water equivalent path length (WEPL) residuals of tissue surrogates were greatly decreased from −1.0% ± 1.8% by SECT stoichiometric calibration to −0.1% ± 0.7% by DECT calibration. Bourque et al.11 showed that the mean absolute error of the proton stopping power was about 0.5% ± 0.4% for the Gammex 467 phantom by DECT stoichiometric calibration. These errors are influenced by uncertainties in image intensity uniformity and noise; composition of the phantom substitute; and the I-value as well as two-parameter model prediction error, which is the sole focus of this paper.
As noted in our Introduction, iterative image reconstruction algorithms with integrated beam hardening corrections based on known scanning beam photon spectra require accurate estimation of the linear attenuation coefficient as a function of energy. Previously, our group has demonstrated that 1% modeling accuracy can be achieved with the BVM in the 20–1000 keV energy range.16 In contrast, the PFM model, which is utilized by the stoichiometric method9 and its DECT extensions,11 predicted the NIST XCOM (Ref. 29) cross sections in the Z = 2–20 range much less accurately, mainly due to the energy dependence of the atomic number exponent in the PFM photoelectric absorption term. The experimentally implemented postprocessing DECT SPR mapping processes recognize the limitation of the PFM,11 using it only to predict the dependence of HUSk,x intensities on Z* by performing spectrum-averaged PFM fits to scans of substance of known composition. Hence, this class of experimentally implemented, postprocessing cross section models is not relevant to the implementation of iterative polyenergetic DECT reconstruction algorithms since the former are limited to predicted spectrally averaged cross sections.
Our study was based on ICRU recommended I-value and electron densities. The error propagation analysis in this study did not include I-value measurement uncertainty. The BVM model predictions were not expected to be sensitive to these assumed values, provided that basis and training set materials used consistent parameter values. Also both the BVM and tPFM include correction terms that explicitly accounted for I-value prediction errors. On the other hand, if I-values of actual patient tissues and physical phantom substitute deviate from their assumed ICRU values, the DECT stopping power images predicted by any two-parameter model will deviate from physical reality. Besemer et al.36 noted that liquid water I-value measurements span a range of approximately ±12% which corresponds to stopping power uncertainties of approximately ±0.8%.37
The accuracies achieved by the two-parameter models in this study were evaluated at the energy pair 90 and 140 kVp. It should also be noted that by adding additional tin filtration for more separation between low and high effective energies, the prediction accuracy can be increased. For example, by using the approximating effective energy of 140 kVp with 0.5 mm thick tin filter as 90 and 90 kVp spectra as 45 keV, the RMSEs of the stopping power estimation for 34 standard human tissues by the VCU tPFM were 0.28%.
The BVM has several advantages over other tPFM models. First is economic computation cost; there is no need to solve nonlinear equations for Z* and electron density iteratively. As mentioned by Williamson et al.,16 the tPFM and other nonlinear DECT models cannot be factorized into atomic number- and energy-independent terms. To test the efficiencies of the BVM and tPFM DECT models, the single CPU processing time was assessed by matlab (version 12.0, The Math Works, Inc., Natick, MA) on a Windows 7® 64-bit machine with Intel Core i5 3.2 GHz and 16 GB RAM. For 34 standard human tissues, it took the BVM 0.77 s to complete the analysis, while for the VCU tPFM, the computing time was approximately 73.7 s. These results indicated that this simple linear BVM model increases the computational efficiency about 100-fold in this software environment. It is worth noting that the efficiency analysis and comparison were from the BVM and tPFM models that were not optimized. The additional computational burden could be an issue in the context of iterative, model-based reconstruction algorithm. Second, the computational advantage of the BVM is obtained without compromising accuracy, even a small margin of accuracy, relative to the tPFM models.
To our knowledge, this study is the first to estimate proton stopping power using a linear BVM model in the context of idealized DECT stopping power imaging. In order to fairly compare the BVM stopping power estimation to the tPFM model, we implemented our own VCU tPFM model using similar materials and cross sections as Yang et al. did. Yang et al. pointed out that the mean errors of the calculated EDR (electron density ratio to water) and Z* were 0.16% and 0.79%, excluding the thyroid tissue. However, in our implementation of the tPFM, the corresponding mean relative errors were 0.57% and 0.70%. Landry et al.38 presented a DECT parameterization model that related a ratio of linear attenuation at energies of 80 and 140 kVp, yielding accuracies of less than 0.3 units of Zstd for the Gammex phantom. Saito39 proposed a model that the electron density can be expressed by the weighted of the low and high kVp CT numbers. The achieved theoretical absolute error for electron density estimation is less than 0.7% for calibration phantoms.
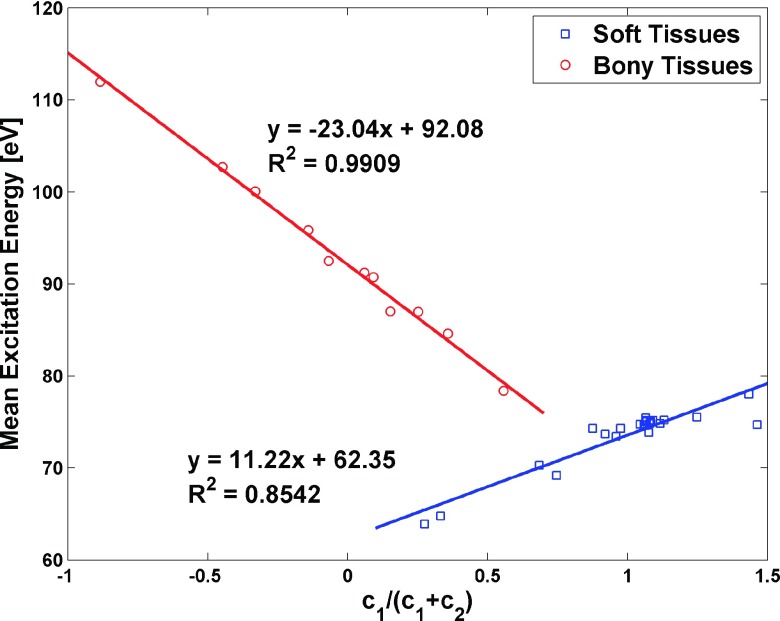
Our work also suggests that c1/(c1 + c2) is a useful surrogate for Z* on charged particle-beam dosimetry. Figure 10 indicates that, without knowledge of the effective atomic number, I-values closely adhere to a linear function of c1/(c1 + c2). The RMSE of using the relationship in Fig. 10 to estimate I-values for the proton stopping power for the same standard human tissues at 175 MeV is 0.19%, which is close to the results of 0.20% achieved using linear combination and correction method for I-values estimation for proton stopping power.
FIG. 10.
The relationship between c1/(c1 + c2) and the I-values of 34 standard human tissue is shown. There are two separate linear fits, one for soft tissues and one for bony tissues. This relationship provides an alternative method to estimate I-value without knowing the Z* of the substances.
Our proposed method of robustness analysis considered the large possible ranges of variation of tissue elemental composition data, which are believed to vary significantly for the same individuals at different ages, or in different health states, as well as between different individuals. For example, red marrow (consisting primarily of hematopoietic cells) in the skeletal tissues can convert into yellow marrow (consisting mainly of adipocytes) with advancing age. ICRU report 44 (Ref. 24) recommends modeling spongiosa as 33% cortical bone and 67% bone marrow tissues, dividing equally between red and yellow marrow by mass fraction as an approximation for humans of all ages. However, in the newborn, marrow tissue is nearly 100% red marrow, whereas in adult patients, the fraction of red vs fatty yellow marrow gradually decreases, falling to near zero in the medullary cavities of the long bones, and approaching the range of 25%–70% (Ref. 40) for elderly male patients. Another example is adipose-like tissue which is composed of an extracellular matrix supporting adipocytes. The components can have widely varying mass fractions of lipid (60%–90%)31 and water (31%–9%),31 leading to large variations in the relative number of carbon and oxygen atoms. Our robustness analysis showed that the BVM model predictions were not sensitive to the variation in compositions.
Our preliminary study of error propagation is the first investigation of the sensitivity of the proton stopping power calculation in DECT models. Although the experimental image intensity uncertainties characteristic of a clinical scanner are not available, our results indicated that DECT models’ estimation of proton stopping power are susceptible to image uncertainties and that the acceptable accuracy may not be achievable in current clinical settings. The one-to-one correspondence between the linear attenuation coefficient and proton stopping power may be affected by the uncertainties of CT measurements, including scattering and beam hardening, which may add another 1% to the measurement of uncertainty. This indicates that a more advanced algorithm may be needed to account for reduction of uncertainties in the CT image reconstruction.
It is also worth mentioning that as photon counting detector techniques develop,20,41,42 our proposed method can still find merit in energy discrimination spectral CT, in which a single scan for material decomposition is allowed.
5. CONCLUSION
We have developed a simple, linear, separable two-parameter DECT model that can estimate electron density and I-value and derive proton stopping power accurately. It supported electron density and I-value estimates with a RMSE of 0.13% and 1.56%, respectively, which yielded stopping power estimates for ICRU recommended tissue compositions with an accuracy of 0.20%. The root-mean-square error of the CSDA range prediction error of the BVM was 0.55 mm for protons with an initial energy of 175 MeV. The reported accuracy in this study may not be achievable on current clinical CT scanners. It is also worth noting that the estimated accuracy of the proton stopping power by DECT models was independent of the choice of reference values. The BVM and tPFM were found to be insensitive to variations in tissue compositions recommended by ICRU reports in proton stopping power estimation. The tPFM model showed less sensitivity to CT image uncertainties in proton stopping power estimation. Our BVM model achieved comparable accuracy with less computational cost than competing nonlinear DECT models. To our knowledge, our BVM model is the first separable, two-parameter model with a closed form numerical solution that is able to model proton stopping powers with high accuracy.
ACKNOWLEDGMENTS
This study was supported by NIH No. R01 CA149305 and Varian Medical Systems.
REFERENCES
- 1.Rutherford R. A., Pullan B. R., and Isherwood I., “Measurement of effective atomic number and electron density using an EMI scanner,” Neuroradiology 11, 15–21 (1976). 10.1007/BF00327253 [DOI] [PubMed] [Google Scholar]
- 2.Goodsitt M. M., Hoover P., Veldee M. S., and Hsueh S. L., “The composition of bone marrow for a dual-energy quantitative computed tomography technique,” Invest. Radiol. 29, 695–704 (1994). 10.1097/00004424-199407000-00006 [DOI] [PubMed] [Google Scholar]
- 3.Cann C. E., “Quantitative CT for determination of bone mineral density: A review,” Radiology 166(2), 509–522 (1988). 10.1148/radiology.166.2.3275985 [DOI] [PubMed] [Google Scholar]
- 4.Johnson T. R. C., Krauß B., Sedlmair M., Grasruck M., Bruder H., Morhard D., Fink C., Weckbach S., Lenhard M., Schmidt B., Flohr T., Reiser M. F., and Becker C. R., “Material differentiation by dual energy CT: Initial experience,” Eur. Radiol. 17(6), 1510–1517 (2007). 10.1007/s00330-006-0517-6 [DOI] [PubMed] [Google Scholar]
- 5.Evans J. D., Whiting B. R., O’Sullivan J. A., Politte D. G., Klahr P. H., Yu Y., and Williamson J. F., “Prospects for in vivo estimation of photon linear attenuation coefficients using postprocessing dual-energy CT imaging on a commercial scanner: Comparison of analytic and polyenergetic statistical reconstruction algorithms,” Med. Phys. 40(12), 121914 (16pp.) (2013). 10.1118/1.4828787 [DOI] [PMC free article] [PubMed] [Google Scholar]
- 6.Yang M., Virshup G., Clayton J., Zhu X. R., Mohan R., and Dong L., “Theoretical variance analysis of single- and dual-energy computed tomography methods for calculating proton stopping power ratios of biological tissues,” Phys. Med. Biol. 55, 1343–1362 (2010). 10.1088/0031-9155/55/5/006 [DOI] [PubMed] [Google Scholar]
- 7.Bazalova M., Carrier J. F., Beaulieu L., and Verhaegen F., “Dual-energy CT-based material extraction for tissue segmentation in Monte Carlo dose calculations,” Phys. Med. Biol. 53, 2439–2456 (2008). 10.1088/0031-9155/53/9/015 [DOI] [PubMed] [Google Scholar]
- 8.Schneider U., Pemler P., Besserer J., Pedroni E., Lomax A., and Kaser-Hotz B., “Patient specific optimization of the relation between CT-Hounsfield units and proton stopping power with proton radiography,” Med. Phys. 32(1), 195–199 (2005). 10.1118/1.1833041 [DOI] [PubMed] [Google Scholar]
- 9.Schneider U., Pedroni E., and Lomax A., “The calibration of CT Hounsfield units for radiotherapy treatment planning,” Phys. Med. Biol. 41, 111–124 (1996). 10.1088/0031-9155/41/1/009 [DOI] [PubMed] [Google Scholar]
- 10.Torikoshi M., Tsunoo T., Sasaki M., Endo M., Noda Y., Ohno Y., Kohno T., Hyodo K., Uesugi K., and Yagi N., “Electron density measurement with dual-energy x-ray CT using synchrotron radiation,” Phys. Med. Biol. 48, 673–685 (2003). 10.1088/0031-9155/48/5/308 [DOI] [PubMed] [Google Scholar]
- 11.Bourque A. E., Carrier J. F., and Bouchard H., “A stoichiometric calibration method for dual energy computed tomography,” Phys. Med. Biol. 59, 2059–2088 (2014). 10.1088/0031-9155/59/8/2059 [DOI] [PubMed] [Google Scholar]
- 12.Hünemohr N., Krauss B., Tremmel C., Ackermann B., Jäkel O., and Greilich S., “Experimental verification of ion stopping power prediction from dual energy CT data in tissue surrogates,” Phys. Med. Biol. 59, 83–96 (2014). 10.1088/0031-9155/59/1/83 [DOI] [PubMed] [Google Scholar]
- 13.Hünemohr N., Krauss B., Dinkel J., Gillmann C., Ackermann B., Jäkel O., and Greilich S., “Ion range estimation by using dual energy computed tomography,” Z. Med. Phys. 23(4), 300–313 (2013). 10.1016/j.zemedi.2013.03.001 [DOI] [PubMed] [Google Scholar]
- 14.Landry G., Parodi K., Wilderger J. E., and Verhaegen F., “Deriving concentrations of oxygen and carbon in human tissues using single- and dual-energy CT for ion therapy applications,” Phys. Med. Biol. 58, 5029–5048 (2013). 10.1088/0031-9155/58/15/5029 [DOI] [PubMed] [Google Scholar]
- 15.Hünemohr N., Paganetti H., Greilich S., Jäkel O., and Seco J., “Tissue decomposition from dual energy CT data for MC based dose calculation in particle therapy,” Med. Phys. 41, 061714 (14pp.) (2014). 10.1118/1.4875976 [DOI] [PMC free article] [PubMed] [Google Scholar]
- 16.Williamson J. F., Li S., Devic S., Whiting B. R., and Lerma F. A., “On two-parameter models of photon cross sections: Application to dual-energy CT imaging,” Med. Phys. 33, 4115–4129 (2006). 10.1118/1.2349688 [DOI] [PubMed] [Google Scholar]
- 17.Chen G. H., Tang J., and Leng S., “Prior image constrained compressed sensing (PICCS): A method to accurately reconstruct dynamic CT images from highly undersampled projection data sets,” Med. Phys. 35, 660–663 (2008). 10.1118/1.2836423 [DOI] [PMC free article] [PubMed] [Google Scholar]
- 18.Evans J. D., Whiting B. R., Politte D. G., O’Sullivan J. A., Klahr P. F., and Williamson J. F., “Experimental implementation of a polyenergetic statistical reconstruction algorithm for a commercial fan-beam CT scanner,” Phys. Med. 29, 500–512 (2013). 10.1016/j.ejmp.2012.12.005 [DOI] [PMC free article] [PubMed] [Google Scholar]
- 19.Chen Y., O’Sullivan J. A., Politte D. G., Evans J. D., Han D., Whiting B. R., and Williamson J. F., “Line integral alternating minimization algorithm for dual-energy x-ray CT image reconstruction,” IEEE Trans. Med. Imaging PP, 1 (2015), see http://ieeexplore.ieee.org/xpl/articleDetails.jsp?arnumber=7298440. 10.1109/TMI.2015.2490658 [DOI] [PMC free article] [PubMed] [Google Scholar]
- 20.Alvarez R. E. and Macovski A., “Energy-selective reconstructions in x-ray computerized tomography,” Phys. Med. Biol. 21(5), 733–744 (1976). 10.1088/0031-9155/21/5/002 [DOI] [PubMed] [Google Scholar]
- 21.Han D., Sampson A., Politte D., O’Sullivan J., Siebers J., and Williamson J. F., “Accuracy of dual-energy CT photon cross-section mapping using a non-separable two parameter cross-section model,” Med. Phys. 39(6), 3989 (2012). 10.1118/1.4736275 [DOI] [Google Scholar]
- 22.Bethe H., “Zur theorie des durchgangs schneller korpuskularstrahlen durch materie,” Ann. Phys. 397, 325–400 (1930). 10.1002/andp.19303970303 [DOI] [Google Scholar]
- 23.ICRU, “Photon electron proton and neutron interaction data for body tissues,” Report No. 46 (ICRU, Bethesda, MD, 1992). [Google Scholar]
- 24.ICRU, “Tissue substitutes in radiation dosimetry and measurement,” Report No. 44 (ICRU, Bethesda, MD, 1989). [Google Scholar]
- 25.ICRU, “Stopping powers for electrons and positrons,” Report No. 37 (ICRU, Bethesda, MD,1984). [Google Scholar]
- 26.Warren D. R., Partridge M., Hill M. A., and Peach K., “Improved calibration of mass stopping power in low density tissue for a proton pencil beam algorithm,” Phys. Med. Biol. 60, 4243–4261 (2015). 10.1088/0031-9155/60/11/4243 [DOI] [PubMed] [Google Scholar]
- 27.Rutherford R. A., Pullan B. R., and Isherwood I., “Calibration and response of an EMI scanner,” Neuroradiology 11, 7–13 (1976). 10.1007/BF00327252 [DOI] [PubMed] [Google Scholar]
- 28.Weaver J. B. and Huddleston A. L., “Attenuation coefficients of body tissues using principal-components analysis,” Med. Phys. 12(1), 40–45 (1985). 10.1118/1.595759 [DOI] [PubMed] [Google Scholar]
- 29.Berger M. J., Hubbell J. H., Seltzer S. M., Chang J., Coursey J. S., Sukumar R., Zucker D. S., and Olsen K., XCOM: Photon Cross Section Database, Version 1.5, National Institute of Standards and Technology, Gaithersburg, MD,2010.
- 30.White D. R., Woodard H. Q., and Hammond S. M., “Average soft-tissue and bone models for use in radiation dosimetry,” Br. J. Radiol. 60, 907–913 (1987). 10.1259/0007-1285-60-717-907 [DOI] [PubMed] [Google Scholar]
- 31.Woodard H. Q. and White D. R., “The composition of body tissues,” Br. J. Radiol. 59, 1209–1219 (1986). 10.1259/0007-1285-59-708-1209 [DOI] [PubMed] [Google Scholar]
- 32.White D. R., Widdowson E. M., Woodard H. Q., and Dickerson J. W. T., “The composition of body tissues. (II) Fetus to young adult,” Br. J. Radiol. 64, 149–159 (1991). 10.1259/0007-1285-64-758-149 [DOI] [PubMed] [Google Scholar]
- 33.Brožek J., Grande F., Anderson J. T., and Keys A., “Densitometric analysis of body composition: Revision of some quantitative assumptions,” Ann. N. Y. Acad. Sci. 110, 113–140 (1963). 10.1111/j.1749-6632.1963.tb17079.x [DOI] [PubMed] [Google Scholar]
- 34.Taylor B. N. and Kuyatt C. E., “Guidelines for evaluating and expressing the uncertainty of NIST measurement results,” NIST Technical Note 1297 (U.S. Government Printing Office, Washington, DC, 1994). [Google Scholar]
- 35.ICRU, “Stopping powers and ranges for protons and alpha-particles,” Report No. 49 (ICRU, Bethesda, MD, 1993). [PubMed] [Google Scholar]
- 36.Besemer A., Paganetti H., and Bednarz B., “Clinical impact of uncertainties in the mean excitation energy of human tissues during proton therapy,” Phys. Med. Biol. 58, 887–902 (2013). 10.1088/0031-9155/58/4/887 [DOI] [PMC free article] [PubMed] [Google Scholar]
- 37.Andreo P., “On the clinical spatial resolution achievable with protons and heavier charged particle radiotherapy beams,” Phys. Med. Biol. 54, N205–N215 (2009). 10.1088/0031-9155/54/11/N01 [DOI] [PubMed] [Google Scholar]
- 38.Landry G., Seco J., Gaudreault M., and Verhaegen F., “Deriving effective atomic numbers from DECT based on a parameterization of the ratio of high and low linear attenuation coefficients,” Phys. Med. Biol. 58, 6851–6866 (2013). 10.1088/0031-9155/58/19/6851 [DOI] [PubMed] [Google Scholar]
- 39.Saito M., “Potential of dual-energy subtraction for converting CT numbers to electron density based on a single linear relationship,” Med. Phys. 39(4), 2021–2030 (2012). 10.1118/1.3694111 [DOI] [PubMed] [Google Scholar]
- 40.Cristy M., “Active bone marrow distribution as a function of age in humans,” Phys. Med. Biol. 26, 389–400 (1981). 10.1088/0031-9155/26/3/003 [DOI] [PubMed] [Google Scholar]
- 41.Shikhaliev P. M. and Fritz S. G., “Photon counting spectral CT versus conventional CT: Comparative evaluation for breast imaging application,” Phys. Med. Biol. 56, 1905–1930 (2011). 10.1088/0031-9155/56/7/001 [DOI] [PubMed] [Google Scholar]
- 42.Schlomka J. P., Roessl E., Dorscheid R., Dill S., Martens G., Istel T., Bäumer C., Herrmann C., Steadman R., Zeitler G., Livne A., and Proska R., “Experimental feasibility of multi-energy photon-counting K-edge imaging in pre-clinical computed tomography,” Phys. Med. Biol. 53, 4031–4047 (2008). 10.1088/0031-9155/53/15/002 [DOI] [PubMed] [Google Scholar]


