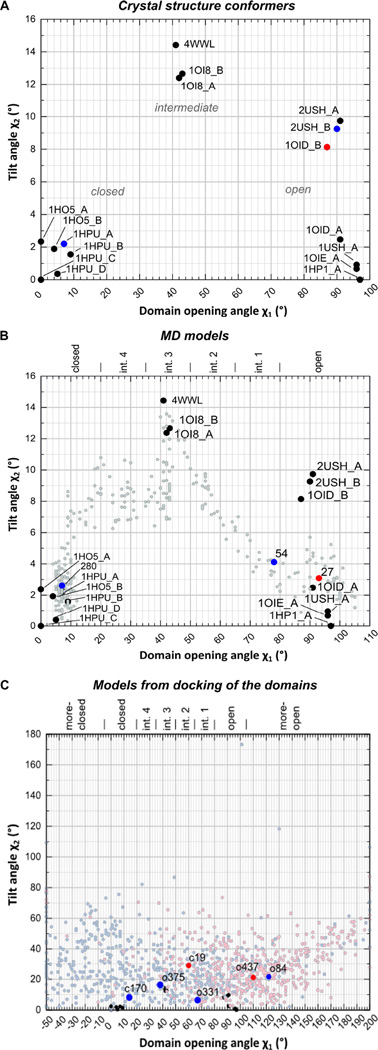
Figure 4. χ1,χ2-plots of 5NT crystal structures, MD models and models from docking of the two domains.
χ1 describes the domain opening angle on the 1HPU_C-1HP1-rotation. χ2 is the tilt angle relative to the reference state. Crystal structure conformers are shown as filled circles (black) in all panels. Conformers which were found by ensemble fitting to describe the experimental DEER distance distribution with the cone model at wE = 40 are indicated as red (apo) and blue points (ZnAMPCP) and by their model ID. In C) models from docking of the two domains were prepared with 1HPU_C (closed, light blue) and with 1HP1_A (open, light red). For definitions of the conformers in B) and C) see also Table S1, Table S2.

