Abstract
The integrity of the corticospinal system is an important biomarker for recovery from stroke. However, mapping the topography of the corticospinal system in subacute stroke is not trivial and how it changes over the course of recovery is poorly understood. We intend to use a transcranial magnetic stimulation (TMS) based mapping approach to quantify the topographic landscape of corticospinal activation in the ipsi- and contralesional sensorimotor cortices in the subacute and chronic phase of stroke. Mapping was conducted before (PRE) and after (POST), intervention in 10 chronic subjects and 8 subacute subjects. Reorganization was quantified in a unique way by dissociating reorganization attributed to changes in the expanse (area) of the sensorimotor territory, from that attributed to changes in the robustness of the activation (amplitude). In doing so, we observed differences in reorganization in the subacute and chronic stages indicating that recovery in different stages may not be guided by similar neurophysiological mechanisms of neuroplasticity.
Index Terms: stroke, transcranial magnetic stimulation, brain reorganization, hand rehabilitation
I. Introduction
Physical disability after stroke is overwhelming and highly prevalent worldwide. According to the World Health Organization, 15 million people have a stroke each year, leaving 5 million survivors permanently disabled. The Centers for Disease Control & Prevention estimate that > 5.3 million Americans currently require long-term or lifelong aid for activities of daily living as a result of the stroke. Animal models of neural pathology and recovery have identified key biomarkers that are amenable to intervention. However, this is relatively poorly understood in humans, especially in the acute and subacute periods after stroke.
Transcranial magnetic stimulation (TMS) induced motor evoked potentials (MEP) are an established proxy of corticospinal excitability. Studies analyzing MEP amplitude as a univariate measure unequivocally show that the presence and magnitude of MEPs is a robust prognostic of long-term recovery in stroke [1, 2]. However, analogous to other imaging modalities, intensity of activation at a single spatial locus reveals only part of the story. The distribution or pattern of activation across a region is equally important. Recently in this vein, MEPs have been acquired in a gridded patch over the sensorimotor cortex such that the two-dimensional position of the coil over the scalp can be used to generate a multivariate excitability map, akin to that found in fMRI analyses. Of the searched stroke literature, three studies have used TMS based mapping in chronic stroke patients to quantify the recovery of the corticospinal system [3–5]; all noting an increase in the peak MEP and area of MEPs representing the hand in the ipsilesional sensorimotor cortex. A fourth study acquiring TMS based maps 4–12 days post sub-cortical stroke and one month thereafter had a similar result in the ipsilesional hemisphere, and also assayed the contralesional hemisphere finding that increased excitability in the acute stage after stroke has a negative association with recovery of the impaired hand [6]. Therefore, although TMS mapping is a promising biomarker of corticospinal integrity and recovery, there remains a dearth of literature on the topic and no single controlled study comparing the trajectory of neural recovery in both subacute and chronic patients. Therefore, the overarching goal of this project was to longitudinally quantify unique patterns of neural reorganization in relation to the stage post-stroke, setting a foundation for empirically-grounded intervention studies. We used a novel approach to map the corticospinal system, and demonstrate in our pilot data that intervention-induced reorganization of cortical topography occurs in a fundamentally different manner, depending on whether it is administered in the subacute versus the chronic phase after stroke.
II. Setup and Procedures
A. Subjects
Stroke subjects between the ages of 30–80 were recruited from regional medical centers, university hospitals, and support groups. Ten subjects in the chronic group were at least 6 months after a first time stroke; six subjects in the subacute group were recruited between 5 and 21 days after a first time stroke. All subjects were required to have at least 15° of active finger motion (moderately impaired movement), spasticity of <3 on the Modified Ashworth Spasticity Scale, normal or corrected-to-normal vision, be free of language, visuospatial or cognitive deficits, and not clinically depressed at the time of recruitment. Patients with stroke due to trauma were excluded due to diffuse nature of brain injury. Chronic subjects were excluded if receiving any form of therapy. Handedness was recorded [7] but was not used as an exclusion criteria. Prior to training subjects were tested on the upper extremity portion of the Fugl-Meyer Assessment (FM) [8].
B. Training Protocol
All subjects in the chronic group received intensive upper extremity training for 2 – 2.5 hours/day for 5 days/week for two weeks (see [9],[10] for details). All subacute subjects received 60 minutes/day of upper extremity training of matched intensity for 5 days/week for two weeks. This training was in addition to on-going usual care, comprised of in/outpatient physical, occupational and speech therapy.
C. TMS Mapping
Subjects were tested one day before the therapy onset and one day after the end of the therapy. Subjects were seated with their arm, hand, and fingers comfortably secured in a brace to limit motion. To assure spatial TMS precision, each subject’s high-resolution anatomical MRI was used to render a 3D cortical surface that is co-registered with the subject’s head for frameless neuronavigation (Advanced Neuro Technology). Transcranial Magnetic Stimulation (TMS) (Magstim Rapid2, 70mm double coil) was used to determine the hotspot for the contralateral first dorsal interosseus muscle [FDI]. The TMS coil was held tangential to the scalp with the handle posterior 45° off the sagittal plane [11]. Following determination of the FDI hotspot resting motor threshold (RMT) was calculated as the minimum intensity required to elicit MEPs >50µV in the FDI muscle on 50% of 6 consecutive trials [12]. Surface electromyographic activity (EMG, Delsys Trigno, 2 kHz) was recorded from the FDI muscles of the limb contralateral to stimulation side.
Mapping was conducted on the lesioned hemisphere of the chronic and subacute group as well as contralesional hemisphere of the subacute group. All mapping was performed with the subject at rest and stimulation intensity set to 110% of the determined RMT [13]. A 10×10cm area surrounding the motor hotspot was marked using the neuronavigation software to provide consistent map boundaries. TMS pulses were delivered within the bounds with special attention paid to regions surrounding the hotspot territory. Real time visual feedback of the MEP time traces and neuronavigated coil position provided to the experimenter during testing maximized the map information obtained by allowing for increased density of points in excitable and border regions, with less attention given to far-away non-responsive areas [14].
III. Data Analysis
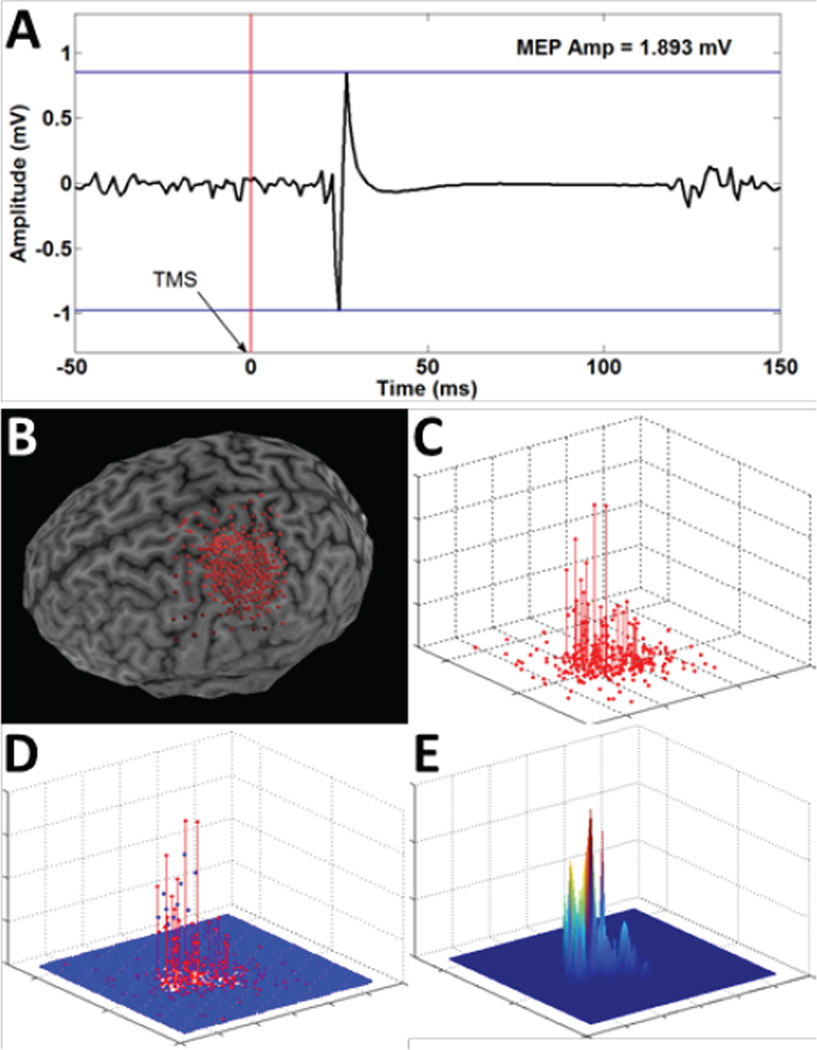
For each stimulation point we computed the following measures: (i) MEP as the peak-to-peak amplitude of the EMG signal 20–50ms after the TMS pulse, and (ii) background EMG, calculated as the EMG signal in the 50ms interval before the TMS pulse (2nd order Butterworth filter, 5–250 Hz band-pass, full-wave rectified, 20Hz low-pass envelope). A threshold of 50uV was used to identify MEPs from background EMG [13]. To allow comparisons across maps and sessions, MEP amplitudes and stimulation points were interpolated to a 10×10 cm mesh of 5 mm resolution centered on the M1 hotspot, using cubic surface interpolation [15, 16]. Outcome measures include mean amplitude of active MEPs [5, 13] and map area, determined using double trapezoidal integration of the interpolated maps (see Figure 1). FM scores were compared between chronic and subacute subjects using an independent samples t-test.
Figure 1.
A graphical depiction of the analysis of MEP maps showing calculation of: (A) MEP signal and peak-to-peak amplitude; (B) neuronavigation data; (C) a stem plot of MEP amplitudes at each stimulation site; (D) cubic interpolation of MEP maps (5mm mesh); (E) creation of a contour surface map.
IV. Results
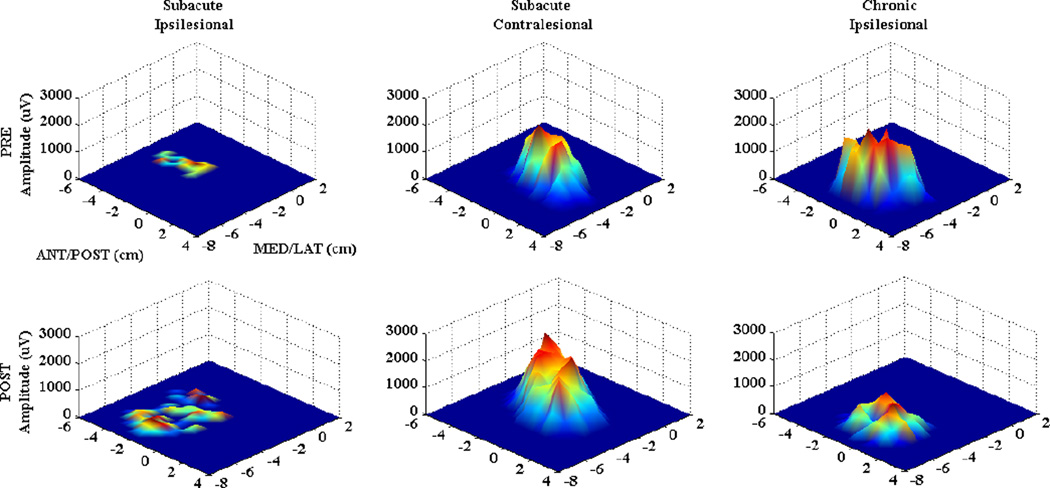
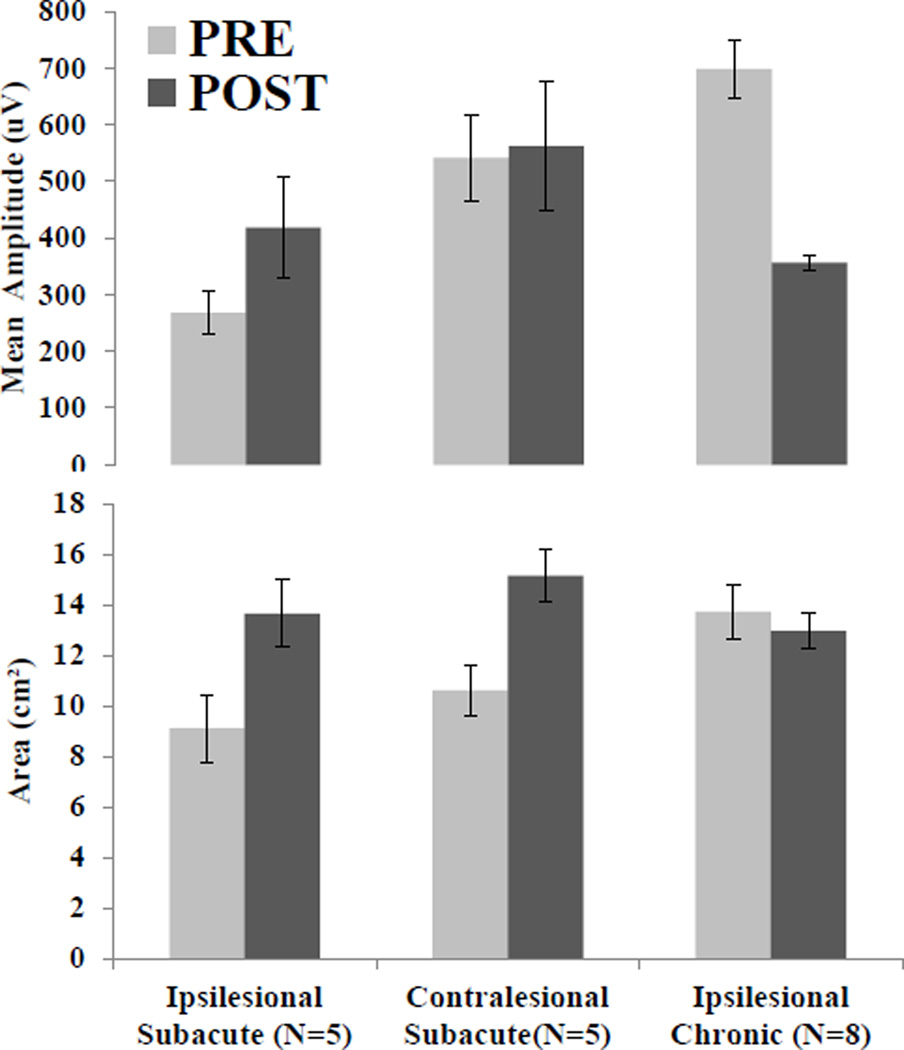
Sixteen individuals with stroke (subacute: n=8, FM=43.8±13.1; chronic: n=8, FM=49.3±8.2) participated after providing consent approved by Rutgers University, NJIT and St. Joseph’s Hospital IRBs. We were unable to elicit MEPs from the ipsilesional hemisphere of 3 of the 8 subacute subjects, and their data were excluded from analysis. There was no significant difference between groups on upper limb FM score prior to training (p=.38). Figure 2 illustrates in a representative subacute stroke subject that the ipsilesional sensorimotor territory representing the affected FDI muscle increased dramatically immediately after of the intervention. The territory on the contralesional side representing the less affected limb also increased after the intervention. Conversely the chronic subject had little area change and a decrease in the amplitude of activation on the ipsilesional hemisphere. Figure 3 illustrates the group means for map amplitude and area. A 2×2 mixed model ANOVA on mean amplitude revealed no significant effect of intervention (PRE,POST F(1,11)=.562, p=.469) or group (Subacute, Chronic F(1,11)=1.893, p=.196) and trend level significance of intervention-group interaction (F(1,11)=3.201, p=.100). Identical statistical testing on map area revealed no significance for intervention (F(1,11)=1.949, p=.190), group F(1,11)=.294, p=.599), or intervention-group interaction F(1,11)=.398, p=.541).
Figure 2. Single Subject Data.
MEP maps for the first dorsal interosseous (FDI) muscle in a representative subacute stroke subject (ipsilesional hemisphere (left), contralesional hemisphere (middle)) and chronic subject (ipsilesional hemisphere (right), acquired PRE (top row), and post (bottom row) intervention. X, Y axes represent medial-lateral and anterior-posterior directions, respectively. MEP amplitude is presented in microvolts (uV) on the Z axis. Ipsilesional changes in the subacute subject are characterized by increased amplitude and area, while chronic subject map shows decreased amplitude over a similar area.
Figure 3. Group Mean Data.
MEP map assessments in terms of map mean amplitude (top) and area (bottom). Note the different patterns of change between hemispheres and groups. Only the ipsilesional hemisphere of the subacute group changes in both amplitude and area.
V. Discussion
These data suggest that in the days following stroke, recovery may be associated with an expansion of the corticospinal network (area) and strengthening of corticospinal synaptic weights (amplitude). Conversely, cortical changes in the chronic phase of stroke seem to entail a possible re-weighting of synaptic connections as new corticospinal synergies develop, leading to a downsizing of the MEP map amplitude even though the footprint of the activated territory remains largely preserved. Though only marginal significance was found, these data present preliminary evidence for the presence of different mechanisms of cortical reorganization with intervention in the subacute and chronic phases of stroke recovery. This result is consistent with current theory that functional improvements in chronic phase of stroke may be more indicative of compensations than recovery due to decreased capacity for reorganization [17]. Discriminating spontaneous recovery and recovery due to intervention in the subacute group is not possible in the current data set, and will be the subject of future investigation.
Acknowledgment
We would like to thank Gerard Fluet, Anita Van Wingerden, Jigna Patel and Qinyin Qui for their assistance with administering the intervention.
This work was supported in part by NIH grants K01 HD059983 (ET), R01 NS085122 (ET), and R01 HD58301 (SA).
Contributor Information
Mathew Yarossi, Rutgers Biomedical and Health Sciences, Newark, NJ, 07107 (973-617-6101:, yarossmb@shrp.rutgers.edu).
Sergei Adamovich, New Jersey Institute of Technology, Newark, NJ 07102, USA and with Rutgers Biomedical and Health Sciences, Newark NJ 07107, (sergei.adamovich@njit.edu).
Eugene Tunik, Rutgers Biomedical and Health Sciences, Newark, NJ, 07107 (tunikeu@rutgers.edu).
References
- 1.Koski L, Mernar TJ, Dobkin BH. Immediate and long-term changes in corticomotor output in response to rehabilitation: correlation with functional improvements in chronic stroke. Neurorehabil Neural Repair. 2004;18(4):230–249. doi: 10.1177/1545968304269210. [DOI] [PubMed] [Google Scholar]
- 2.Bembenek JP, et al. The prognostic value of motor-evoked potentials in motor recovery and functional outcome after stroke - a systematic review of the literature. Funct Neurol. 2012;27(2):79–84. [PMC free article] [PubMed] [Google Scholar]
- 3.Liepert J, et al. Training-induced changes of motor cortex representations in stroke patients. Acta Neurol Scand. 2000;101(5):321–326. doi: 10.1034/j.1600-0404.2000.90337a.x. [DOI] [PubMed] [Google Scholar]
- 4.Bastings EP, Greenberg JP, Good DC. Hand motor recovery after stroke: a transcranial magnetic stimulation mapping study of motor output areas and their relation to functional status. Neurorehabil Neural Repair. 2002;16(3):275–282. doi: 10.1177/154596802401105207. [DOI] [PubMed] [Google Scholar]
- 5.Butler AJ, Wolf SL. Putting the brain on the map: use of transcranial magnetic stimulation to assess and induce cortical plasticity of upper-extremity movement. Phys Ther. 2007;87(6):719–736. doi: 10.2522/ptj.20060274. [DOI] [PubMed] [Google Scholar]
- 6.Chieffo R, et al. Mapping early changes of cortical motor output after subcortical stroke: a transcranial magnetic stimulation study. Brain Stimul. 2013;6(3):322–329. doi: 10.1016/j.brs.2012.06.003. [DOI] [PubMed] [Google Scholar]
- 7.Oldfield RC. The assessment and analysis of handedness: the Edinburgh inventory. Neuropsychologia. 1971;9(1):97–113. doi: 10.1016/0028-3932(71)90067-4. [DOI] [PubMed] [Google Scholar]
- 8.Fugl-Meyer AR, et al. The post-stroke hemiplegic patient. 1. a method for evaluation of physical performance. Scandinavian journal of rehabilitation medicine. 1974;7(1):13–31. [PubMed] [Google Scholar]
- 9.Merians AS, et al. Sensorimotor training in a virtual reality environment: does it improve functional recovery poststroke? Neurorehabil Neural Repair. 2006;20(2):252–267. doi: 10.1177/1545968306286914. [DOI] [PubMed] [Google Scholar]
- 10.Fluet GG, Deutsch JE. Virtual Reality for Sensorimotor Rehabilitation Post-Stroke: The Promise and Current State of the Field. Curr Phys Med Rehabil Reports. 2013;1(1):9–20. doi: 10.1007/s40141-013-0005-2. [DOI] [PMC free article] [PubMed] [Google Scholar]
- 11.Littmann AE, McHenry CL, Shields RK. Variability of motor cortical excitability using a novel mapping procedure. J Neurosci Methods. 2013;214(2):137–143. doi: 10.1016/j.jneumeth.2013.01.013. [DOI] [PMC free article] [PubMed] [Google Scholar]
- 12.Butler AJ, et al. Finger extensor variability in TMS parameters among chronic stroke patients. J Neuroeng Rehabil. 2005;2:10. doi: 10.1186/1743-0003-2-10. [DOI] [PMC free article] [PubMed] [Google Scholar]
- 13.Ngomo S, et al. Comparison of transcranial magnetic stimulation measures obtained at rest and under active conditions and their reliability. J Neurosci Methods. 2012;205(1):65–71. doi: 10.1016/j.jneumeth.2011.12.012. [DOI] [PubMed] [Google Scholar]
- 14.Niskanen E, et al. Group-level variations in motor representation areas of thenar and anterior tibial muscles: Navigated Transcranial Magnetic Stimulation Study. Hum Brain Mapp. 2010;31(8):1272–1280. doi: 10.1002/hbm.20942. [DOI] [PMC free article] [PubMed] [Google Scholar]
- 15.Borghetti D, et al. Transcranial magnetic stimulation mapping: a model based on spline interpolation. Brain Res Bull. 2008;77(2–3):143–148. doi: 10.1016/j.brainresbull.2008.06.001. [DOI] [PubMed] [Google Scholar]
- 16.Weiss C, et al. Mapping the hand, foot and face representations in the primary motor cortex - Retest reliability of neuronavigated TMS versus functional MRI. Neuroimage. 2012;66C:531–542. doi: 10.1016/j.neuroimage.2012.10.046. [DOI] [PubMed] [Google Scholar]
- 17.Krakauer JW. Arm function after stroke: from physiology to recovery. Semin Neurol. 2005;25(4):384–395. doi: 10.1055/s-2005-923533. [DOI] [PubMed] [Google Scholar]


