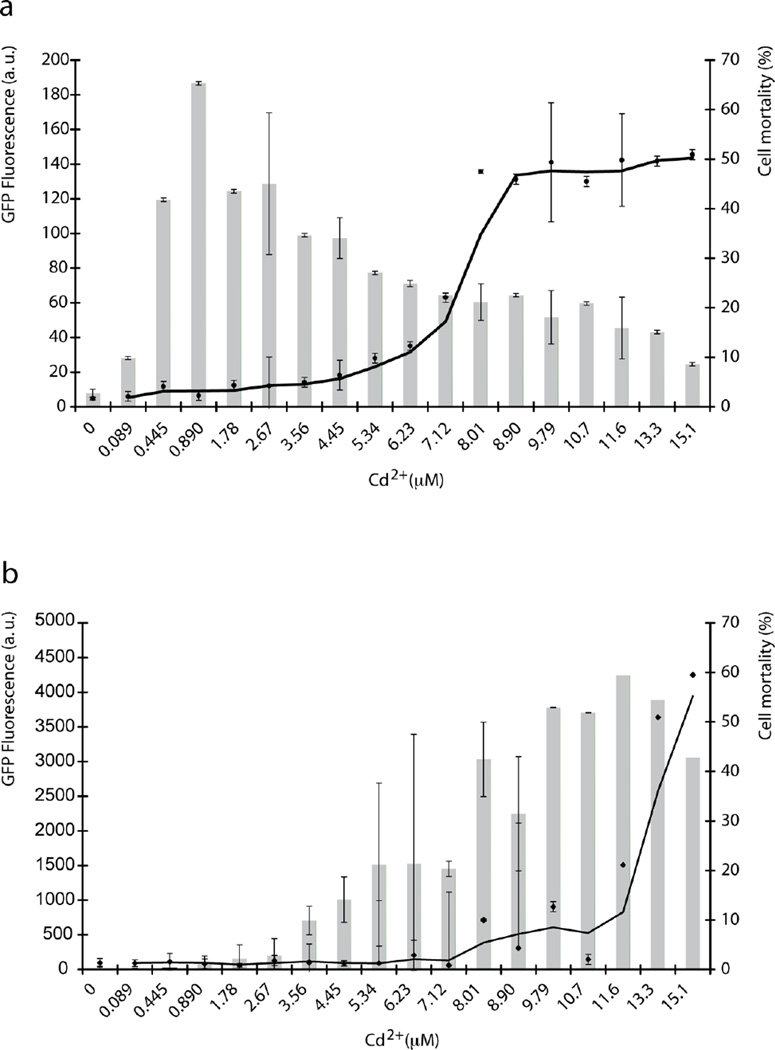
Fig. 3.
Flow cytometry analysis (histograms) of the GFPMTT5 strain exposed to different Cd2+ concentrations (89 nM – 15 µM). (a) 2h or (b) 24h treatment. GFP fluorescence was quantified in arbitrary units (au). Continuous line represents the % of cell mortality. Data are the average of three different experiments. Error bars represent the standard deviation.

