

Abstract
Nano-enabled products (NEPs) are currently part of our life prompting for detailed investigation of potential nano-release across their life-cycle. Particularly interesting is their end-of-life thermal decomposition scenario. Here, we examine the thermal decomposition of a widely used NEP, namely thermoplastic nanocomposites, and assess the properties of the byproducts (released aerosol and residual ash) and possible environmental health and safety implications. We focus on establishing a fundamental understanding on the effect of thermal decomposition parameters, such as polymer matrix, nanofiller properties, decomposition temperature, on the properties of byproducts using a recently-developed lab-based experimental integrated platform. Our results indicate that thermoplastic polymer matrix strongly influences size and morphology of released aerosol, while there was minimal but detectable nano-release, especially when inorganic nanofillers were used. The chemical composition of the released aerosol was found not to be strongly influenced by the presence of nanofiller at least for the low, industry-relevant loadings assessed here. Furthermore, the morphology and composition of residual ash was found to be strongly influenced by the presence of nanofiller. The findings presented here on thermal decomposition/incineration of NEPs raise important questions and concerns regarding the potential fate and transport of released engineered nanomaterials in environmental media and potential environmental health and safety implications.
Keywords: life cycle assessment, incineration, nano-EHS, nanotechnology, aerosol
1. Introduction
Consumer products containing nanostructured materials (so-called nano-enabled products, NEPs) have already been in the market for decades for commodities such as car tires, paints, sunscreens, to name a few [1-3]. Due to the unique advantages that nanotechnology may offer in terms of products performance at limited cost, industry has recently shifted towards the incorporation of engineered nanomaterials (ENMs) in a variety of other products, such a toners [4] for printing equipment, building materials [5] and cosmetics [6]. This exponential expansion of NEPs makes human exposure to ENMs inevitable [7].
During the last decade there has been a great effort and numerous studies aiming to understand the bio-nano interactions and potential adverse health effect of ENMs in the emerging field of “nanotoxicology” [8]. In such studies, typically the pristine, raw ENMs are investigated in vitro and at a lesser extent in vivo. Several reports show that such materials may exhibit enhanced adverse effects when compared to their larger counterparts mostly attributed to their small size and large surface-to-volume ratio [7,9-15].
Both risk assessors and industry are struggling with the fact that most of the nano-environmental health and safety (nano-EHS) data focus on the pristine (raw) ENMs rather than impacts associated with NEPs across their life-cycle and in particular during consumer use and disposal at their end-of-life during thermal decomposition/incineration. Furthermore, there is limited understanding on release mechanisms and properties of released particles throughout the NEP life span which may or may not contain the ENMs used in its synthesis [16]. This important knowledge gap has been recently emphasized in both the National Research Council report as well the National Nanotechnology Initiative's strategy on nano-EHS [17-18]. More importantly, it impedes public health assessors from addressing nano related risk issues and discourages industry from exploring the ocean of nanotechnology applications.
The end-of-life scenario of NEPs is of particular interest and raises concerns of a possible emerging nano-waste problem from the resulting byproducts of such a process. Recent studies on the material flows of ENMs through society indicate that 60-80% of all ENMs end up in landfills and approximately 9,000 metric tons/year end up in incineration facilities [19]. Additionally the use of ENMs in building materials and furnishings and other products commonly found in the built environment, raises concerns on the implications of incidental fires in the built environment. Therefore, the thermal decomposition/incineration of NEPs raises important questions and concerns regarding the fate and transport of released ENMs in environmental media and potential EHS implications. However, very little is known on the release and potential transformation of ENMs during this thermal process. The limited literature on the thermal decomposition of NEPs focuses on either pristine, raw ENMs[20] or nanoparticle-spiked waste [21], while most focus lies on the particle size and concentration of the released aerosol from the thermal decomposition of nanocomposites [22-26]. Furthermore, there is a lack of a fundamental understanding on the thermal decomposition process of NEPs and the potential nano-release that might occur during this process. More specifically, nanofiller-specific effects, effects of thermal decomposition conditions (i.e. temperature, residence time), and the role of NEP matrix and their impact on the physicochemical properties of the released byproducts need to be assessed and linked to potential toxicological implications in order to facilitate safer by design approaches.
Recently, a standardized, versatile and reproducible integrated exposure generation system (INEXS) that allows for the systematic physicochemical and toxicological characterization of the thermal decomposition of NEPs was developed by the authors (Supporting Information, Scheme S1) [27]. The developed methodology allows for the real-time in situ monitoring of the released aerosol (size, concentration, composition) while it also facilitates the collection of size-fractionated released aerosol using the compact cascade impactor (CCI) [28] for ex situ detailed physicochemical and toxicological characterization. Furthermore, the residual ash may also be collected and further evaluated in terms of its properties and fate and transport in environmental media.
Here, a systematic investigation on the thermal decomposition of one of the most widely used industry-relevant family of NEPs, namely thermoplastic polymer nanocomposites, and using a variety of inorganic and organic nanofillers (Table 1 and Figures S1 and S2 in Supporting Information), is performed using the above mentioned methodology [27]. The investigated nanofillers were based on a priority-driven selection for industry-relevant thermoplastics. The target of this study is to obtain a fundamental understanding on the parameters that govern the thermal decomposition of NEPs and decipher their effect on the physicochemical properties of the byproducts, rather than merely simulating the combustion process of industrial incineration facilities. We choose such thermoplastics with controlled composition instead of real waste materials in order to have a fine control over their chemical composition that will facilitate us to link the properties of the byproducts to the materials used in the NEP synthesis. Such an approach also enables a systematic investigation by changing synthesis parameters such as nanofiller loading and matrix and will help in understanding which parameters affect the release of ENMs and properties of by products. Figure 1 shows a schematic of the integrated study design. Thermal decomposition of NEP will generate two main solid byproducts: the released aerosol and the residual ash. Exposure to both of these byproducts may occur to professionals (e.g. incineration facilities employees, fire fighters) or to consumers (e.g. from incidental fires). Furthermore, the residual ash will also be disposed in landfills further raising questions regarding possible nano-release in environmental media and subsequent ecotoxicity. Ultimately, the release mechanisms and toxicological properties will be linked to both thermal decomposition parameters as well as the properties of matrix and ENMs used in the synthesis of NEPs. Both the generated data and developed methods are of paramount importance in addressing life-cycle EHS implications of NEPs. It will also facilitate the development of safer-by-design [10,29] NEP approaches and exposure control practices. More importantly, risk assessors will use the data and regulate risks not on the “raw” ENM toxicological properties but based on actual exposures and associated toxicological properties of byproducts.
Table 1.
Summary of all nano-enabled products (NEPs) analyzed in this study along with the main results regarding the yield, the EC/OC content as well as the Fe content for both the released aerosol and the residual ash.
| NEPs | released aerosol | residual ash | |||||||||||||||||
|---|---|---|---|---|---|---|---|---|---|---|---|---|---|---|---|---|---|---|---|
| 500 °C | 800 °C | 500 °C | 800 °C | ||||||||||||||||
| yield (%) | EC (%) |
OC (%) |
Fe (wt%)b |
yield (%) | EC (%) |
OC (%) |
Fe (wt%)b |
||||||||||||
| sample ID |
filler | size (nm) |
loading (wt%) |
PM0.1 | PM0.1-2.5 | PM0.1 | PM0.1-2.5 | yield (%) |
EC (%) |
OC (%) |
Fe (wt%)b |
yield (%) |
Fe (wt%)b |
||||||
| PU | - | - | - | 1.65 | 0.44 | 0.9 | 99.1 | - | 3.41 | 1.07 | 0.8 | 99.2 | - | 5.0 | 84.9 | 15.1 | - | - | - |
| PU-CB | CB | 50-100 | 0.09 | 3.61 | 1.09 | 0.6 | 99.4 | - | 2.96 | 0.79 | 0.7 | 99.3 | - | 4.0 | 76.5 | 23.5 | - | - | - |
| PU-CNT | CNT | 10a | 0.09 | 4.04 | 0.93 | 0.7 | 99.3 | - | 3.64c | 1.84 | 0.9 | 99.1d | - | 6.1 | 82.1 | 17.9 | - | - | - |
| PE | - | - | - | 4.08 | 3.66 | 0.4 | 99.6 | - | 3.46 | 3.25 | 0.3 | 99.7 | - | 0.9 | 78.2 | 21.8 | - | - | - |
| PE-Fe2O3 | Fe2O3 | 50-100 | 4 | 2.77 | 0.74 | 0.3 | 99.7 | 0.004 | 1.46 | 1.60 | 0.3 | 99.7 | 0.026 | 3.9 | - | - | 74.5 | 3.9 | 77.3 |
| PE-org. | Org. pigm. | 50-100 | 0.2 | 3.29 | 0.90 | 0.3 | 99.7 | - | 2.66 | 0.63 | 0.4 | 99.6 | - | 1.0 | 75.0 | 25.0 | - | - | - |
PU: polyurethane, CB: carbon black, CNT: carbon nanotube, PE: polyethylene, Org: organic pigment Red 254, EC: elemental carbon, OC: organic carbon
size corresponds to diameter,
measured by ICP-MS,
standard deviation of 3 independent measurements: 1.4%,
standard deviation of 3 independent measurements: 0.2%.
Figure 1.

Schematic of the integrated approach for the investigation of the thermal decomposition of nano-enabled products. The products consists of nanofillers (e.g. CNTs, Fe2O3). After the consumer use the products reaches its end-of-life by thermal decomposition generating two particulate byproducts, the released aerosol and the residual ash. Exposure to these byproducts might occur to both professionals and consumers. The residual ash might end up in landfills further raising questions regarding its fate and transport to the environment.
2. Materials & Methods
Organic pigment Red 254 is a highly transparent and saturated diketo-pyrrolo-pyrrole (CAS-Nr = 84632-65-5, TEM diameter = 26 nm, BET surface = 94 m2/g, see Figure S1 in Supporting Information), well suited for automotive effect finishes and produced by BASF, while the Pigment Red 101 (CAS-Nr. = 1309-37-1, TEM diameter = 32 nm, BET surface = 30 m2/g) is an iron oxide (Fe2O3) inorganic pigment with extremely fine particles for coatings with highest fastness to weathering such as wood stains for outdoor use or automotive effect coatings. Both are marketed as “transparent” pigments in the sense that it is possible to achieve high transparency with low light scattering (as is normally achieved only for molecularly dissolved dyes), but still to retain the fastness and light stability advantages of particulates (pigments). The pigments were dispersed at 10% in a LDPE masterbatch, then melt-dispersed into HDPE at 2.5kg/h through a ZSK 18 twin-screw extruder at 250 °C, 28 bar, 300 rpm, and cut into granulates. These granulates were used for incineration experiments. Final parts (e.g. automotive exterior mouldings) for the automotive industries are produced from re-melting the same granulates and injection moulding (Figure S1a in Supporting Information). The HDPE polymer matrix is M80064 (SABIC), a high density polyethylene injection moulding grade with a narrow molecular weight distribution with tensile stress at yield of 32Mpa (ISO 527-2).
Polyurethane (PU) was synthesized via a prepolymer process. Chemtura Prepolymer Adiprene LF 930 and Ethacure 300 as chain extender are mixed thoroughly to produce cast PU. The nanoparticles used are MWNTs NC 7000 from Nanocyl. Synthesis of PU-CNT nanocomposites were carried out in two-steps process as follows. First, CNTs were added to prepolymer heated at 80 °C and mechanically stirred for 15 min at high shear of 2000 tr/min. At the second stage, a calculated amount of curative was added to the prepolymer nanocomposite and mixed again for one minute. The final mixture is degassed for one additional minute and poured in open mold at 100 °C to crosslink in 30 min and postcure in 20 hours. The final CNT concentration is 0.09 wt%. The CNT dispersion in the PU matrix was evaluated by TEM of thin slices of the nanocomposites obtained by cryomicrotome (-140 °C) (Figure S2 in Supporting Information).
The thermal decomposition experiments were carried out in a recently developed from our group integrated exposure generation system [27]. In brief, this system consists of a tube furnace in which the thermoplastic polymer nanocomposite is placed in the form of pellets (∼10 mm3). The temperature and heating rate in the tube furnace is precisely controlled up to 500 and 800 °C (10 °C/min) such as to examine two temperatures: one below and one above the full decomposition of the polymer matrixes. The released aerosol is then guided to an array of in situ real-time measurements for its particle concentration and size (after 100 dilution (either with a Dekatti rotating disk diluter or a TSI aerosol diluter depending on the following instrument) and measured with SMPS and APS, both TSI). The released aerosol is also collected using the Harvard CCI [28] and size-fractionated to PM0.1, PM0.1-2.5 and PM2.5-10.
The released aerosol and residual ash were characterized in detail by scanning electron microscopy (SEM, Supra55VP field emission microscope equipped with energy dispersive X-ray spectrometer - EDX) and transmission electron microscopy. The samples were imaged by transmission electron microscopy (TEM) using a Tecnai Osiris machine (FEI Company, Hillsboro, USA) operated at 200 keV under bright-field (BF) conditions. Images were evaluated using the iTEM (Olympus, Tokyo, Japan, version: 5.2.3554), and TIA (FEI, version: 4.1.202) software packages. For the TEM analysis of the released aerosol, TEM grids were placed in the corresponding CCI stages. The elemental carbon/organic carbon (EC/OC) content was determined by gas chromatography/mass spectrometry and the elemental analysis by magnetic sector field inductively coupled plasma mass spectrometry (ICP-MS) following published protocols [30-31]. One-dimensional proton nuclear magnetic resonance (1-D 1H-NMR) spectroscopy was also applied to characterize the chemical content of the organic carbon from the released aerosol [27,32]. Briefly, 1H-NMR spectra were obtained in deuterated dimethylsulfoxide (DMSO; (CD3)2SO) containing 1% v/v tetramethylsilane (TMS-d12) on a Bruker Avance 500 MHz instrument equipped with a 5 mm double resonance broad band (BBFO Plus Smart) probe at 298K with 8,192 scans. Thermogravimetric analysis coupled with Fourier-Transform infrared spectroscopy of the decomposition products in the off stream (TGA-FTIR, Netzsch-Proteus) was performed and compounds were identified by an automated fingerprinting analysis (Omnic software). The decomposition was performed under parameters adjusted to be as similar as possible to the developed methodology experiments: 30 mg of thermoplastic in an Al2O3 crucible, 5 K/min heating rate under air. FTIR spectra were selected at times just before the onset of the characteristic CO peak, in analogy to the peak emission of particulate matter as observed in the INEXS.
X-ray diffraction (XRD) patterns for the raw Fe2O3 nanofiller, PE-Fe2O3 nanocomposite, and residual ash at Td = 500 and 800 °C were collected using synchrotron-based XRD as the Stanford Synchrotron Radiation Lightsource (SSRL) on Beamline 11-3. Incident X-rays (0.9744 Å, 12735 eV) were focused using a bent cube-root I-beam Si(311) monochromator. A MAR345 Imaging Plate, 345 mm diameter, detector was positioned 150 mm downstream of the sample and was used to collect diffraction scans with a dwell time of 30 s. The collected images were calibrated and radially integrated using the program WxDiff- Diffraction Imaging Analysis Software (version 1.19) (SSRL). Crystal structures were determined through peak matching using PANalytical X'Pert HighScore.
3. Results and Discussion
3.1 Morphology of released aerosol
Aerosol constitutes a major byproduct from the thermal decomposition of polymer nanocomposites. Figure 2 shows the released aerosol particle concentration after 100 times dilution (black lines) over time for the PU- (a,b) and PE-based (c,d) thermoplastic nanocomposites for two different final decomposition temperatures (Td,final, red dotted lines) of 500 (a,c) and 800 °C (b,d). The particle number concentration reaches maximum values at about 400 - 450 °C independent of the thermoplastic material, filler and Td,final. This indicates that the heating rate does not strongly influence the thermal decomposition and neither does the presence of the nanofiller, at least at the loadings and nanocomposites investigated here. It is evident that the released aerosol particle number concentrations is dominated by the thermoplastic matrix and there is no nanofiller-specific effect observed here.
Figure 2.
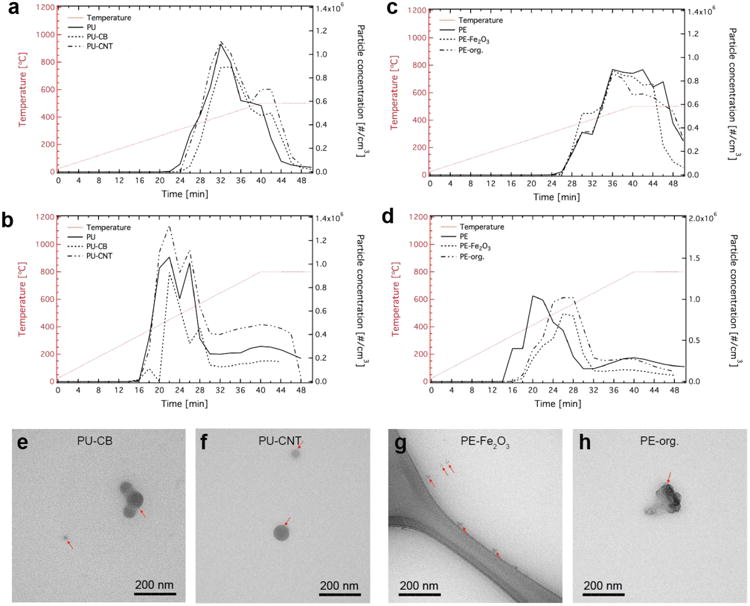
Released aerosol particle concentration and size. The particle concentration over time for PU-based (a,b) and PE-based (c,d) thermoplastics at two final decomposition temperatures Td,final = 500 (a,c) and 800 °C (b,d). TEM images of in situ collected released aerosol particles from PU-CB (e), PU-CNT (f), PE-Fe2O3 (g) and PE-org. (h).
Furthermore, mass particle size distributions show that most released particles lie by in the nanoscale size regime for the whole duration of the thermal decomposition (Supporting Information, Figure S3) with lower mass fraction in the PM0.1-2.5 and PM2.5-10 range (Supporting Information, Figure S4), typical for aerosols made by combustion processes [21,33]. Electron microscopy analysis of the in situ collected released aerosol also reveals that these particles are mostly spherical in shape, indicative of the formation by homogeneous nucleation of released gases [34]. It is worth noting that there are no significant differences among the samples with different nanofillers from the same thermoplastic matrix. For example, Figure 2 shows the released PM0.1 size fraction from the thermal decomposition at Td,final = 800 °C from PU-CB (e), PU-CNT (f), PE-Fe2O3 (g) and PE-org. (h) which exhibit similar features for all (highlighted by the red arrows). Further electron microscopy images from the aerosol released from other samples at all examined conditions exhibit similar morphology. This further indicates that the morphology and size of the released aerosol is dictated by the thermoplastics matrix, while the nanofillers, if any, play only a minor role for the decomposition of nanocomposites at the low filler loadings investigated here.
3.2 Nanofiller release during thermal decomposition
It should be noted that there were no nanofillers detected by electron microscopy in the released aerosol for all size ranges (PM0.1, PM0.1-2.5, and PM2.5-10) and conditions for all NEPs studied here but one (case of Fe filler). This may also be verified by the elemental analysis of the released aerosol. For example, by detecting the presence of Al (that is used as catalyst for the CNT manufacture) in the released aerosol from the PU-CNT samples, the quantification of possible released CNT can be investigated (assuming that there is no alteration of the Al concentration during the TD of the NEP). There was no Al presence in the released aerosol for all PU-CNT samples, further indicating that no CNT “escape” to the released aerosol, as also shown previously [27]. One should be cautious, however, of such indirect quantification of CNTs in thermally-treated samples using the Al content as a surrogate because Al and the CNTs might behave differently at elevated temperatures. Further analytical techniques could be carried out for the CNTs quantification as performed recently by monitoring the C(1s) electron band with X-ray photoelectron spectroscopy [5]. On the other hand, the CNTs concentration here is rather low, which makes its accurate quantification in the residual ash a technical challenge. The absence of CNTs and organic filler in the aerosol indicates that for the NEPs investigated in this study, the thermal decomposition might be the result of: i) thermal decomposition of the nanofillers upon their release; and/or ii) the nanofillers partially remain in the residual ash for some of the thermal decomposition scenarios (i.e. lower temperature).
For the case of PE-Fe2O3, however, minimal contents of elemental Fe were found in the released aerosol (Table 1) for both Td,final conditions indicating that there is some nanofiller-related release, even though at this point it is unclear whether the Fe undergone chemical and morphological transformations during the thermal decomposition conditions. Therefore, the nanofiller properties may influence the elemental composition of the released aerosol and more specifically, depending on these properties a nanofiller-related compounds may be released in the aerosol. It is worth noting that the rather small Fe content in the released aerosol for both Td,final (<0.03 wt%), however, renders it difficult to detect by microscopy whether it is present as solid nanoparticle (e.g. Fe2O3) or as ionic complex. In summary, organic nanofillers such as CNTs and organic dyes most likely will not be released in the air during the thermal decomposition process while inorganic fillers may be present in the released aerosol.
3.3 Chemical composition of released aerosol
The released aerosol consists of primarily organic carbonaceous compounds (Table 1). This OC content reaches rather high values (>99 %) independent of the thermoplastic matrix or the nanofiller material. Such OC compounds may also exhibit potential adverse health effects [35]. It remains to be seen of course in future toxicological studies the nanofiller-specific effect for the released aerosol.
The chemical composition of the released aerosol is further assessed using an independent setup of direct coupling of thermogravimetric analysis with Fourier-Transform infrared spectroscopy of the decomposition products in the off stream (TGA-FTIR, Netzsch-Proteus). Complete three-dimensional datasets of absorbance vs. temperature (or time or mass loss) vs. wavenumber are plotted in Figure S5 in the Supporting Information. A simple inspection of this complex dataset indicates that for the case of PE-Fe2O3, the matrix decomposition might be influenced by the nanofiller Fe2O3, for which we observe that the main decomposition peak around 460°C splits in two peaks at 410 °C and 478 °C respectively (data not shown). Furthermore, the corresponding TGA traces of mass loss vs. temperature indicate that 4.1 ± 1 % of mass remain from PE-Fe2O3 at 800°C, in agreement with the gravimetric results of this sample presented in Table 1, whereas the remaining mass is practically zero for all other materials.
In the gaseous off-stream, we observe only minor differences in the FTIR spectra of PU, PU-CNT and PU-CB (Figure 3a). Fingerprint IR lines identify besides CO2, CO and H2O, significant traces of THF, methane, ethylene and aldehydes, both for the pure PU and for PU-CNT and PU-CB. In contrast, we observe significant differences in the FTIR spectra of PE vs. PE-Fe2O3 (Figure 3b). The pure PE decomposes into CO2, H2O, CO, methanol, methane, and significant traces of ethylene and ketones. Fingerprinting identification of a difference spectrum between the FTIR spectra of the mass loss peaks at 410°C and 478°C, we derive that the earlier onset of decomposition with the PE-Fe2O3 releases preferentially methanol and ethylene already at 410°C. This release then transforms at 478°C into a complete decomposition with more dominant CO2 peaks around 2360 cm-1 than from the pure PE. Only the PE-Org. spectra are virtually identical to spectra from the pure PE decomposition. The presence of Fe2O3 as nanofiller in the PE thermoplastics might accelerate the polymer thermal decomposition similar to catalytic thermal decomposition of other Fe2O3-containing polymer nanocomposites [36]. The different FTIR spectra of the PE-Fe2O3 in comparison to the pure PE might be attributed, therefore, to the catalytic combustion characteristics of Fe2O3 nanoparticles [36].
Figure 3.
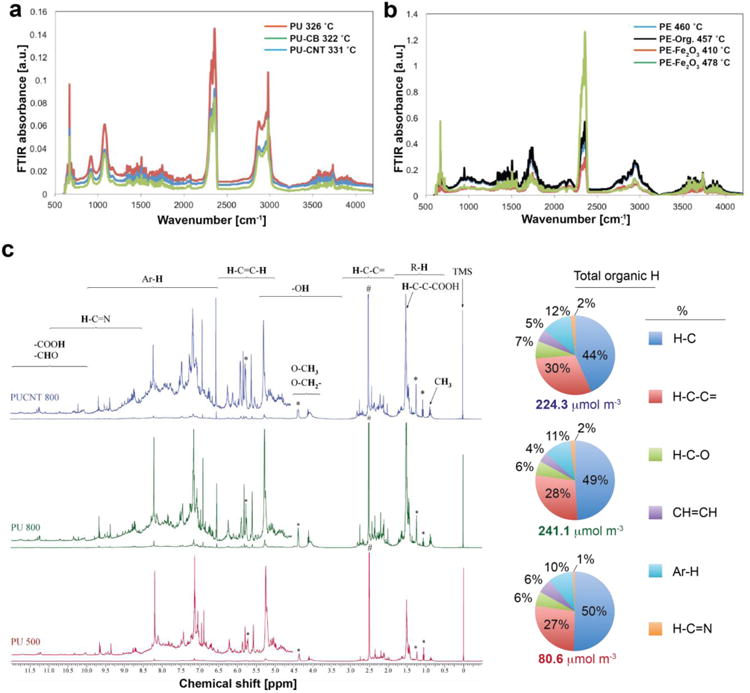
Chemical composition of released aerosols. TGA-FTIR spectra are at times just before the onset of characteristic CO peak for the PU-(a) and PE-based nanocomposites (b). (c) NMR spectra of pure PU decomposed at Td,final = 500 (red line) and 800 °C (green line), as well as PU-CNT decomposed at Td,final = 800 °C (blue line) along with their corresponding total organic H content and composition.
The chemical content of the organic carbon from the released aerosol collected from the CCI is further investigated by NMR for the case of PU-based NEPs. Figure 3b shows the NMR spectra of the released aerosol (PM2.5) from pure PU at Td,final = 500 (red line) and 800 °C (green line) as well as from PU-CNT at Td,final = 800 °C (blue line). Figure 3b also shows the determined [27] quantitative analysis from these spectra regarding the detected total organic H. The non-exchangeable organic hydrogen concentrations were computed by integrating NMR resonance signals based on the known concentrations of the internal standard (i.e. TMS). Even though the total amount from the pure PU at 500 °C is lower than that from both PU and PU-CNT at 800 °C (80.6 vs 241.1 and 224.3 μmol m-3, respectively), the corresponding relative fractions from each organic H component have similar values and consisted of approximately 75% H-C and H-C-C=.
The above TGA-FTIR and NMR provide the following indications: (i) the Td,final has little influence on the chemical composition of the released aerosol, (ii) the chemical composition of the released aerosol might depend on the specific nanofiller (e.g. for the case of PE-Fe2O3 there were differences while in the presence of organic filler, CNTs and carbon black there were no significant differences). The TGA-FTIR findings along with the NMR analysis support the hypothesis that particulate matter from thermal decomposition being mainly composed of VOCs from recondensed polymer fumes. This has also been confirmed when the released aerosol is treated chemically in situ passing through a thermal denuder and thus the semi-volatile and volatile organic compounds were removed [27].
It should be noted that a subsequent treatment of the released aerosol strongly influences its properties. For example, with the developed INEX platform here the released aerosol may pass through a thermal denuder or a thermal conditioner (Supporting Information, Scheme S1, Routes II and III, respectively). The thermal denuder removes volatile and semi-volatile organic compounds [27] while the thermal conditioner facilitates the further combustion of carbonaceous compounds as the released aerosol is brought and maintained at 800 C for a 5 s residence [37]. Indeed, the particle concentration is reduced significantly when passed through a thermal denuder (Supporting Information, Figure S6a,b) and further minimized when passed through the thermal conditioner (Supporting Information, Figure S6c,d). This is expected, since the released aerosol consists mainly from carbonaceous compounds as verified above.
3.4 Residual ash chemical composition and morphology
The presence of nanofillers in the residual ash is also investigated along with nanofiller specific effects on its properties. Organic compounds in general fully decompose at 800 °C so there is no residual ash at this Td,final for the pure thermoplastic polymers (both PU and PE) as also verified by TGA (Figure 3a). However, the inorganic nanofillers should be present in the residual ash at both Td,final conditions investigated here (500 and 800 °C). This is the case for the PE-Fe2O3 sample, that indeed yields residual ash close to its initial nominal concentration in the nanocomposite (∼4 wt%, Table 1). In fact, upon the elemental analysis of the residual ash from PE-Fe2O3 at both Td,final, the only element that is detected is Fe (Table 1). For the case of PU-CNT, even though pure CNT decompose at Td,final = 800 °C, there should be some residual ash originating from the catalysts metal and metal oxide nanoparticles used in the CNT synthesis. The rather low CNT loading, however, in the initial sample (0.09 wt%) renders the gravimetric detection of any residual ash at this Td,final impossible. A mass balance of the CNTs nanofillers in the residual ash at the thermal decomposition conditions used here has been established [27].
All samples yield residual ash at Td,final = 500 °C (Table 1) since the pure thermoplastic polymers do not fully decompose at these temperature as also indicated by the TGA results (Figure 3a). The residual ash mostly consists of EC (75 - 85 %) independent of the thermoplastic matrix or the presence or absence of nanofillers, except the residual ash from PE-Fe2O3. In that case, there was no EC detectable, with some minor OC amount, and elemental analysis revealed the presence of Fe. This is in agreement with the differences that were observed in the FTIR spectra of the gaseous off-stream of pure PE and the PE-Fe2O3 samples (Figure 3b) and a potential catalytic role of Fe2O3 nanoparticles [36], accelerating the thermal decomposition of the polymer matrix.
Electron microscopy images of the residual ash from all samples at Td,final = 500 °C are shown in Figure 4. The residual ash morphology is similar from all PU-based nanocomposites, however, from the PU-CNT sample the presence of CNTs is detected (Figure 4c) and further quantification by the Al content shows that all CNTs remain in the residual ash [27]. The CNTs are distributed evenly within the residual ash with some CNTs surfaced with the brittle degraded thermoplastic matrix holding them together. Furthermore, the residual ash from PE-Fe2O3 shows distinctly different morphology than the pure PE and the PE-org. nanocomposites. In fact, it appears that the residual ash from PE-Fe2O3 consists only from inorganic Fe2O3 nanofiller with no residual degraded thermoplastic matrix in contrast to the pure PE and the PE-org. This might be attributed to the catalytic activity of Fe to decompose carbonaceous compounds and accelerate combustion [36] or to a local temperature increase around the nanofillers due to their higher thermal conductivity than the polymer matrix. This indicates that the presence of nanofiller may significantly influence the morphology and chemical composition of the residual ash.
Figure 4.

Residual ash morphology at Td,final = 500 °C. SEM images of the residual ashes for PU (a), PU-CB (b), PU-CNT (c), PE (d), PE-Fe2O3 (e) and PE-org. (f). The presence of CNTs as well as pure Fe2O3 nanoparticles is detected. At Td,final = 800 °C, only Fe2O3 nanoparticles, but no residual ash remains from all other materials.
Figure 5 shows four XRD patterns of raw Fe2O3 nanofiller, PE-Fe2O3 nanocomposite, and the residual ash at Td = 500 and 800 °C. The crystal phase of the raw Fe2O3 is hematite α -Fe2O3 (red line). For Td = 800 °C (blue line), the ash contains only the α-Fe2O3 phase, indicating that the phase of the nano-filler is unchanged upon combustion at this temperature. However, at Td = 500 °C the α-Fe2O3 phase has partially transformed to maghemite and/or magnetite (green line). Magnetite and maghemite are indistinguishable by XRD because both have the same cubic structure and their lattice parameters are almost identical [38]. In the dry state, maghemite transforms to hematite via rearrangement of the crystal lattice in the temperature range 370-600 °C [38]. However, the more common synthesis process involves the reduction of hematite to magnetite, and then the oxidation to maghemite. Conversion of hematite to maghemite has been reported, but this required high-energy ball milling with ethanol for 96 hours [39]. The reduction of hematite (Fe2O3) to magnetite (Fe3O4) can occur under reducing conditions at 300 °C [38]. It might be possible during the combustion process that the polymer plastic serves as a reducing agent, converting the hematite (Fe2O3) to magnetite (Fe3O4). The magnetite is then oxidized to the observed maghemite.
Figure 5.

XRD patterns of PE-Fe2O3 nanocomposite (black line), raw Fe2O3 nanofiller (red line) residual ash at Td = 500 (green line) and 800 °C (blue line).
4. Conclusions
In summary, the life-cycle transformations of nanomaterials released at their end-of-life by thermal decomposition were investigated here with six industry-relevant NEPs using both inorganic and organic nanofillers. The main focus of this study was to obtain a fundamental understanding on the parameters that govern the thermal decomposition of NEPs and identify whether there are nanofiller-specific effects on the physicochemical properties of the generated byproducts during the thermal decomposition process. The released aerosol is polydisperse in nature. For the materials and conditions studied here, the presence of nanofiller did not influence the particle concentration and size of the released aerosol, nor the chemical composition of the organic and elemental carbon. There were no nanofiller observed in the released aerosol by microscopy for the case of organic nanofillers, however, in the case of Fe2O3, minimal amounts of Fe were detected in the released aerosol further indicating the potential nano-release from this material and further raising concerns regarding other inorganic materials with lower melting/boiling point. The use of high efficiency filters and wet scrubbers is thus essential to prevent release from waste combustion plants [20]. It remains to be seen in future studies, the toxicological effect of the released nanofiller.
The effect of the nanofiller was more prominent in the physicochemical properties of residual ash at both final decomposition temperatures. The majority of the nanofiller, if not all, remains in the residual ash for the case of CNTs, while the presence of inorganic Fe2O3 nanofiller drastically changed the residual ash composition and morphology. More specifically, the Fe2O3 nanofiller promoted the decomposition of the thermoplastic polymer matrix leaving no polymer residue in contrast to the blank polymer and polymer filled with organic nanofiller, essentially leaving the pure nanofiller in the residual ash. At elevated temperatures relevant for waste combustion, residual ash was zero from all organic and carbon-based NEPs, and retained almost the entire inorganic nanomaterial. Furthermore, the TGA-FTIR temporally resolves the splitting of mass loss peaks and shifted composition that result from the catalytic action of nano-Fe2O3 on PE decomposition, as confirmed by the chemical and structural analysis of the remaining ashes by SEM and EC/OC ratio. In summary, the degradation of thermoplastic matrix results to brittle residual ash with surface exposed nanofillers. This raises questions for potential release of nanofillers in environmental media from further weathering given the fact that residual ash from incineration processes may end up in landfills around the world [19]. Future work should investigate the effects of nanofiller loading, polymer matrix and thermal process conditions to the properties of the generated byproducts. Obtaining this understanding will be crucial for the sustainability of nanotechnology industry as a whole and will help in bridging major knowledge gaps and facilitating risk assessment based on real word exposures and toxicological profiles across the life-cycle of NEPs.
Supplementary Material
Highlights.
Nano-enabled products might reach their end-of-life by thermal decomposition
Thermal decomposition provides two by-products: released aerosol and residual ash
Is there any nanofiller release in byproducts?
Risk assessment of potential environmental health implications
Acknowledgments
We thank the FP7-MARINA consortium for kind provision of the thermoplastic materials. We kindly thank Dr. Martin Shafer (Univ. Wisconsin-Madison) for the EC/OC and ICP-MS measurements. This research was supported by NSF (grant nr. 1436450), NIH (grant nr. P30ES000002) and BASF SE. This work was performed in part at the Harvard Center for Nanoscale Systems (CNS), a member of the National Nanotechnology Infrastructure Network (NNIN), which is supported by the National Science Foundation under NSF award number ECS-0335765. Georgios A. Sotiriou gratefully acknowledges the Swiss National Science Foundation for the Advanced Researcher fellowship (grant nr. PA00P2_145392). Portions of this research were carried out at the SSRL beamline 11-3, a national user facility of the Department of Energy, Office of Basic Energy Sciences
Footnotes
Publisher's Disclaimer: This is a PDF file of an unedited manuscript that has been accepted for publication. As a service to our customers we are providing this early version of the manuscript. The manuscript will undergo copyediting, typesetting, and review of the resulting proof before it is published in its final citable form. Please note that during the production process errors may be discovered which could affect the content, and all legal disclaimers that apply to the journal pertain.
References
- 1.Keller AA, McFerran S, Lazareva A, Suh S. J Nanopart Res. 2013;15 [Google Scholar]
- 2.BASF. BASF Report 2011: Economic, environmental and social performance. 2011 [Google Scholar]
- 3.Stark WJ, Stoessel PR, Wohlleben W, Hafner A. Chem Soc Rev. 2015;44:5793. doi: 10.1039/c4cs00362d. [DOI] [PubMed] [Google Scholar]
- 4.Pirela SV, Sotiriou GA, Bello D, Shafer M, Lee Bunker K, Castranova V, Thomas T, Demokritou P. Nanotoxicology. 2014;9:760. doi: 10.3109/17435390.2014.976602. [DOI] [PMC free article] [PubMed] [Google Scholar]
- 5.Wohlleben W, Meier MW, Vogel S, Landsiedel R, Cox G, Hirth S, Tomovic Z. Nanoscale. 2013;5 doi: 10.1039/c2nr32711b. [DOI] [PubMed] [Google Scholar]
- 6.Maier T, Korting HC. Skin Pharmacol Physiol. 2005;18:253. doi: 10.1159/000087606. [DOI] [PubMed] [Google Scholar]
- 7.Nel A, Xia T, Madler L, Li N. Science. 2006;311 doi: 10.1126/science.1114397. [DOI] [PubMed] [Google Scholar]
- 8.Oberdorster G, Oberdorster E, Oberdorster J. Environ Health Perspect. 2005;113:823. doi: 10.1289/ehp.7339. [DOI] [PMC free article] [PubMed] [Google Scholar]
- 9.Demokritou P, Gass S, Pyrgiotakis G, Cohen JM, Goldsmith W, McKinney W, Frazer D, Ma J, Schwegler-Berry D, Brain J, Castranova V. Nanotoxicology. 2013;7:1338. doi: 10.3109/17435390.2012.739665. [DOI] [PMC free article] [PubMed] [Google Scholar]
- 10.Gass S, Cohen JM, Pyrgiotakis G, Sotiriou GA, Pratsinis SE, Demokritou P. ACS Sustainable Chem Eng. 2013;1:843. doi: 10.1021/sc300152f. [DOI] [PMC free article] [PubMed] [Google Scholar]
- 11.Johnston HJ, Hutchison G, Christensen FM, Peters S, Hankin S, Stone V. Critical Rev Toxicol. 2010;40:328. doi: 10.3109/10408440903453074. [DOI] [PubMed] [Google Scholar]
- 12.Poland CA, Duffin R, Kinloch I, Maynard A, Wallace WAH, Seaton A, Stone V, Brown S, MacNee W, Donaldson K. Nat Nanotechnol. 2008;3 doi: 10.1038/nnano.2008.111. [DOI] [PubMed] [Google Scholar]
- 13.Pratsinis A, Hervella P, Leroux JC, Pratsinis SE, Sotiriou GA. Small. 2013;9 doi: 10.1002/smll.201202120. [DOI] [PubMed] [Google Scholar]
- 14.Sotiriou GA, Diaz E, Long MS, Godleski J, Brain J, Pratsinis SE, Demokritou P. Nanotoxicology. 2012;6 doi: 10.3109/17435390.2011.604439. [DOI] [PMC free article] [PubMed] [Google Scholar]
- 15.Nel AE, Maedler L, Velegol D, Xia T, Hoek EMV, Somasundaran P, Klaessig F, Castranova V, Thompson M. Nat Mater. 2009;8 doi: 10.1038/nmat2442. [DOI] [PubMed] [Google Scholar]
- 16.Wohlleben W, Kuhlbusch TAJ, Schnekenburger J, Lehr CM. Safety of nanomaterial along their lifecycle: Release, Exposure and Human Hazards. Taylor & Francis; 2014. [Google Scholar]
- 17.NNI 2011 Environmental, Health, and Safety (EHS) Research Strategy; National Science and Technology Council Committee on Technology Subcommittee on Nanoscale Science, Engineering, and Technology, 2011.
- 18.Committee to Develop a Research Strategy for Environmental, Health, and Safety Aspects of Engineered Nanomaterials. National Research Council; Washington, D.C.: 2012. A Research Strategy for Environmental, Health, and Safety Aspects of Engineered Nanomaterials. [PubMed] [Google Scholar]
- 19.Keller AA, Lazareva A. Environ Sci Technol Lett. 2013;1 [Google Scholar]
- 20.Walser T, Limbach LK, Brogioli R, Erismann E, Flamigni L, Hattendorf B, Juchli M, Krumeich F, Ludwig C, Prikopsky K, Rossier M, Saner D, Sigg A, Hellweg S, Guenther D, Stark WJ. Nat Nanotechnol. 2012;7:520. doi: 10.1038/nnano.2012.64. [DOI] [PubMed] [Google Scholar]
- 21.Vejerano EP, Leon EC, Holder AL, Marr LC. Environ Sci: Nano. 2014;1:133. [Google Scholar]
- 22.Chivas-Joly C, Motzkus C, Guillaume E, Ducourtieux S, Saragoza L, Lesenechal D, Lopez-Cuesta JM, Longuet C, Sonnier R, Minisini B. Fire Mater. 2014;38:46. [Google Scholar]
- 23.Motzkus C, Chivas-Joly C, Guillaume E, Ducourtieux S, Saragoza L, Lesenechal D, Mace T, Lopez-Cuesta JM, Longuet C. J Nanopart Res. 2012;14:687. [Google Scholar]
- 24.Ounoughene G, Le Bihan O, Chivas-Joly C, Motzkus C, Longuet C, Debray B, Joubert A, Le Coq L, Lopez-Cuesta JM. Environ Sci Technol. 2015;49:5450. doi: 10.1021/es505674j. [DOI] [PubMed] [Google Scholar]
- 25.Rhodes J, Smith C, Stec AA. Polym Degrad Stabil. 2011;96:277. [Google Scholar]
- 26.Roes L, Patel MK, Worrell E, Ludwig C. Sci Total Environ. 2012;417:76. doi: 10.1016/j.scitotenv.2011.12.030. [DOI] [PubMed] [Google Scholar]
- 27.Sotiriou GA, Singh D, Zhang F, Wohlleben W, Chalbot MCG, Kavouras IG, Demokritou P. Environ Sci: Nano. 2015;2:262. doi: 10.1039/C4EN00210E. [DOI] [PMC free article] [PubMed] [Google Scholar]
- 28.Demokritou P, Lee SJ, Ferguson ST, Koutrakis P. J Aerosol Sci. 2004;35 [Google Scholar]
- 29.Sotiriou GA, Watson C, Murdaugh KM, Pyrgiotakis G, Elder A, Brain JD, Demokritou P. Environ Sci: Nano. 2014;1 doi: 10.1039/C3EN00062A. [DOI] [PMC free article] [PubMed] [Google Scholar]
- 30.Herner JD, Green PG, Kleeman MJ. Environ Sci Technol. 2006;40:1925. doi: 10.1021/es052315q. [DOI] [PubMed] [Google Scholar]
- 31.Schauer JJ, Mader BT, Deminter JT, Heidemann G, Bae MS, Seinfeld JH, Flagan RC, Cary RA, Smith D, Huebert BJ, Bertram T, Howell S, Kline JT, Quinn P, Bates T, Turpin B, Lim HJ, Yu JZ, Yang H, Keywood MD. Environ Sci Technol. 2003;37:993. doi: 10.1021/es020622f. [DOI] [PubMed] [Google Scholar]
- 32.Chalbot MCG, Kavouras IG. Environ Poll. 2014;191:232. doi: 10.1016/j.envpol.2014.04.034. [DOI] [PubMed] [Google Scholar]
- 33.Bouillard J, Mili BR', Moranviller D, Vignes A, Le Bihan O, Ustache A, Bomfim JS, Frejafon E, Fleury D. J Nanopart Res. 2013;15:1. [Google Scholar]
- 34.Hinds WC. Aerosol Technology: Properties, Behavior, and Measurement of Airborne Particles. 2nd. Wiley; 1999. [Google Scholar]
- 35.Woolley WD, Raftery MM. J Hazard Mater. 1976;1:215. [Google Scholar]
- 36.Ma Z, Li F, Bai H. Propellants Explos Pyrotech. 2006;31:447. [Google Scholar]
- 37.Clarke MJ, Kadt M, Saphire D, Golden SR. Burning garbage in the US: Practice vs state of the art. INFORM; New York, NY: 1991. [Google Scholar]
- 38.Cornell RM, Schwertmann U. The Iron Oxides: Structure, Properties, Reactions, Occurrence, and Uses. Weinheim: Wiley-VCH; 2003. [Google Scholar]
- 39.Randrianantoandro N, Mercier AM, Hervieu M, Greneche JM. Mater Lett. 2001;47:150. [Google Scholar]
Associated Data
This section collects any data citations, data availability statements, or supplementary materials included in this article.