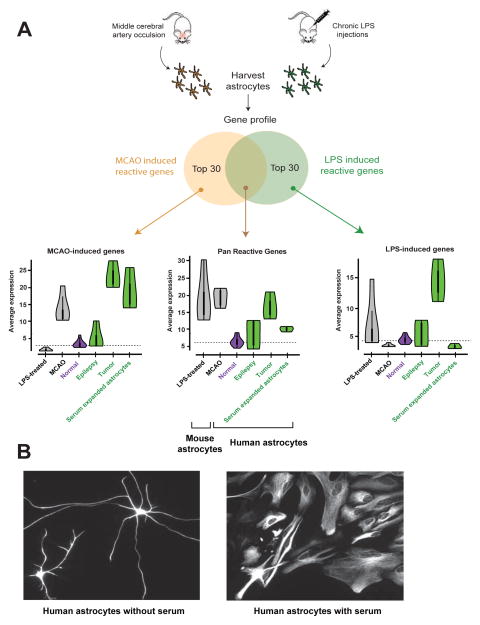
Figure 6.
Acutely purified human astrocytes display resting gene profiles. A. The Zamanian et al. dataset was used to identify the top 30 reactive astrocyte genes upregulated following MCAO injury, LPS infection, or both. Expression of this suite of ‘reactive’ genes was then probed in various astrocyte samples. The white dots in the Violin plots represent the median. Thick vertical black lines represent interquantile ranges. Horizontal dashed lines indicate median in normal human astrocytes for each condition. N=12, 4, 3, and 3 for normal, epilepsy, tumor, and serum-expanded astrocytes, respectively. B. Representative images of acutely purified human astrocytes grown in culture for 7 days in the absence (left) or presence (right) of serum. Scale bar: 20μm.

