Abstract
The present study sought to test whether perceptual segregation of concurrently played sounds is impaired in schizophrenia (SZ), whether impairment in sound segregation predicts difficulties with a real-world speech-in-noise task, and whether auditory-specific or general cognitive processing accounts for sound segregation problems. Participants with SZ and healthy controls (HCs) performed a mistuned harmonic segregation task during recording of event-related potentials (ERPs). Participants also performed a brief speech-in-noise task. Participants with SZ showed deficits in the mistuned harmonic task and the speech-in-noise task, compared to HCs. No deficit in SZ was found in the ERP component related to mistuned harmonic segregation at around 150 ms (the object-related negativity or ORN), but instead showed a deficit in processing at around 400 ms (the P4 response). However, regression analyses showed that indexes of education level and general cognitive function were the best predictors of sound segregation difficulties, suggesting non-auditory specific causes of concurrent sound segregation problems in SZ.
Keywords: Event-related brain potentials, Auditory scene analysis, Speech-in-noise, Hallucinations, Mistuned harmonic segregation
1. Introduction
The ability to segregate sounds that are occurring at the same time is called auditory scene analysis (Bregman, 1990), and is thought to be one of the main functions of the auditory system in humans and other social species. In the laboratory, auditory scene analysis tasks are usually designed to assess the ability to segregate two discrete sounds played concurrently (Alain, 2007) or two series of sounds that are interleaved with each other to form sequential streams of sounds (Snyder and Alain, 2007). Recently, we showed that people with schizophrenia (SZ) had difficulty using frequency, spatial, and amplitude cues to segregate sequential streams (Ramage et al., 2012; Weintraub et al., 2012), and that their event-related brain potentials (ERPs) from auditory cortex were less different in amplitude when the frequency difference between streams was more different, compared to controls (also see Rojas et al., 2007;Weintraub et al., 2012). However, perceptual segregation of concurrent sounds has not been studied in SZ to our knowledge, with the exception of one recent study on speech masking (Wu et al., 2012). Studying deficits in segregation abilities in SZ is important because they may have real-world impacts on the ability of those with SZ to listen to speech, music, and other sounds in social and other noisy situations.
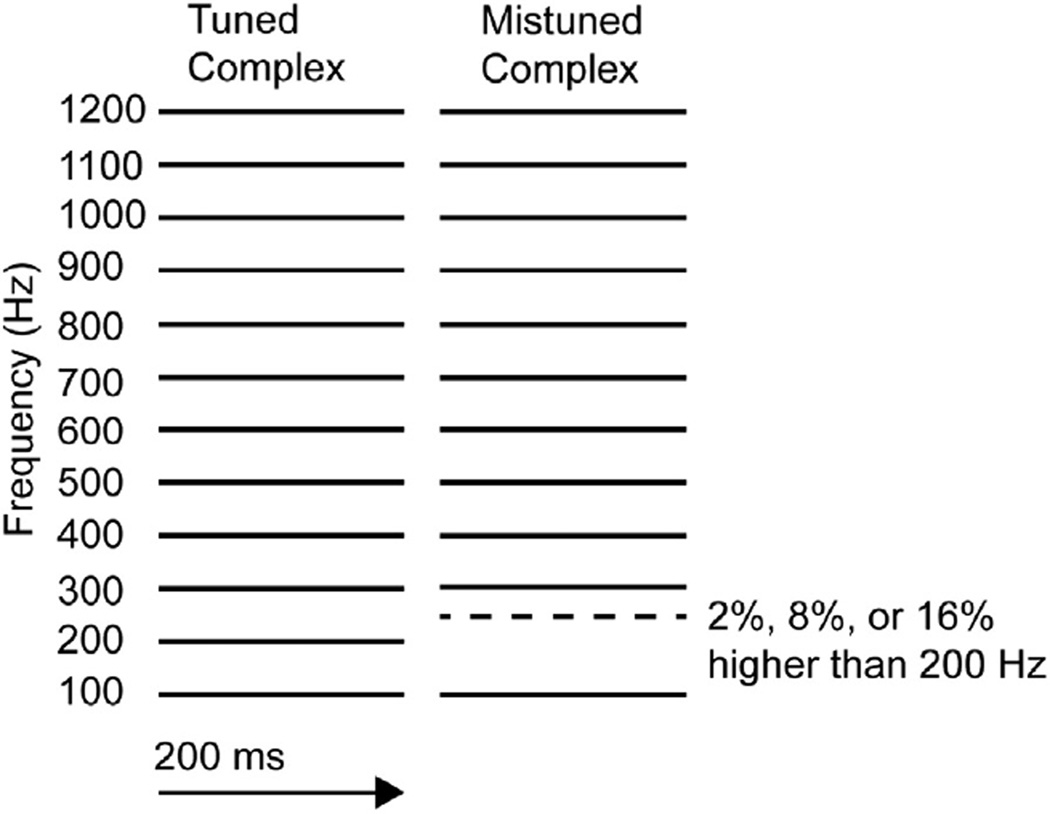
The primary goal of the current study was to determine whether segregation of concurrent sounds is impaired in SZ and whether ERP correlates of segregation are concomitantly impaired. We used the mistuned harmonic task (Fig. 1), which tests the ability to hear whether one of several pure tones played simultaneously is not a multiple of the lowest tone present (Moore et al., 1985). When one of the pure tones is mistuned, two modulations of auditory ERPs are observed at frontocentral electrodes, with reversals in polarity at inferior electrodes, consistent with auditory cortex activity (Alain et al., 2001). The first modulation, called the object-related negativity (ORN), peaks around 150 ms, and can be observed even when ignoring the sounds. The second modulation, called the P4, peaks around 400 ms, and is more dependent on actively listening to the sounds and making judgments.
Fig. 1.
Schematics of stimuli. The tuned harmonic stimulus (left) contained 12 pure tones, all multiples of 100 Hz, which is usually heard as a single complex tone with a pitch corresponding to the lowest 100 Hz tone. The mistuned harmonic stimulus (right) contained 12 pure tones, all multiples of 100 Hz except for the second tone, which was mistuned by 2, 8, or 16% (i.e., with a frequency of 204, 216, or 232 Hz), leading to perception of complex tone with a pitch at 100 Hz and a second pure-sounding tone corresponding to the frequency of the mistuned harmonic.
A secondary goal was to test SZ participants on a speech-in-noise task to see if they are likely to have difficulty with sound segregation tasks in real-world situations that sequential and concurrent segregation tasks are meant to model. We tested participants on both speech-in-noise and mistuned harmonic tasks, allowing us to assess whether there is a predictive relationship between these two tasks and whether more general factors such as IQ can account for sound segregation performance differences between groups and between individuals.
2. Methods
2.1. Participants
This study was approved by the Institutional Review Board at the University of Nevada, Las Vegas and written informed consent was obtained from all participants. Participants included 24 individuals with SZ (1 schizoaffective) and 28 HCs free of any psychiatric diagnosis. There were no significant between-group differences on age, self-reported gender, or handedness (Table 1). The SZ group reported significantly fewer years of education and had significantly lower IQ scores.
Table 1.
Demographic and clinical information for participants.
| Schizophrenia (n = 24) |
Healthy control (n = 28) |
Between group differences |
|
|---|---|---|---|
| General information | |||
| Age in years (SD) | 41.6 (12.3) | 44.5 (12.4) | t = −.819, p = .42 |
| % females | 25 | 32 | χ2 = .32, p = .57 |
| % right handed | 87 | 93 | χ2 = 2.25, p = .33 |
| Education (SD) | 11.6 (1.9) | 14.2 (2.6) | t = −3.88, p < .001 |
| IQ (SD) | 82.9 (12.8) | 104.8 (15.5) | t = −5.50, p < .001 |
| Ethnic distribution | χ2 = 13.66, p = .034 | ||
| % Caucasian | 41.7 | 67.9 | |
| % African American | 37.5 | 10.7 | |
| % Asian American | 4.2 | 3.6 | |
| % Hispanic/Latino | 0 | 7.1 | |
| % Pacific Islander | 8.3 | 0 | |
| % Bi-racial | 8.3 | 0 | |
| % other | 0 | 7.1 | |
| % undisclosed | 0 | 3.6 | |
| Current psychiatric medication | |||
| Chlorpromazine equivalenta (SD) | 921.6 (636.3) | ||
| % antipsychotics | 70.8 | ||
| % typical | 4.2 | ||
| % atypical | 70.1 | ||
| % mood stabilizer | 41.7 | ||
| % antidepressant | 37.5 | ||
| % lithium | 0 | ||
| % no medication | 4.2 | ||
| % no information | 25 | ||
| Other patient information | |||
| Age in years at onset (SD) (n = 22)b | 20.18 (6.8) | ||
| Years of illness (SD) (n = 22)b | 20.18 (10.6) | ||
| # hospitalizations (SD) (n = 24)b | 4.2 (5.7) |
In mg per day.
n represents the number of patients with endorsed information.
Participants were 21–63 years, most having normal pure-tone thresholds (from 250 to 4000 Hz) for their age, with 3 SZ and 4 HC participants with mild to moderate hearing loss (> 30 dB HL for at least one of the tested frequencies). Hearing thresholds were worse overall in the SZ group across the frequencies tested, F(1,50) = 4.49, p < .039, , but there was no interaction between group and frequency.
2.2. Stimuli and design
Individual trials consisted of a single complex tone, 200 ms in duration (including 10 ms rise/fall time). On tuned trials (0% mistuning), the complex tone consisted of twelve equal-intensity sine tones that were all multiples of 100 Hz with frequencies at 100, 200, 300, 400, 500, 600, 700, 800, 900, 1000, 1100, and 1200 Hz (Fig. 1). The mistuned trials were the same except the second lowest harmonic had a mistuning of 2, 8, or 16%, corresponding to frequencies of 204, 216, or 232 Hz. The different conditions (0, 2, 8, and 16%) were presented quasi-randomly intermixed in six blocks or nine blocks, each block consisting of 80 trials (20 per condition), with a 4 s interval between the onsets of complex tones in consecutive trials.
2.3. Procedures
All individuals in the SZ group had a clinical diagnosis of SZ, which was confirmed using the Structured Clinical Interview for DSM-IV-TR Axis I Disorders (SCID) (First et al., 2002) and review of medical records. The SCID was also used to rule out psychiatric diagnosis in the HC group. Current IQ was assessed using the Vocabulary and Block Design subtests of the Wechsler Adult Intelligence Scale (WAIS-III), with a regression-based quantification (Ringe et al., 2002; Wechsler, 1997). Medication use was confirmed via medical records and/or information provided by mental health professionals providing treatment for the SZ participants.
All stimuli were presented from a desktop PC using Presentation (Neurobehavioral Systems, Inc., Albany, CA) over head-phones at the same comfortable level for all participants. Throughout the experimental portion of the study, participants were seated comfortably in a single-walled sound-attenuated room (Industrial Acoustic Corp, Bronx, NY). All participants were screened for hearing impairments prior to any experimental tasks using a GSI-17 audiometer using headphones (MSR NorthWest Inc.). A speech-in-noise task was always done prior to EEG recording.
For the mistuned harmonic task, participants were asked to report on each trial whether they heard a single complex sound or a complex sound in addition to a pure sound. EEG data were recorded during the mistuned harmonic task on an array of 72 Ag–AgCl electrodes using the Biosemi ActiveTwo system. Voltage offsets were below 40 mV prior to recording, and the resting EEG was checked for any problematic electrodes prior to and throughout recording. EEG signals were digitized continuously (512-Hz sampling rate, 104-Hz bandwidth). During EEG recording, participants listened to stimuli binaurally over ER3A insert earphones (Etymotic Research, Inc., Elk Grove Village, IL) and made judgments after each trial.
QuickSIN stimuli (Killion et al., 2004) (Etymotic Research, Inc., Elk Grove Village, IL) were composed of the 12 standard binaural presentation lists (always preceded by 3 practice lists) of six short sentences (female speaker) each containing five target words set in background noise (4-talker babble, consisting of 3 female speakers and 1 male speaker) that increased in steps of 5 dB HL until there was no difference in dB between the speech and noise (dB HL difference over 6 sentences = 25, 20, 15, 10, 5, and 0). After every sentence (within ~1 s) the sound file was paused allowing participants adequate time to repeat back the sentence orally. The 5 target words in each sentence were counted as correct even when spoken out of order, if the participant self-corrected a word before moving onto the next sentence, or if the word was altered in a way that did not change the meaning of the word or the context of the sentence (e.g., beers instead of beer = acceptable; burm instead of rum = unacceptable). Replacement of words with synonyms was not accepted as correct.
2.4. Behavioral data analysis
The proportion hearing mistuning values were entered into a mixed-design analysis of variance (ANOVA) with mistuning (0, 2, 8, 16%) as a within-subjects factor and group (SZ, HC) as a between-subjects factor. When more than one level was present for a between-subjects factor, the degrees of freedom were adjusted using the Green-house–Geisser and all reported probability estimates were based on the reduced degrees of freedom. This adjustment was applied to all ANOVAs throughout this study.
For the QuickSIN test, signal-to-noise ratio loss, which is a comparison between a participant's performance and that of someone with normal hearing, was measured by adding the total number of target words repeated over the six sentences and subtracting this number from 25.5, resulting in the loss required for a participant to repeat 50% of the target words correctly (see Killion et al., 2004). This loss calculation was then averaged over all lists presented and was entered into an ANOVA to examine differences between groups (SZ, HC). Note that larger numbers indicate worse performance.
2.5. EEG data analysis
All EEG data processing and extraction of ERP measures was done using BESA Software (BESA GmbH, Gräfelfing, Germany). ERPs were measured by averaging EEG epochs from 200 ms before to 800 ms after the stimulus onset for each stimulus condition and electrode site separately, and re-referencing off-line to the average of all electrodes. As a first step prior to segmenting the data into epochs, ocular artifacts (blinks, saccades, smooth movements) were corrected automatically with a spatial-filtering based method. Next, epochs contaminated by artifacts (amplitude >150 µV, gradient >75 µV, low signal <.10 µV) were automatically rejected prior to averaging. A minimum of 33% of epochs was accepted for each condition in each participant (average of 113 epochs per condition for SZ and 133 epochs per condition for HCs). Epochs were digitally bandpass filtered to attenuate frequencies below 1 Hz (6 dB/octave attenuation, forward) and above 20 Hz (24 dB/octave attenuation, zero phase).
To extract components of interest, ERPs were baseline corrected by subtracting the mean of the portion 200 ms prior to stimulus. We then calculated grand-averaged ERP waves between conditions of interest for each group and then calculated difference waves by subtracting the 0% condition from the other three conditions (2, 8, 16%). Using the difference waves, we chose latency windows showing clear ORN (negative difference from 110 to 230 ms) and P4 (positive difference from 320 to 540 ms) waveform components and maximal difference between groups. Analyses included nine central (CPz, CP1, CP2, FCz, Cz, C1, C2, FCz, FC1, FC2). Mean amplitudes based on original waveforms were averaged together and then submitted to mixed-design ANOVAs with group (SZ, HC) as a between-subjects factor, and condition as a within-subjects factor, with ORN and P4 amplitudes as dependent variables, respectively. ANOVAs were also performed with pure-tone thresholds averaged across all frequencies (250–4000 Hz) included as a covariate and any differences with the original analyses are noted.
2.6. Regression analysis
The first analysis predicts mistuned harmonic perception with P4 amplitude, group, IQ, pure-tone thresholds, and years of education as predictors. The second analysis predicts speech-in-noise perception with mistuned harmonic perception, P4 amplitude, group, IQ, pure-tone thresholds, and years of education as predictors. IQ and education were included because they differed between the groups. The 8% and 16% conditions were averaged together for mistuned harmonic segregation and P4 amplitude in these analyses because these conditions differed most strongly between groups. Pure-tone thresholds were averaged across all frequencies (250–4000 Hz).
3. Results
3.1. Behavioral data
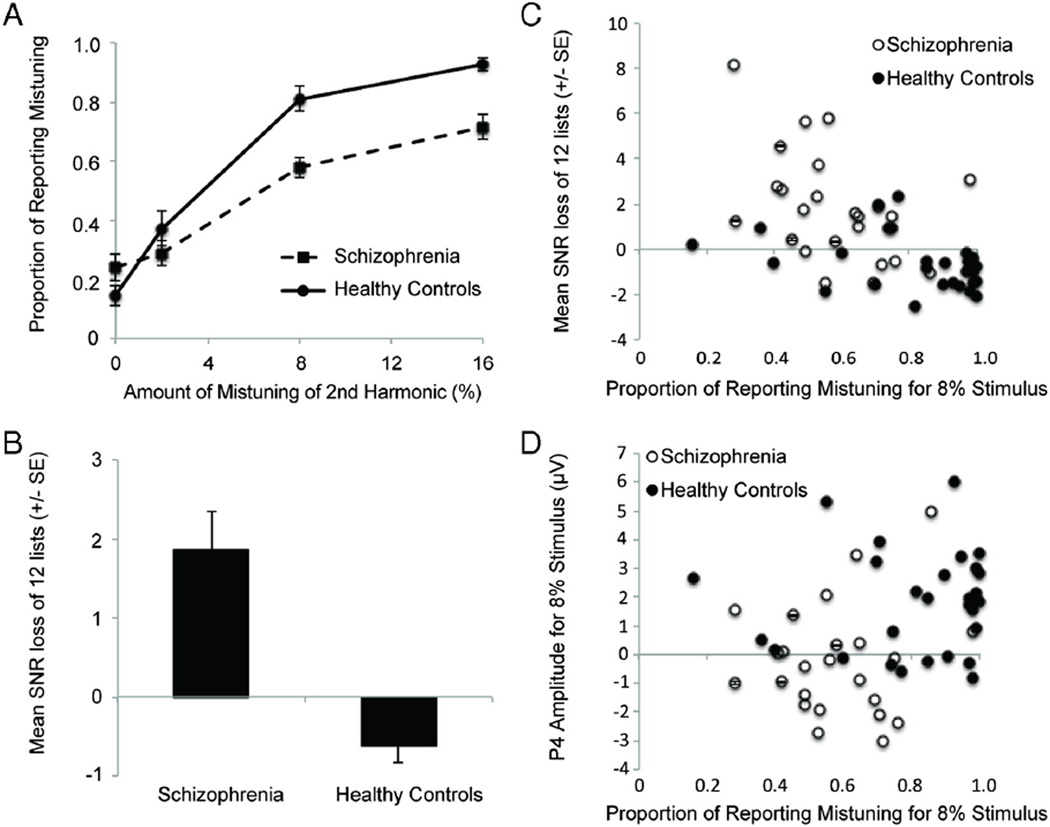
As shown in Fig. 2A, participants with SZ were less likely to indicate that they heard two sounds (a complex sound and a simple sound) in the mistuning task compared to HC participants, F(1,50) = 9.78, p < .005, . Across both groups, a greater degree of mistuning made it more likely that people would report hearing two sounds, F (3,150) = 111.77, p < .001, . However, participants with SZ had less increase in perceiving two objects with larger amounts of mistuning compared to the HC group, as indicated by an interaction between group and mistuning amount, F(3150) = 7.36, p < .005, .
Fig. 2.
Behavioral data. A) Proportion of time participants heard two objects during the mistuned harmonic segregation task (±standard error). B) Signal-to-noise ratio (SNR) loss on the QuickSIN speech-in-noise task (±standard error) in healthy controls and those with schizophrenia. Note that larger numbers on SNR loss indicate worse performance. C) Scatter-plot showing relationship between perception of mistuned harmonic for the 8% condition and QuickSIN SNR loss, separately for the SZ and HC groups. D) Scatter-plot showing relationship between perception of mistuned harmonic for the 8% condition and P4 amplitude for the 8% condition, separately for the SZ and HC groups.
As shown in Fig. 2B, participants with SZ also had difficulty perceptually segregating the speech sounds in the QuickSIN test, as indicated by significantly more loss compared to HCs, F(1,61) = 31.80, p < .001, . Fig. 2C is an example of the generally negative relationship between perception of mistuning and QuickSIN loss.
3.2. ERP data
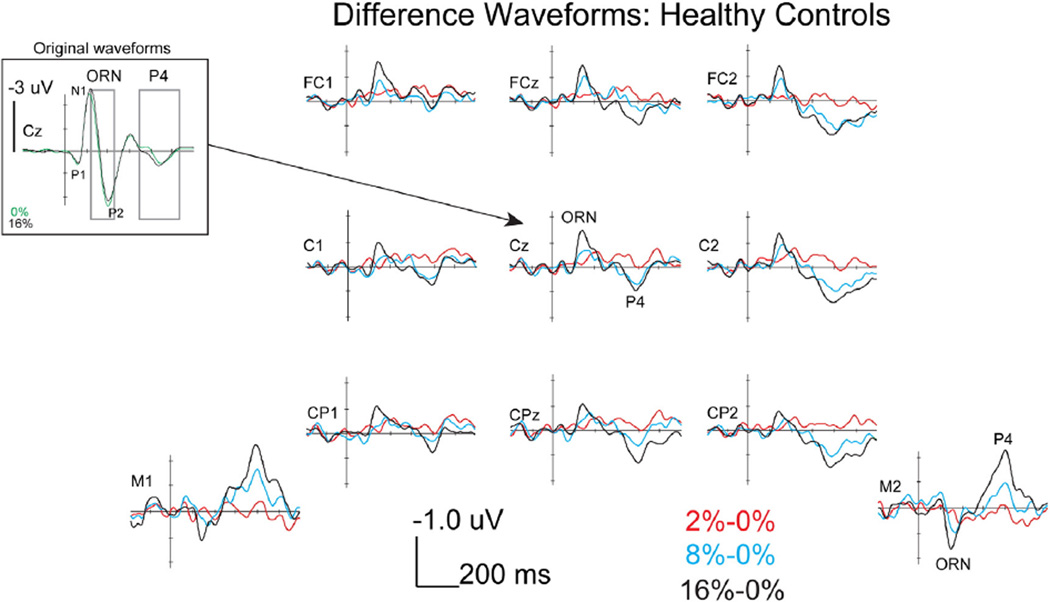
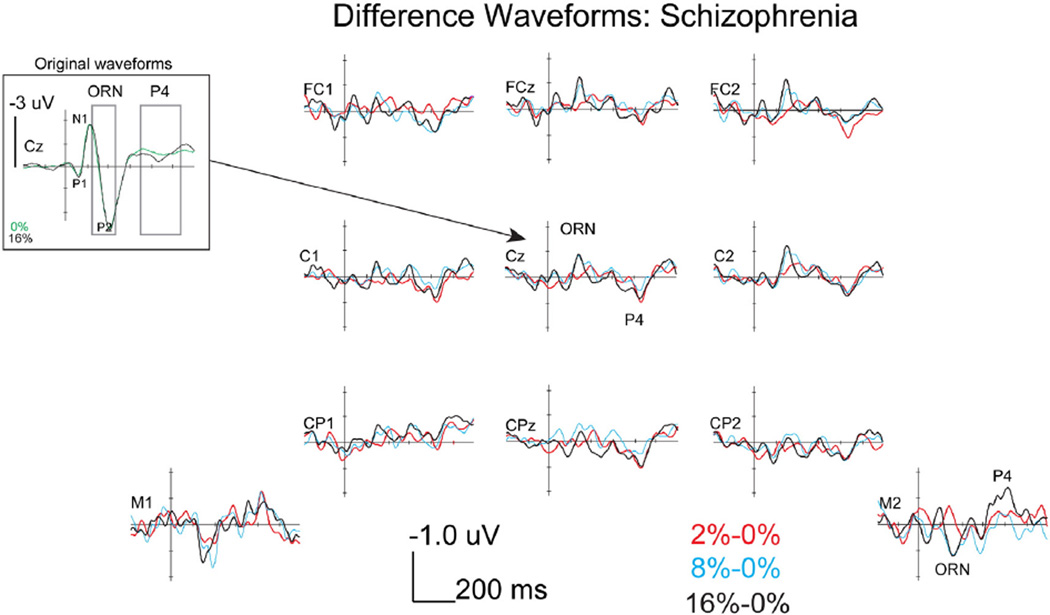
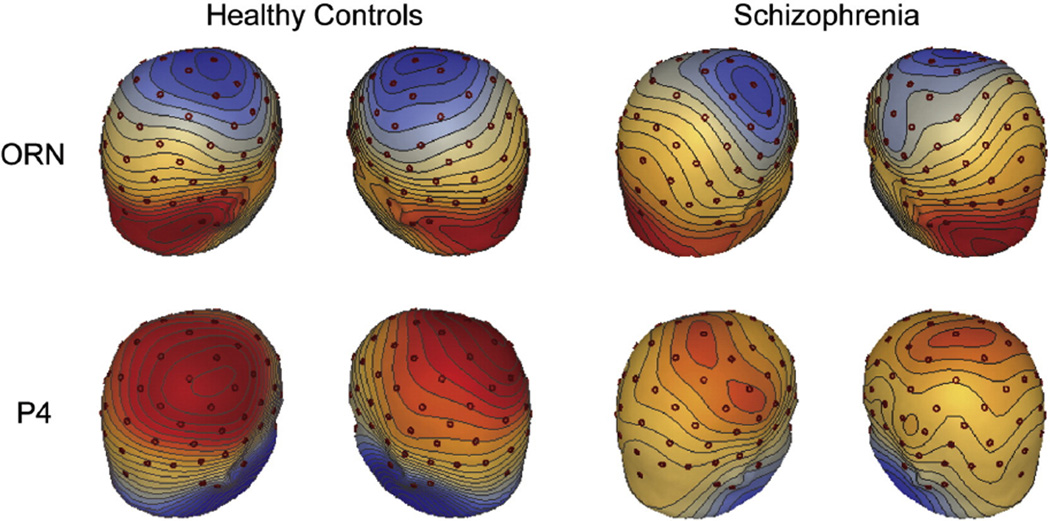
As shown in Fig. 3, HCs showed a P1–N1–P2–N2 complex followed by a P4 response at Cz, following the onset of the complex tones. The difference waves shown in Fig. 3 more clearly illustrates the modulations that occurred in the form of a negative ORN peaking around 150 ms and a positive P4 response peaking around 400 ms at central electrodes, both of which were progressively larger with greater amounts of mistuning. Importantly, the ORN and P4 modulations reversed polarity at mastoid electrodes, consistent with generators in the auditory cortex (Alain et al., 2001). As shown in Fig. 4, participants with SZ showed similar P1–N1–P2–N2 and P4 peaks compared to HCs in the original waveforms and ORN and P4 modulations in the difference waves (see topographies in Fig. 5). Fig. 2D is an example of the generally positive relationship between perception of mistuning and P4 amplitude.
Fig. 3.
ERP difference waves during mistuned harmonic segregation task in HCs at nine fronto-central electrodes and the two mastoid electrodes. Note the reversal of polarity of the ORN and P4 responses when comparing fronto-central and mastoid electrodes. Also, shown are the original waveforms at Cz for the 0 and 16% conditions at a larger amplitude scale in order to show the location of the differences in relation to the P1–N1–P2 complex.
Fig. 4.
ERP difference waves during mistuned harmonic segregation task in SZ participants at nine fronto-central electrodes and the two mastoid electrodes. Note the reversal of polarity of the ORN and P4 responses when comparing fronto-central and mastoid electrodes. Also, shown are the original waveforms at Cz for the 0 and 16% conditions at a larger amplitude scale in order to show the location of the differences in relation to the P1–N1–P2 complex.
Fig. 5.
ERP topographies of the ORN and P4 difference waves for the 16%–0% difference waves, shown separately for the healthy controls and those with schizophrenia at the peaks of the difference waves. Each step in the topography represents 0.1 µV. Red represents positive voltage, and blue represents negative voltage. Electrode locations are shown as red circles. (For interpretation of the references to color in this figure legend, the reader is referred to the web version of this article.)
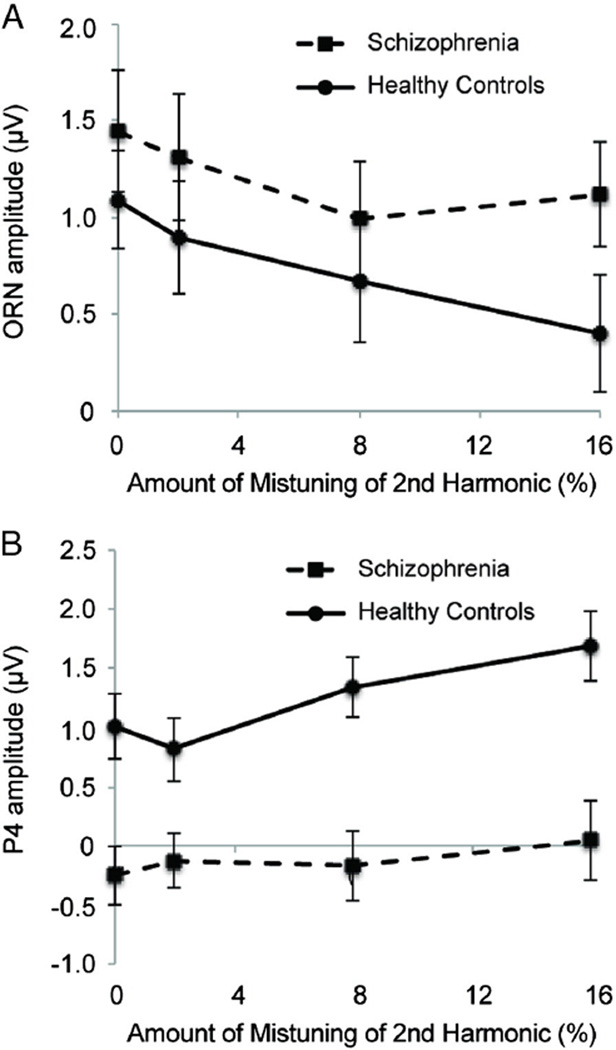
Consistent with these observations, the amplitude during the ORN period showed a main effect of mistuning amount, F(3,150) = 11.10, p < .001, (with pure-tone thresholds as a covariate, p = .099), as did the amplitude during the P4 period, F(3,150) = 10.63, p < .001, . The effect of mistuning during the ORN period was not different for the two groups as reflected by a lack of interaction between mistuning and group, F(3150)=1.60, p=.194, , although there was a trend for less modulation due to mistuning in the SZ group (see Fig. 6A). The effect of mistuning during the P4 period was significantly reduced in the SZ group compared to the HCs, F (3,150) = 4.42, p < .025, (see Fig. 6B). Finally, there was no main effect of group on amplitude during the ORN period, F(1,50) = 1.26, p = .268, , but during the P4 period, mean amplitude was more positive for the HC group compared to the SZ group, F (1,50) = 13.24, p < .001, .
Fig. 6.
ERP amplitudes (±standard error) shown separately for each mistuning level for healthy controls and those with schizophrenia. A) Amplitudes during ORN time period. B) Amplitudes during P4 time period.
3.3. Regression analysis
The regression model predicting mistuned harmonic perception was significant and predicted a substantial amount of variance, adjusted R2 = .46, F(5,45) = 9.48, p < .001. Only education, β = −.286, p = .032, and IQ, β = .389, p = .018, were significant predictors in this model. The other variables did not significantly predict mistuned harmonic perception (P4 amplitude: p = .180, pure-tone threshold: p = .081, group: p = .080).
The regression model predicting speech-in-noise performance was significant and predicted a substantial amount of variance, adjusted R2 = .52, F(6,44) = 9.91, p < .001. Only IQ, β = −.457, p = .006, was a significant predictor in this model. The other variables did not significantly predict speech-in-noise performance (mistuned harmonic segregation: p = .073, P4 amplitude: p = .381, pure-tone threshold: p = .166, group: p = .977, education: p = .780).
4. Discussion
We found that people with SZ have difficulties compared to HCs with concurrent segregation of a mistuned harmonic as well as a more-real world speech segregation task. These difficulties were accompanied by smaller P4 responses in SZ participants, compared to HCs. However, education and IQ significantly predicted mistuned harmonic perception, while only IQ significantly predicted QuickSIN loss. The current findings and previous findings of deficits in sound segregation (Ramage et al., 2012; Weintraub et al., 2012; Wu et al., 2012) are important especially because they suggest that people with SZ have difficulty understanding complex auditory scenes, typical of many urban and social settings that are common in modern human life. It is even possible that difficulties segregating sounds contribute to or exacerbate social withdrawal, anhedonia, and other socially-relevant symptoms in SZ because a general inability to process complex auditory scenes could make it frustrating to participate effectively in noisy social gatherings.
As predicted, individuals with SZ had reduced ability to hear a mistuned harmonic and also had difficulty perceiving speech in noise, compared to HCs. Furthermore, performance on these two tasks was in the expected direction in SZ (higher proportion of hearing mistuning inversely related to QuickSIN loss), suggesting a link between difficulties segregating simple and complex sounds in SZ. These behavioral results are consistent with previous findings: people with SZ have difficulty utilizing frequency cues in auditory perception tasks, such as during frequency discrimination (Javitt et al., 1997; March et al., 1999; Strous et al., 1995), vocal prosody perception (Gold et al., 2012; Leitman et al., 2005; Leitman et al., 2010), and auditory stream segregation (Ramage et al., 2012; Weintraub et al., 2012). However, it is important to note that despite the greater number of studies on frequency processing deficits in SZ, the behavioral and neurophysiological literature clearly indicates that people with SZ have a more general difficulty processing various auditory cues such as intensity, duration, and interaural differences (Bach et al., 2011; Cienfuegos et al., 1999; Davalos et al., 2003; Ramage et al., 2012; Todd et al., 2008). The general difficulties with a range of auditory cues and tasks are consistent with overall reduced gray matter volume of auditory cortex in SZ (McCarley et al., 1999; Shenton et al., 2001): people with SZ may simply have limited cortical resources to represent stimuli in a precise manner.
The reduced P4 modulations in SZ suggest a deficit in top–down processing of the mistuned harmonic stimulus. This conclusion is based on the finding that the P4 is dependent on participants paying attention to the sounds and making judgments (Alain et al., 2001). The finding that IQ was negatively predictive of mistuned harmonic segregation and QuickSIN loss is also consistent with the role of top–down processing in sound segregation. Importantly, this evidence that general cognitive function is related to sound segregation abilities does not necessarily undermine the idea of a difficulty with sound segregation processes in SZ. In real-world sound segregation tasks, it is known that difficulties with perception of speech in noisy situations results from a number of high-level factors in addition to bottom-up sensory processing (Committee on Hearing, 1988; Pichora-Fuller et al., 1995).
Acknowledgments
We would like to thank Jason Schwartz for his help in participant recruitment and Vanessa Irsik and Evan Clarkson for help analyzing data.
Role of funding source
This work was supported by a National Institute of Health grant [R21MH079987] and a President's Research Award from the University of Nevada, Las Vegas. Aside from funding, neither UNLV nor NIH had any influence on the design, collection, analysis, nor writing of this manuscript.
Footnotes
Conflict of interest
No conflicts of interest are pronounced by any authors of this study.
Contributors
Erin Ramage and Joel Snyder designed the study. Erin Ramage, Nedka Klimas, Sally Vogel, Mary Vertinski, Breanne Yerkes, Amanda Flores, Griffin Sutton, Erik Ringdahl and Joel Snyder undertook the data collection and data processing. Erin Ramage and Joel Snyder undertook the statistical analyses. Joel Snyder wrote the first draft of the manuscript. Daniel Allen supervised all participant recruitment, screening, and informed consent. All authors edited and approved the final manuscript prior to submission.
These data were previously presented at the Society of Biological Psychiatry 66th Annual Meeting (2012), Philadelphia, PA; and the Association for Research in Otolaryngology 34th MidWinter Meeting (2012), San Diego, CA.
References
- Alain C. Breaking the wave: effects of attention and learning on concurrent sound perception. Hear. Res. 2007;229(1–2):225–236. doi: 10.1016/j.heares.2007.01.011. [DOI] [PubMed] [Google Scholar]
- Alain C, Arnott SR, Picton TW. Bottom–up and top–down influences on auditory scene analysis: evidence from event-related brain potentials. J. Exp. Psychol. Hum. Percept. Perform. 2001;27(5):1072–1089. doi: 10.1037//0096-1523.27.5.1072. [DOI] [PubMed] [Google Scholar]
- Bach DR, Buxtorf K, Strik WK, Neuhoff JG, Seifritz E. Evidence for impaired sound intensity processing in schizophrenia. Schizophr. Bull. 2011;37(2):426–431. doi: 10.1093/schbul/sbp092. [DOI] [PMC free article] [PubMed] [Google Scholar]
- Bregman AS. Auditory Scene Analysis: The Perceptual Organization of Sound. Cambridge, MA: MIT Press; 1990. [Google Scholar]
- Cienfuegos A, March L, Shelley AM, Javitt DC. Impaired categorical perception of synthetic speech sounds in schizophrenia. Biol. Psychiatry. 1999;45(1):82–88. doi: 10.1016/s0006-3223(98)00064-x. [DOI] [PubMed] [Google Scholar]
- Committee on Hearing. Speech understanding and aging. J. Acoust. Soc. Am. 1988;83(3):859–895. [PubMed] [Google Scholar]
- Davalos DB, Kisley MA, Ross RG. Effects of interval duration on temporal processing in schizophrenia. Brain Cogn. 2003;52(3):295–301. doi: 10.1016/s0278-2626(03)00157-x. [DOI] [PubMed] [Google Scholar]
- First MB, Spitzer RL, Gibbon M, Williams JBW. Biometric Research. New York: New York State Psychiatric Institute; 2002. Structured Clinical Interview for DSMIV-TR Axis I Disorders: Research Version, Patient Edition (SCID-I/P) [Google Scholar]
- Gold R, Butler P, Revheim N, Leitman DI, Hansen JA, Gur RC, Kantrowitz JT, Laukka P, Juslin PN, Silipo GS, Javitt DC. Auditory emotion recognition impairments in schizophrenia: relationship to acoustic features and cognition. Am. J. Psychiatry. 2012;169(4):424–432. doi: 10.1176/appi.ajp.2011.11081230. [DOI] [PMC free article] [PubMed] [Google Scholar]
- Javitt DC, Strous RD, Grochowski S, Ritter W, Cowan N. Impaired precision, but normal retention, of auditory sensory (“echoic”) memory information in schizophrenia. J. Abnorm. Psychol. 1997;106(2):315–324. doi: 10.1037//0021-843x.106.2.315. [DOI] [PubMed] [Google Scholar]
- Killion MC, Niquette PA, Gudmundsen GI, Revit LJ, Banerjee S. Development of a quick speech-in-noise test for measuring signal-to-noise ratio loss in normal-hearing and hearing-impaired listeners. J. Acoust. Soc. Am. 2004;116(4):2395–2405. doi: 10.1121/1.1784440. [DOI] [PubMed] [Google Scholar]
- Leitman DI, Foxe JJ, Butler PD, Saperstein A, Revheim N, Javitt DC. Sensory contributions to impaired prosodic processing in schizophrenia. Biol. Psychiatry. 2005;58(1):56–61. doi: 10.1016/j.biopsych.2005.02.034. [DOI] [PubMed] [Google Scholar]
- Leitman DI, Laukka P, Juslin PN, Saccente E, Butler P, Javitt DC. Getting the cue: sensory contributions to auditory emotion recognition impairments in schizophrenia. Schizophr. Bull. 2010;36(3):545–556. doi: 10.1093/schbul/sbn115. [DOI] [PMC free article] [PubMed] [Google Scholar]
- March L, Cienfuegos A, Goldbloom L, Ritter W, Cowan N, Javitt DC. Normal time course of auditory recognition in schizophrenia, despite impaired precision of the auditory sensory (“echoic”) memory code. J. Abnorm. Psychol. 1999;108(1):69–75. doi: 10.1037//0021-843x.108.1.69. [DOI] [PubMed] [Google Scholar]
- McCarley RW, Wible CG, Frumin M, Hirayasu Y, Levitt JJ, Fischer IA, Shenton ME. MRI anatomy of schizophrenia. Biol. Psychiatry. 1999;45(9):1099–1119. doi: 10.1016/s0006-3223(99)00018-9. [DOI] [PMC free article] [PubMed] [Google Scholar]
- Moore BCJ, Peters RW, Glasberg BR. Thresholds for the detection of inharmonicity in complex tones. J. Acoust. Soc. Am. 1985;77(5):1861–1867. doi: 10.1121/1.391937. [DOI] [PubMed] [Google Scholar]
- Pichora-Fuller MK, Schneider BA, Daneman M. How young and old adults listen to and remember speech in noise. J. Acoust. Soc. Am. 1995;97(1):593–608. doi: 10.1121/1.412282. [DOI] [PubMed] [Google Scholar]
- Ramage EM, Weintraub DM, Allen DN, Snyder JS. Evidence for stimulus-general impairments on auditory stream segregation tasks in schizophrenia. J. Psychiatr. Res. 2012;46(12):1540–1545. doi: 10.1016/j.jpsychires.2012.08.028. [DOI] [PMC free article] [PubMed] [Google Scholar]
- Ringe WK, Saine KC, Lacritz LH, Hynan LS, Cullum CM. Dyadic short forms of the Wechsler Adult Intelligence Scale-III. Assessment. 2002;9(3):254–260. doi: 10.1177/1073191102009003004. [DOI] [PubMed] [Google Scholar]
- Rojas DC, Slason E, Teale PD, Reite ML. Neuromagnetic evidence of broader auditory cortical tuning in schizophrenia. Schizophr. Res. 2007;97(1–3):206–214. doi: 10.1016/j.schres.2007.08.011. [DOI] [PMC free article] [PubMed] [Google Scholar]
- Shenton ME, Dickey CC, Frumin M, McCarley RW. A review of MRI findings in schizophrenia. Schizophr. Res. 2001;49(1–2):1–52. doi: 10.1016/s0920-9964(01)00163-3. [DOI] [PMC free article] [PubMed] [Google Scholar]
- Snyder JS, Alain C. Toward a neurophysiological theory of auditory stream segregation. Psychol. Bull. 2007;133:780–799. doi: 10.1037/0033-2909.133.5.780. [DOI] [PubMed] [Google Scholar]
- Strous RD, Cowan N, Ritter W, Javitt DC. Auditory sensory (“echoic”) memory dysfunction in schizophrenia. Am. J. Psychiatry. 1995;152(10):1517–1519. doi: 10.1176/ajp.152.10.1517. [DOI] [PubMed] [Google Scholar]
- Todd J, Michie PT, Schall U, Karayanidis F, Yabe H, Naatanen R. Deviant matters: duration, frequency, and intensity deviants reveal different patterns of mismatch negativity reduction in early and late schizophrenia. Biol. Psychiatry. 2008;63(1):58–64. doi: 10.1016/j.biopsych.2007.02.016. [DOI] [PubMed] [Google Scholar]
- Wechsler D. Wechsler Adult Intelligence Scale. 3rd ed. San Antonio, TX: Psychological Corporation; 1997. [Google Scholar]
- Weintraub DM, Ramage EM, Sutton G, Ringdahl E, Boren A, Pasinski AC, Thaler N, Haderlie M, Allen DN, Snyder JS. Auditory stream segregation impairments in schizophrenia. Psychophysiol. 2012;49(10):1372–1383. doi: 10.1111/j.1469-8986.2012.01457.x. [DOI] [PMC free article] [PubMed] [Google Scholar]
- Wu C, Cao S, Zhou F, Wang C, Wu X, Li L. Masking of speech in people with first-episode schizophrenia and people with chronic schizophrenia. Schizophr. Res. 2012;134(1):33–41. doi: 10.1016/j.schres.2011.09.019. [DOI] [PubMed] [Google Scholar]


