Abstract
China has experienced rapid urbanization and dramatic economic growth since its reform process started in late 1978. In this article, we present evidence for a significant urbanization effect on climate based on analysis of impacts of land-use changes on surface temperature in southeast China, where rapid urbanization has occurred. Our estimated warming of mean surface temperature of 0.05°C per decade attributable to urbanization is much larger than previous estimates for other periods and locations. The spatial pattern and magnitude of our estimate are consistent with those of urbanization characterized by changes in the percentage of urban population and in satellite-measured greenness.
Land-use changes from urbanization, creating an urban heat island (UHI), have been suspected as partially being responsible for the observed warming over land during the last few decades because of (i) the observed decrease in the diurnal temperature range (DTR) resulting from a larger increase or a smaller decrease in minimum temperature relative to maximum temperature and (ii) a lower rate of warming observed over the past 20 years in the lower troposphere compared with the surface (1). The area-weighted average warming effect of UHI over land during the 20th century has been estimated to be <0.06°C per century (1–4) globally and approximately 0.06∼0.15°C per century (5, 6) in the U.S. based on differences in temperature trends between rural and urban stations. A much larger estimate of 0.27°C per century in the U.S. has been reported recently (7) by comparing trends in observed and reanalysis surface temperatures over the period from 1950 to 1999.
China has experienced rapid urbanization and dramatic economic growth since its reform process started in late 1978. From 1978 to 2000, China's gross domestic product grew at an average annual rate of 9.5%, compared with 2.5% for developed countries and 5% for developing countries; the number of small towns soared from 2,176 to 20,312, nearly double that of the world average during this period; the number of cities increased from 190 to 663; and the proportion of urban population rose from 18% to 39% (see the Peopledaily article at http://english.peopledaily.com.cn/200111/27/eng20011127_85410.shtml and the State Family Planning Commission of China web site at www.sfpc.gov.cn/EN/enews20030320-1.htm). In this article, we present evidence for a significant urbanization effect on climate based on analysis of impacts of land-use changes on surface temperature in southeast China, where most of China's urbanization has occurred.
Data and Methods
The UHI effect has been estimated by comparing observed temperatures in urban stations with those in their surrounding rural stations, but such results largely depend on how rural versus urban stations are classified and whether the data are homogeneous (7–9). Population data often are used to identify a station as urban and rural, but such information generally is out-of-date, and thus satellite measurements of night lights have been substituted recently (8, 9). In situ observations suffer from inhomogeneities caused by “nonclimatic” factors such as changes in observation time, instrumentation, location (altitude and latitude), and nonstandard siting (referred to as nonclimatic effects hereafter) (9). These factors could introduce artifacts in long-term observations and rural–urban differences and thus may bias the estimate of UHI. For example, Peterson (9) found no significant impact of UHI in the U.S. after the observed temperature time series were adjusted for such inhomogeneities. The lack of an UHI effect may be caused by micro- and local-scale impacts overwhelming the mesoscale UHI. Industrial sections of towns may well be significantly warmer than rural sites are, but urban meteorological observations are more likely to be made within cool “park islands” than in industrial regions (9). Evidently, the UHI is more complex than usually considered.
Using rural–urban temperature differences to estimate the impacts of urbanization on climate in China may be inappropriate for several reasons. First, most Chinese stations are located in or near cities, with only a few in mountainous or remote regions or on small islands. Although China is comparable in size to the U.S., it has considerably fewer meteorological stations, and each city generally has only one station. For example, each of China's two biggest cities, Beijing and Shanghai, has only one station available in the Chinese network. It is impossible to find a corresponding rural station for most of the urban ones, especially in eastern and southern China. Consequently, if using the rural–urban difference to estimate the UHI, one possibly is comparing temperature between two different urban stations at regional scales or between two different regions at large scales. Furthermore, adjusting spatial and temporal homogeneities for in situ observations in China inadvertently may sacrifice the UHI effect because the adjustments often are performed by comparing a target station with its neighbors that generally also are urban stations and are relatively far away. Second, China's rapid urbanization in the past two decades could transfer a station from rural into urban in a very short period. The continuous expansion in urban population and area makes the classification of urban versus rural stations dynamic. Third, Chinese cities have a much higher density of population and urban buildings than do cities in most developed countries. Cities in the U.S. extend many kilometers to suburban areas where people reside and that can have as much vegetation as rural areas, whereas Chinese cities have a significantly higher density of population, residential buildings, shopping malls, schools, roads, etc., and much less vegetation than their neighboring rural areas because people live within cities. These unique characteristics could make the UHI effect more pronounced in China than in other countries like the U.S. The first two sections of Supporting Text, which is published as supporting information on the PNAS web site, provide the details.
Kalnay and Cai (7) recently introduced a method to estimate the impact of urbanization and other land-use changes on climate by comparing trends in surface temperature recorded by 1,982 meteorological stations with those in the National Centers for Environmental Prediction/National Center for Atmospheric Research (NCEP/NCAR) Reanalysis (R-1) (10). The reanalysis uses the most extensive observations available from a variety of sources including ship, rawinsonde, pibal, aircraft, and satellite, etc., to assimilate these data, with an assimilation system kept unchanged, and has been widely used (10). The R-1 data are influenced strongly by atmospheric vertical soundings of wind and temperature, and surface temperatures are estimated from the atmospheric values (surface observations of temperature, moisture, and wind over land are not used) and thus are not sensitive to changes in land surface (7, 10). Therefore, the differences in surface temperature trends between the observed and R-1 data are postulated to represent the impacts of urbanization and other land-use changes on climate (7).
This method assumes that the quality of R-1 surface air temperatures is satisfactory. One known deficiency with R-1 data is its poor performance in the description of cloudiness and surface moisture, which could bias the computation of the surface energy budget and therefore surface air temperature (11, 12). Increased cloud cover is linked with the worldwide decline in DTR, and increased soil moisture could reduce DTR through enhanced evapotranspiration (11–13). Consequently, differences in clouds and soil moisture between observed and R-1 data could contaminate the UHI estimate. The second deficiency with R-1 data is its poor performance over mountainous regions (7). The model of R-1 has a spatial resolution of 2.5° and thus uses a land surface boundary that is smoother than reality. This smoothing could introduce large biases in the model's altitude or land surface properties relative to the actual meteorological stations and thus in the R-1 temperatures over mountainous areas with varied topography. Trenberth (12) argues that the R-1 does not include effects of changing atmospheric composition such as greenhouse gases and aerosols on radiative forcing. However, the R-1 is able to capture the full strength of climate trends in its observations because the reanalysis assimilates atmospheric temperatures and other observations that are affected by the greenhouse gases and aerosols (14). Peterson (9) and Vose et al. (15) also pointed out that the lack of adjustments for inhomogeneity caused by the nonclimatic effects in the observational data may have introduced uncertainties in the UHI estimate of Kalnay and Cai (7).
Here we adopt the method of Kalnay and Cai (7) to estimate the impact of urbanization and other land-use changes on climate in China but pay more attention to the aforementioned problems. We use observed monthly mean daily maximum and minimum land surface air temperatures at 671 meteorological stations of the Chinese network for the period from January 1979 to December 1998, collected and processed by the National Meteorological Center of the China Meteorological Administration (16). We use the National Centers for Environmental Prediction/Department of Energy (NCEP/DOE) Atmospheric Model Intercomparison Project (AMIP)-II Reanalysis (R-2) (11) covering 1979–present at spatial resolution of ≈1.9° instead of R-1. R-2 data were provided by the National Oceanic and Atmospheric Administration/Cooperative Institute for Research in Environmental Sciences (NOAA/CIRES) Climate Diagnostics Center (Boulder, CO) from www.cdc.noaa.gov. Although based on the widely used R-1, the R-2 has improved its quality by featuring newer physics and observed soil moisture forcing and also by fixing known errors of R-1. For example, the soil wetness evolution is treated completely differently in R-2 than in R-1, and a new cloudiness-relative humidity table is generated to fix the errors in R-1. Consequently, the R-2 data should more accurately characterize soil moisture, cloud, and near surface temperature over land (11). To ensure the reliability of R-2 data, we assess the performance of R-2 temperatures relative to observational data and locate the regions and seasons with the best consistency by considering China's complex topography and climate. To minimize the nonclimatic effects in the observations, we use China's original and homogeneity-adjusted annual mean surface air temperature data (17) to assess the magnitude of these effects across China and choose our study region where such effects are minimal. Furthermore, we use independent data sources from demography and remote sensing to further confirm our results. Details about these procedures can be found in the supporting information.
For each meteorological station, the maximum and minimum temperatures in R-2 are interpolated to its location (longitude and latitude) on the R-2 grid. We aggregate the R-2 data into monthly mean values and calculate a monthly DTR by subtracting the monthly mean minimums from the maximums for both the observational and R-2 data. Monthly anomalies then are calculated by removing the 20-year mean annual cycle. Linear trends for both observed and R-2 data are estimated by using ordinary least squares.
After carefully assessing the data quality, reliability, and homogeneity for both observational and R-2 data, we focus our study on 13 provinces and municipalities in southeast China (20°N–36°N, 102°E–123°E) that consist of 194 spatially well distributed stations, representing an area where most of China's urbanization has occurred (18, 19). This region has (i) the highest meteorological station density; (ii) the most uniform station distribution; (iii) the minimal nonclimatic effects; and (iv) the best consistency between observations and R-2 data in China. The details are described in the supporting information.
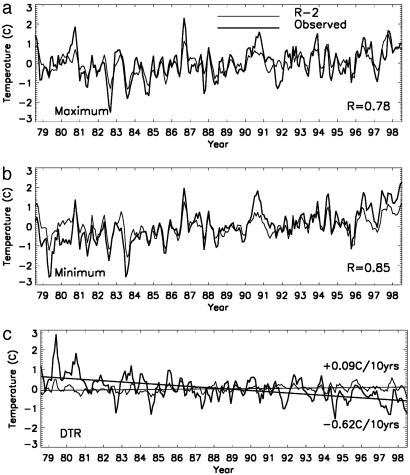
Fig. 1 shows time series of monthly temperature anomalies for Shenzhen, a city with the fastest population growth in China from ≈0.1 million in 1982 to ≈7 million in 2000. The R-2 data are consistent with meteorological observations, with a correlation coefficient of 0.78 and 0.85 for maximum and minimum temperatures, respectively. The minimum temperature in the meteorological data has a larger warming trend than the maximum does, and so DTR decreases (-0.62°C per decade). This change is consistent with commonly reported UHI (20, 21), which has the greatest effect on the minimum temperature. In contrast, the R-2 DTR shows a small increase (0.09°C per decade), suggesting a lower sensitivity to urbanization. Therefore, the observed minus R-2 temperature trends can be largely attributed to urbanization and other land-use changes (7, 14).
Fig. 1.
Monthly temperature anomalies in the observational and R-2 data for Shenzhen, a city with the fastest population growth in China, from January 1979 to December 1998: maximum (a), minimum (b), and DTR (c). A 3-month smoothing is applied. The correlation coefficient between the two data sets (without smoothing) is shown.
To estimate the overall trends over our study region, we average all stations, giving each equal weight because of their uniform distribution in space. Because the R-2 data show the best quality relative to the observational data during winter months (December–February), which is also the season when the cloudiness and soil moisture effects on UHI are minimal both for the R-2 and observations (see more in the supporting information), results in the winter months are show below.
For further information on data, procedures, and results for other seasons, see Supporting Text, Tables 1–3, and Figs. 6–15, which are published as supporting information on the PNAS web site.
Results and Discussion
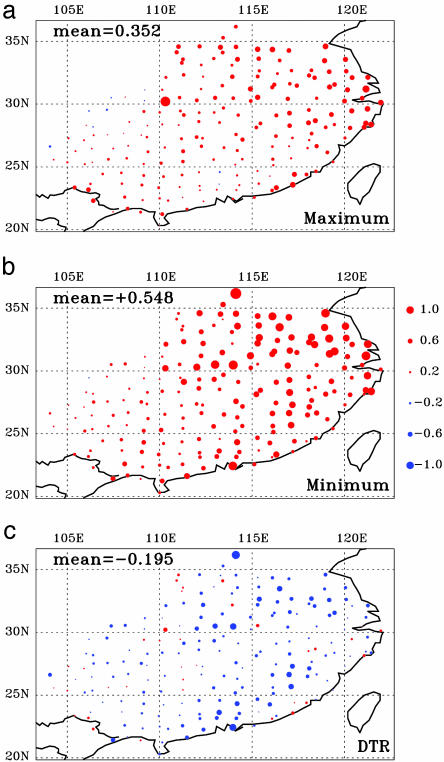
Trends for winter maximum and minimum temperatures and DTR in the observations are shown in Fig. 2. On average, the observed maximum and minimum temperatures increase by 0.352°C and 0.548°C per decade, respectively, and the DTR decreases by 0.195°C per decade. The daily minimum rises faster than the daily maximum, with the largest increase in the northern and eastern areas of the study region. Consequently, the DTR declines at a majority of stations, with the largest decrease in the eastern and southern coastal areas where rapid urbanization has occurred (18, 19).
Fig. 2.
Observed winter temperature trends (in °C per decade) over southeast China from 1979 to 1998: maximum (a), minimum (b), and DTR (c).
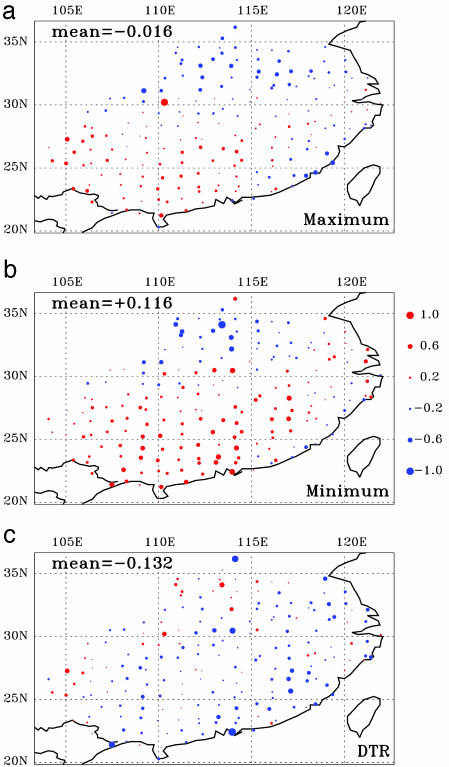
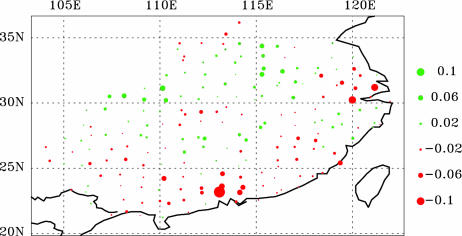
Fig. 3 shows how much of the above observed temperature changes can be attributed to urbanization and other land-use changes. The average differences in maximum and minimum temperature trends between observed and R-2 data are -0.016 and 0.116°C per decade, respectively. The difference in DTR trend is -0.132°C per decade, which is 68% of the observed DTR trend (-0.195°C per decade). The decrease of DTR is greatest in the Yangtze and Pearl River deltas and generally is larger at coastal stations. Note that most Chinese stations are located in or near cities. The spatial pattern and magnitude of changes in the DTR generally are consistent with several indicators for urbanization (e.g., number of towns and cities, urban population, rural–urban migrants, rural laborers transferred to nonagricultural sectors, rural–urban income, and per capita gross domestic product) (19). Consequently, we attribute most of the changes shown in Fig. 3 to urbanization.
Fig. 3.
Observed minus R-2 winter temperature trends (in °C per decade) in southeast China from 1979 to 1998: maximum (a), minimum (b), and DTR (c).
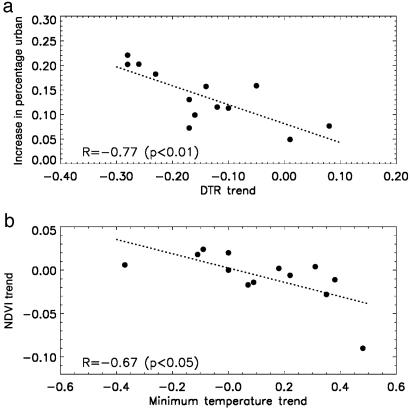
The DTR is particularly susceptible to urban effect (1). If urbanization is responsible for the reduction in DTR, changes in DTR (Fig. 3c) should be correlated with factors known to affect urbanization. The percentage of urban population to the total population (referred to as percentage urban hereafter) has been used as the most important determinant of urbanization in China (19). We use China's fourth (1990) and fifth (2000) census data (22) to measure the changes in percentage urban. The DTR trends are aggregated to the provincial level because data at station level are not available to us. Fig. 4a shows a statistically significant negative correlation (-0.77, p < 0.01) between changes in DTR and those in percentage urban. Areas with the greatest increase in percentage urban have the largest reduction in DTR.
Fig. 4.
Relationship for the DTR trends (in °C per decade; Fig. 3c) versus the increases in percentage urban (a) and the minimum temperature trends (in °C per decade; Fig. 3b) versus summer greenness trends (per decade; Fig. 5) at provincial level (b). The correlation coefficients and their significance level are shown. The dashed line represents a least-squares fit.
Changes in satellite-measured greenness are another indicator of urbanization. Vegetation greenness indices such as the normalized difference vegetation index (NDVI) use red and near-infrared solar radiation reflected back to sensors aboard satellites to signal energy absorption by leaf pigments such as chlorophyll (23). Reflectances for vegetated and urban surfaces differ greatly, and so decreases in NDVI indicate the occurrence of less vegetation. Such decreases should be most pronounced and thus best seen during summer, when vegetation peaks, and become smallest during winter, when the bare soil fraction is largest because urban surfaces are similar to bare soil in their reflectance spectrum. Therefore, we estimate summer NDVI trends for each station with an 8-km resolution data set (23) from 1982 to 1998 as we did for the R-2 data.
The spatial pattern and magnitude of summer NDVI trends (Fig. 5) are generally consistent with those in temperatures (Fig. 3) and land use in China. Satellite greenness decreases substatially over the eastern and southern provinces but increases over the important agricultural areas of northern and western provinces (30°N–35°N). Variations in NDVI exhibit the greatest association with the UHI effect for minimum temperature (see Table 3), as shown in Gallo and Owen (8). The correlation coefficients between changes in NDVI and the observed minus R-2 minimum temperature trends are -0.30 (p < 0.01, sample = 194) at station level and -0.67 (p < 0.05, sample = 13; Fig. 4b) at provincial level.
Fig. 5.
Summer NDVI trends per decade from 1982 to 1998.
Use of remote sensing data for detecting urbanization generally requires fine-resolution (<1 km) imagery (24). Note that the size of NDVI pixel (64 km2) used in this study is coarse relative to that of most cities, especially in the agricultural region. The observed NDVI changes may contain signals other than urbanization, which could vary by station depending on its location relative to the center of NDVI pixel. Hence, the correlation at provincial level may be more representative of urbanization than that at station level because the regional average could reduce uncertainty.
Although a substantial conversion from arable land into built-up areas was identified (25), the observed NDVI increase in 30°N–35°N (Fig. 5) may reflect the climatic effects of both urbanization and increased agricultural planting around the cities, because a substantial rise in crop yield has been reported attributable to increased irrigation and fertilizer application from 1982 to 1999 (26) over this agricultural region. Such an increase over urban areas coincides with the decline in maximum and minimum temperatures (Fig. 3), suggesting a cooling urban effect caused by enhanced evapotranspiration (4, 27). Apparently, the UHI is very complicated and site-dependent.
We also calculate the correlation coefficients like Fig. 4 a and b for other seasons and find that winter is the most reliable season to estimate the UHI effect in China (see more in the supporting information), consistent with (i) the relationship between changes in DTR and those in percentage urban, (ii) the relationship between trends in minimum temperature and those in NDVI, and (iii) the seasonal variations of the R-2 data quality relative to the observational data. Our results also are consistent with the UHI mechanisms (20, 21). Urban and rural areas may differ in cloud cover and rainfall, and this difference should be largest in summer, especially for a marked monsoon climate country like China. Therefore, the UHI should be expected more visible in winter than in summer when both clouds/rainfall and UHI decrease DTR and thus cannot be differentiated in the observations.
The impact of urbanization on climate over our study region is computed by using the observed minus R-2 trend for mean winter surface temperature averaged from the maximum and minimum values. Our estimated warming of mean surface temperature of 0.05°C per decade is much larger than previous estimates (1–7) for other periods and locations, including the estimate of 0.027°C for the continental U.S. (7). A recent study by Li et al. (28) finds that most temperature time series in China are affected by UHI, and they estimated the UHI over our study region of ≈0.011°C per decade based on analyses of the rural–urban differences in annual mean temperature for the period of 1951–2001. Because the present analysis is from the winter season over a period of rapid urbanization and for a country with a much higher population density, we expect our results to give higher values than those estimated in other locations and over longer periods. Therefore, our estimates do not represent the urbanization effect globally, nor do they represent the average of all seasons over the past 100 years for which station temperature data are available.
Some uncertainties may still remain in our estimates, such as the previously discussed nonclimatic effects. To estimate such effects over our study region, we use the original and homogeneity-adjusted annual mean temperature data (28) to compute the difference in temperature trend before and after the adjustments (see more in the supporting information). The regional average difference is 0.002°C per decade, indicating a minimal effect on our estimated UHI. Considering the complexity of the UHI that involves many nonurban impacts, such as incomplete adjustments of data inhomogeneity (9, 15), clouds (4, 13), aerosols (29) (which are largest during spring), and changes in solar radiation and insolation duration (30, 31), our results should be interpreted as illustrative rather than definitive. However, this study draws attention to an important issue that requires further investigation. We need to better characterize the system with observations and better describe and model the complex processes involved. This article is a first step in the development of a quantitative basis for assessing the consequences from temperature of land-use change associated with Chinese urbanization.
Supplementary Material
Acknowledgments
We are grateful to reviewers for their constructive suggestions that have improved this manuscript significantly. This study was supported by National Aeronautics and Space Administration Earth Science Enterprise.
This paper was submitted directly (Track II) to the PNAS office.
Abbreviations: UHI, urban heat island; DTR, diurnal temperature range; R-1, National Centers for Environmental Prediction/National Center for Atmospheric Research (NCEP/NCAR) Reanalysis; R-2, National Centers for Environmental Prediction/Department of Energy (NCEP/DOE) Atmospheric Model Intercomparison Project (AMIP)-II Reanalysis; NDVI, normalized difference vegetation index.
References
- 1.Intergovernmental Panel on Climate Change (2001) in Climate Change 2001: The Scientific Basis, eds. Houghton, J. T., Ding, Y., Griggs, D. J., Noguer, M., van der Linden, P. J., Dai, X., Maskell, K. & Johnson, C. A. (Cambridge Univ. Press, Cambridge, U.K.).
- 2.Jones, P. D., Groisman, P. Ya., Coughlan, M., Plummer, N., Wang, W.-C. & Karl, T. R. (1990) Nature 347, 169-172. [Google Scholar]
- 3.Easterling, D. R., Horton, B., Jones, P. D., Peterson, T. C., Karl, T. R., Parker, D. E., Salinger, M. J., Razuvayev, V., Plummer, N., Jamason, P., et al. (1997) Science 277, 364-367. [Google Scholar]
- 4.Karl, T. R., Jones, P. D., Knight, R. W., Kukla, G., Plummer, N., Razuvayev, V., Gallo, K. P., Lindseay, J., Charlson, R. J. & Peterson, T. C. (1993) Bull. Am. Meteorol. Soc. 74, 1007-1024. [Google Scholar]
- 5.Hansen, J., Ruedy, R., Sato, Mki., Imhoff, M., Lawrence, W., Easterling, D., Peterson, T. & Karl, T. (2001) J. Geophys. Res. 106, 23947-23963. [Google Scholar]
- 6.Gallo, K. P., Owen, T. W., Easterling, D. R. & Jamason, P. F. (1999) J. Clim. 12, 1344-1348. [Google Scholar]
- 7.Kalnay, E. & Cai, M. (2003) Nature 423, 528-531. [DOI] [PubMed] [Google Scholar]
- 8.Gallo, K. P. & Owen, T. K. (1999) J. Appl. Meteor. 36, 806-813. [Google Scholar]
- 9.Peterson, T. C. (2003) J. Clim. 16, 2941-2959. [Google Scholar]
- 10.Kistler, R., Kalnay, E., Collins, W., Saha, S., White, G., Woollen, J., Chelliah, M., Ebisuzaki, W., Kanamitsu, M., Kousky, V., et al. (2001) Bull. Am. Meteorol. Soc. 82, 247-268. [Google Scholar]
- 11.Kanamitsu, M., Ebisuzaki, W., Woollen, J., Yang, S.-K., Hnilo, J. J., Fiorino, M. & Potter, G. L. (2002) Bull. Am. Meteorol. Soc. 83, 1631-1643. [Google Scholar]
- 12.Trenberth, K. E. (2004) Nature 427, 213-213. [DOI] [PubMed] [Google Scholar]
- 13.Dai, A., Genio, A. D. Del & Fung, I. Y. (1997) Nature 386, 665-666.9109484 [Google Scholar]
- 14.Cai, M. & Kalnay, E. (2004) Nature 427, 214. [Google Scholar]
- 15.Vose, R. S., Karl, T. R., Easterling, D. R., Williams, C. N. & Menne, M. J. (2004) Nature 427, 214. [DOI] [PubMed] [Google Scholar]
- 16.Fang, J. Y., Piao, S. L., Tang, Z. Y., Peng, C. H. & Ji, W. (2001) Science 293, 1723. [DOI] [PubMed] [Google Scholar]
- 17.Li, Q., Liu, X., Zhang, H., Peterson, T. C. & Easterling, D. R. (2004) Adv. Atmos. Sci. 21, 1-9. [Google Scholar]
- 18.Seto, K. C., Kaufmann, R. K. & Woodcock, C. E. (2000) Nature 406, 121. [DOI] [PubMed] [Google Scholar]
- 19.Liu, S., Li, X. & Zhang, M. (2003) in Scenario Analysis on Urbanization and Rural–Urban Migration in China, Interim Report IR-03-036 (International Inst. for Applied Systems Analysis, Vienna, Austria), www.iiasa.ac.at/Publications/Documents/IR-03-036.pdf.
- 20.Oke, T. (1987) Boundary Layer Climates (Methuen, London).
- 21.Arnfield, A. J. (2003) Int. J. Climatol. 23, 1-26. [Google Scholar]
- 22.Lavely, W. (2001) Popul. Dev. Rev. 27, 755-769. [Google Scholar]
- 23.Zhou, L., Tucker, C. J., Kaufmann, R. K., Slayback, D., Shabanov, N. V. & Myneni, R. B. (2001) J. Geophys. Res. 106, 20069-20083. [Google Scholar]
- 24.Carlson, T. (2003) Remote Sens. Environ. 86, 273-274. [Google Scholar]
- 25.Liu, J., Liu, M., Zhuang, D., Zhang, Z. & Deng, X. (2003) Sci. China D 46, 373-384. [Google Scholar]
- 26.Editorial Committee for China's Agricultural Yearbook (2000) China's Agricultural Yearbook 1999 (Agriculture Press, Beijing).
- 27.Bounoua, L., Collatz, G. J., Los, S. O., Sellers, P. J., Dazlich, D. A., Tucker, C. J. & Randall, D.A. (2000) J. Clim. 13, 2277-2292. [Google Scholar]
- 28.Li, Q., Zhang, H., Liu, X. & Huang, J. (2004) Theor. Appl. Climatol., in press.
- 29.Luo, Y., Lu, D., He, Q., Li, W. & Zhou, X. (2000) Chinese Sci. Bull. 45, 1328-1333. [Google Scholar]
- 30.Li, X., Zhou, X., Li, W. & Chen, L. (1995) Acta Meteorolog. Sinica 9, 57-68. [Google Scholar]
- 31.Chen, L., Zhu, W., Wang, W., Zhou, X. & Li, W. (1998) Acta Meteorolog. Sinica 12, 1-17. [Google Scholar]
Associated Data
This section collects any data citations, data availability statements, or supplementary materials included in this article.


