Abstract
Default mode network (DMN) has been reported altered in schizophrenia (SZ) using static connectivity analysis. However, the studies on dynamic characteristics of DMN in SZ are still limited. In this work, we compare dynamic connectivity within DMN between 82 healthy controls (HC) and 82 SZ patients using resting-state fMRI. Firstly, dynamic DMN was computed using a sliding time window method for each subject. Then, the overall connectivity strengths were compared between two groups. Furthermore, we estimated functional connectivity states using K-means clustering, and then investigated group differences with respect to the connectivity strengths in states, the dwell time in each state, and the transition times between states. Finally, graph metrics of time-varying connectivity patterns and connectivity states were assessed. Results suggest that measured by the overall connectivity, HC showed stronger inter-subsystem interaction than patients. Compared to HC, patients spent less time in the states with nodes tightly connected. For each state, SZ patients presented relatively weaker connectivity strengths mainly in inter-subsystem. Patients also exhibited lower values in averaged node strength, clustering coefficient, global efficiency, and local efficiency than HC. In summary, our findings indicate that SZ showed impaired interaction among DMN subsystems, with a reduced central role for posterior cingulate cortex (PCC) and anterior medial prefrontal cortex (aMPFC) hubs as well as weaker interaction between dorsal medial prefrontal cortex (dMPFC) subsystem and medial temporal lobe (MTL) subsystem. For SZ, decreased integration of DMN may be associated with impaired ability in making self-other distinctions and coordinating present mental states with episodic decisions about future.
Keywords: dynamic functional connectivity, default mode network, fMRI, schizophrenia, connectivity states
1. Introduction
Studies based on blood oxygenation-level dependent (BOLD) functional magnetic resonance imaging (fMRI) have revealed the presence of high temporal correlation among anatomically separate but functionally connected brain regions, implying brain functional networks (Sporns, 2014). Multiple functional networks have been detected using fMRI, mainly including vision network, motor and sensory network, attention network, and default mode network (DMN). DMN, which is thought to underlie processes of internal stimuli, self-reflection, or internal narrative (Andrews-Hanna, 2012; Andrews-Hanna et al., 2014; Buckner, 2013), is one of the most widely studied functional networks using resting-state fMRI.
Traditionally, functional networks derived from fMRI data are computed using the BOLD signal of the entire scan time (5 minutes or longer), assuming that functional connectivity among brain regions is static. However, recent work has shown temporal dynamics of functional connectivity (Calhoun et al., 2014). This dynamic functional connectivity, which varies over a time frame of seconds, may be highly related to unconstrained mental activity in the resting state (Allen et al., 2014; Hutchison et al., 2013; Zalesky et al., 2014). A widely applied method for temporal dynamics analysis is the sliding time window method (Di and Biswal, 2015; Hutchison et al., 2013; Sakoglu et al., 2010). Using the method, the entire BOLD signal is divided into periods of windows, which are then used to construct window based brain functional connectivity. The derived time-varying functional connectivity patterns under varied windows reflect the dynamics of brain functional network and thereby are expected to facilitate our understanding of mechanism underlying the mental disease.
Schizophrenia (SZ) is a complex psychiatric disorder with altered perception, cognition, thought processes, and behaviors, for which biomarkers are still lacking. Brain-imaging studies suggest that SZ is a disorder with altered brain structure and function (Fitzsimmons et al., 2013; Skudlarski et al., 2010). Previous studies using static connectivity analysis methods have demonstrated that SZ patients exhibited dysfunction in multiple networks (Baker et al., 2014; Calhoun et al., 2009; Lynall et al., 2010; Repovs et al., 2011; Rotarska-Jagiela et al., 2010), especially in DMN (Broyd et al., 2009; Garrity et al., 2007; Meda et al., 2014; Tang et al., 2013; Whitfield-Gabrieli et al., 2009). Since DMN has been found to be involved in cognitive and social processing, symptoms of SZ relating to deficits in social cognition function may be associated with the impairment of DMN. Disrupted DMN with reduced functional connectivity among network nodes has been observed in SZ patients (Bastos-Leite et al., 2015; Bluhm et al., 2007; Bluhm et al., 2009; Camchong et al., 2011; Jang et al., 2011), although inconsistent findings exist (Whitfield-Gabrieli et al., 2009; Zhou et al., 2007). Furthermore, there is evidence (Andrews-Hanna et al., 2010; Andrews-Hanna et al., 2014; Buckner et al., 2008; Uddin et al., 2009), which supports that brain regions within DMN contribute to specialized functions underlying subsystems. Some studies (Chang et al., 2014; Dodell-Feder et al., 2014) have reported reduced activation within subsystems of DMN in SZ patients. Using independent component analysis (ICA), Garrity et al. (Garrity et al., 2007) revealed impaired interaction between anterior and posterior regions of DMN in SZ patients. A recent study (Bastos-Leite et al., 2015) analyzed effective connectivity within DMN, and observed relatively weaker connectivity between anterior frontal and posterior cingulate in patients with first-episode SZ. However, the studies on alteration of connectivities among different subsystems of DMN are still limited. Moreover, most previous work used a static analysis method to extract functional networks. Recently, some studies (Damaraju et al., 2014; Rashid et al., 2014; Yu et al., 2015) compared SZ patients and healthy controls using dynamic functional network connectivity (dFNC), and observed abnormal interaction among networks that include DMN. The dFNC (Allen et al., 2014) was estimated using correlation between windowed time courses of networks which are extracted by ICA. However, to the best of our knowledge, no studies have focused on dynamic connectivity within DMN in SZ, especially the interaction among DMN subsystems. It is important to investigate the aberrance in SZ with respect to inter-subsystem dynamic connectivity of DMN, due to that DMN subsystems contribute to different cognition functions.
The aim of this study is to evaluate the difference of dynamic connectivity within DMN between healthy controls (HC) and SZ patients using resting-state fMRI. Our major contributions involve the following aspects: (1) whether SZ patients show altered functional connectivity strengths compared to HC in dynamic DMN, and which DMN regions or subsystems were disrupted in SZ; (2) whether dynamic DMN of these two groups undergoes different functional connectivity states. And if so, what kind of aberrance occurred in connectivity states of SZ patients; and finally, (3) whether the graph theory based metrics in terms of dynamic DMN are different between the two groups.
2. Materials and methods
2.1 fMRI data acquisition and preprocessing
Resting-state fMRI were collected from 82 HC (age: 37.7 ± 10.8, 19 females) and 82 SZ patients (age: 38.0 ± 14.0, 17 females) scanned on a 3-Tesla Siemens Trio scanner with a 12-channel radio frequency coil at the Mind Research Network. All participants provided written, informed consent according to the Mind Research Network institutional guidelines. Age of the two groups showed no significant group difference (two-sample t-test, p=0.87). Schizophrenia was diagnosed according to DSMIV-TR criteria on the basis of a structured clinical interview. Patients were assessed with the positive and negative syndrome scale (PANSS): positive score: 15.3 ± 4.8, range 7–29; negative score: 15.1±5.3, range 8–29. All patients were prescribed a variety of psychoactive medications. Additional information of these participants can be found in (Yu et al., 2015). The functional scans were acquired using gradient echo planar imaging (EPI) with the following parameters: echo time (TE) = 29 ms, repeat time (TR) = 2 s, flip angle = 75°, slice thickness = 3.5 mm, slice gap = 1.05 mm, field of view 240 mm, matrix size = 64×64, voxel size = 3.75 mm × 3.75 mm × 4.55 mm. Resting state scans consisted of 150 whole brain images. During data acquisition, subjects were asked to remain alert with eyes open and keep their head still.
An preprocessing pipeline developed at the Mind Research Network (Bockholt et al., 2010) was used to preprocess the fMRI data. INRIalign (Freire et al., 2002) was used to realign the images. Then the data were spatially normalized to the standard Montreal Neurological Institute (MNI) space, resampled to 3 mm × 3 mm × 3 mm voxels using the nonlinear (affine + low frequency direct cosine transform basis functions) registration implemented in SPM8 toolbox (http://www.fil.ion.ucl.ac.uk/spm), and smoothed using a Gaussian kernel with a small full-width at half-maximum of 5 mm.
2.2 Computation of dynamic connectivity within DMN
According to previous work (Andrews-Hanna et al., 2010; Dodell-Feder et al., 2014; Kucyi and Davis, 2014), 11 regions of interest (ROIs) were defined using 8 mm radii spheres (see Fig. 1 and Table 1). These ROIs comprise posterior cingulate cortex (PCC), anterior medial prefrontal cortex (aMPFC), dorsal medial prefrontal cortex (dMPFC), temporo-parietal junction (TPJ), lateral temporal cortex (LTC), temporal pole (TempP), ventral medial prefrontal cortex (vMPFC), posterior inferior parietal lobule (pIPL), retrosplenial cortex (Rsp), parahippocampal cortex (PHC), and hippocampal formation (HF). Similar to previous work (Andrews-Hanna et al., 2010; Dodell-Feder et al., 2014), only left-lateralized or midline regions were applied in this study in order to prevent biasing the connectivity structure toward the strong correlations between the mirrored ROIs. Andrews-Hanna et al. (Andrews-Hanna et al., 2010; Andrews-Hanna et al., 2014) have suggested that DMN can be partitioned into two core hubs (PCC and aMPFC) and two additional subsystems that include dMPFC subsystem and medial temporal lobe (MTL) subsystem. The two core hubs contribute to constructing personal meaning from salient information. The dMPFC subsystem including dMPFC, TPJ, LTC, and TempP is engaged in thoughts about the present states of one’s self and/or other people. The MTL subsystem, comprising vMPFC, pIPL, Rsp, PHC, and HF, has been shown to be activated when decisions involve constructing a mental scene based on memory in some work (Andrews-Hanna et al., 2010), and is also reported to be engaged preferentially when the participants made episodic decisions about their future (Andrews-Hanna et al., 2014; Li et al., 2014; Schacter and Addis, 2007; Supek and Aine, 2014). Evidence (Supek and Aine, 2014) suggests that the MTL subsystem is related to the act of simulating the future using mnemonic imagery-based processes rather than to temporal aspects of the future per se. Both dMPFC and MTL subsystems were reported to be strongly correlated with the two hubs when people make self-relevant affective decisions. For simplicity, we also referred to the two core hubs as subsystems hereinafter.
Fig. 1.
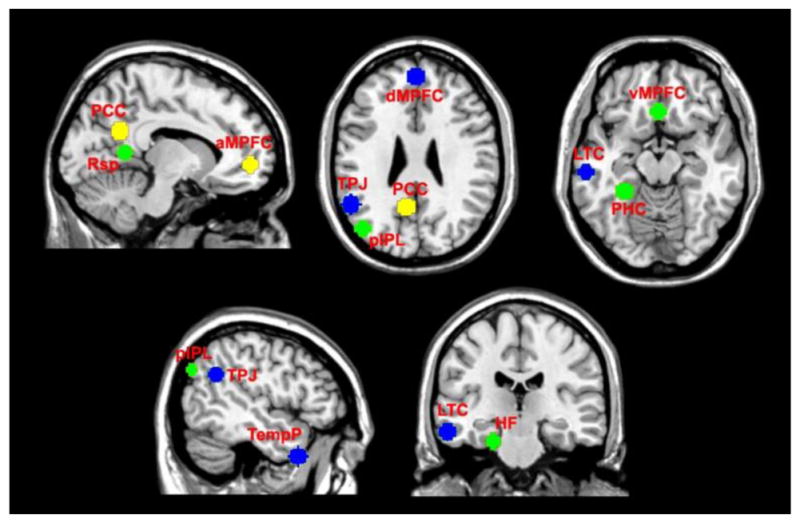
Eleven regions of interest (ROIs) in default mode network (DMN). These ROIs were defined using 8 mm radii spheres, including the two hubs denoted by yellow color, the dMPFC subsystem denoted by blue color, and the MTL subsystem denoted by green color. The two hubs include posterior cingulate cortex (PCC) and anterior medial prefrontal cortex (aMPFC). The dMPFC subsystem includes dorsal medial prefrontal cortex (dMPFC), temporo-parietal junction (TPJ), lateral temporal cortex (LTC), and temporal pole (TempP). The MTL subsystem includes ventral medial prefrontal cortex (vMPFC), posterior inferior parietal lobule (pIPL), retrosplenial cortex (Rsp), parahippocampal cortex (PHC), and hippocampal formation (HF).
Table 1.
Montreal Neurological Institute (MNI) coordinates of 11 DMN regions of interest (ROIs)
| ROI name | Coordinates (x, y, z) |
|---|---|
| posterior cingulate cortex (PCC) | (−8, −56, 26) |
| anterior medial prefrontal cortex (aMPFC) | (−6, 52, −2) |
| dorsal medial prefrontal cortex (dMPFC) | (0, 52, 26) |
| temporo-parietal junction (TPJ) | (−54, −54, 28) |
| lateral temporal cortex (LTC) | (−60, −24, −18) |
| temporal pole (TempP) | (−50, 14, −40) |
| ventral medial prefrontal cortex (vMPFC) | (0, 26, −18) |
| posterior inferior parietal lobule (pIPL) | (−44, −74, 32) |
| retrosplenial cortex (Rsp) | (−14, −52, 8) |
| parahippocampal cortex (PHC) | (−28, −40, −12) |
| hippocampal formation (HF) | (−22, −20, −26) |
Based on these ROIs, dynamic connectivities within DMN were computed for each subject as follows. Firstly, we averaged the BOLD time-series of voxels within each ROI as the representative signal of the ROI. Those representative signals denoted by Xi (i = 1,2, …, 11) were then processed via regressing head motion, detrending, and band pass filtering (0.01Hz–0.08Hz). Next, each Xi was segmented into windowed time-series Yi,w (w = 1,2, …, n), where n is the number of windows, w is the window ID. In this paper, a tapered window created by convolving a rectangle (width = 20 TRs) with a Gaussian (σ = 3 TRs) was used, with the slide in steps of 1 TR (Allen et al., 2014). The width of each window was set to 20 TRs (40 s), because previous work (Zalesky and Breakspear, 2015) showed the setting did not suppress the BOLD frequencies beyond 0.01Hz. Afterwards, for each window w, a 11 × 11 functional connectivity matrix Rw was calculated to reflect the connectivities between all pairs of Yi,w (i = 1,2, …, 11) (Allen et al., 2014; Damaraju et al., 2014). Each connectivity matrix Rw was estimated from the regularized inverse covariance matrix (Smith et al., 2011) using the graphical LASSO framework (Friedman et al., 2008). The sparsity was imposed by placing a penalty on the L1 norm of the inverse covariance matrix. Therefore, for each subject, n functional connectivity matrices Rw (w = 1,2, …, n) were obtained, which reflected its dynamic DMN during the whole scan time.
2.3 Comparing the overall functional connectivity strength within dynamic DMN
In order to investigate whether SZ patients exhibit aberrant functional connection in dynamic DMN, we compared those two groups based on the overall functional connectivity strengths. Firstly, the functional connectivity matrices Rw (w = 1,2, …, n) are averaged across all windows, resulting in an overall functional connectivity matrix for each subject. Then, for each connectivity strength corresponding to paired ROIs in the overall functional connectivity matrix, HC group and SZ patients group were compared using a two-tailed two-sample t-test (p<0.05 with family-wise error (FWE) correction for multiple comparisons). Furthermore, based on each discriminative functional connectivity identified using two-sample t-test, we computed Pearson correlation coefficients between the connectivity strengths after regressing out age and gender covariates and PANSS positive/negative scores for SZ patients group. The significance level was adjusted for p<0.05 (without correction) for each functional connectivity. In addition, for demonstrating the dynamic DMN connectivity patterns of both groups, the overall functional connectivity matrices were also averaged across subjects for each group.
2.4 Investigating difference in functional connectivity states
Recent work has observed the transitions of functional network between different functional connectivity states (Allen et al., 2014; Damaraju et al., 2014; Rashid et al., 2014; Yaesoubi et al., 2015a; Yaesoubi et al., 2015b; Yu et al., 2015). We expected that functional connectivity states would offer interesting insights for understanding SZ. Considering the functional connectivity patterns reoccur across windows and subjects, we initially applied K-means clustering to extract the common (group-level) functional connectivity states (Damaraju et al., 2014), and then estimated the subject-specific functional connectivity states for each subject. Subsequently, based on the subject-specific states, we compared HC group and SZ patients group with respect to the connectivity strength in corresponding states, the dwell time in each state, and the transition times between states. The detailed processing is described as follows.
K-means clustering with 100 repetitions was employed to cluster the functional connectivity matrices obtained from all windows of 164 subjects. While applying K-means clustering, we used correlation to measure similarity between functional connectivity matrices of different windows (Damaraju et al., 2014). Since each functional connectivity matrix Rw can be represented by a feature vector consisting of the upper triangle elements of the matrix, the similarity between any paired functional connectivity matrices was measured by Pearson correlation coefficient between their corresponding feature vectors. The centroids of the resulting clusters from K-means were regarded as the common functional connectivity states across windows and subjects (Damaraju et al., 2014). The number of clusters was set to 2, due to that under this setting time-varying functional connectivity of most subjects were successfully grouped. In addition, we also specified the number of clusters as 4 for test, and the related results can be found in supplementary materials. Afterwards, for each subject, its time-varying functional connectivity patterns assigned into the same cluster were averaged to reflect the corresponding subject-specific functional connectivity state.
Based on the subject-specific states corresponding to the same group-level state, the difference in each connectivity strength between HC group and SZ patients group were evaluated using a two-tailed two-sample t-test (p<0.05 with FWE correction). Note that some states may not exist for specific subjects, in which case the statistical analysis on a given state was only performed for subjects who had windows that were assigned to the related cluster. In order to assess the dwell time in each state, for each subject, we computed the number of windows belonging to this state related cluster. Subsequently, the dwell time in each state was compared between HC and SZ patients using a two-tailed two-sample t-test. In addition, to examine the reliability of states, we also counted the transition times between states for each subject, and then evaluated the difference in transition times between two groups using a two-tailed two-sample t-test.
2.5 Investigating difference in graph metrics of dynamic DMN
Graph metrics of both functional (Liu et al., 2008; Lynall et al., 2010; Yu et al., 2013) and anatomical (van den Heuvel et al., 2010) networks have been reported to be altered in SZ patients. In this section, we focus on the graph metrics of dynamic DMN derived from resting-state fMRI data. For each subject, based on each window related functional connectivity matrix Rw, the elements in Rw were firstly changed to their absolute values. And then, new matrix Gw was incorporated sparsity by using a threshold, preserving half of the highly connected values (sparsity=0.5). Thus, for each subject, n time-varying graphs Gw (w = 1,2, …, n) were obtained. For each graph Gw, graph theory based metrics including the averaged node strength, clustering coefficient, global efficiency, and local efficiency (Rubinov and Sporns, 2010) were calculated using the Brain Connectivity Toolbox (https://sites.google.com/site/bctnet/). In order to investigate the group difference, for each graph metric, we averaged the time-varying graph metrics across all windows for each subject, and then performed a two-tailed two-sample t-test on the mean graph metric between HC group and SZ patients group. We also assessed whether the graph metrics of the subject-specific functional connectivity states were different between the two groups. Similar to the manner applied to the time-varying connectivity matrices, the graph metrics of each subject-specific state were calculated. A two-tailed two-sample t-test was then implemented on each graph metric between HC group and SZ group. The significance level was adjusted for p<0.05 (without correction) for each functional connectivity.
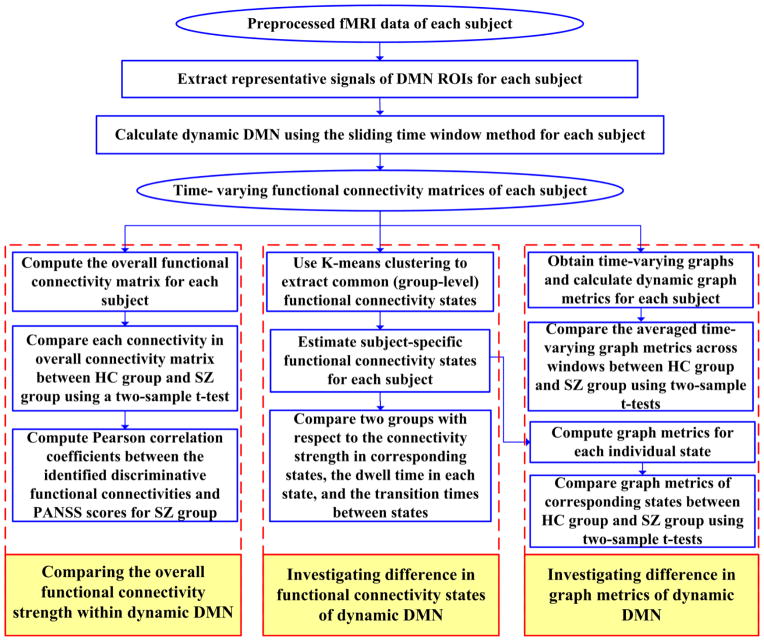
The overall processing flowchart is shown in Fig. 2, which includes the above mentioned analyses.
Fig. 2.
Overall processing flowchart. The analyses include four steps: (1) calculating time-varying functional connectivity matrices of each subject based on DMN ROIs using the sliding time window method, (2) comparing the overall functional connectivity strength within dynamic DMN, (3) investigating difference in functional connectivity states of dynamic DMN, and (4) investigating difference in graph metrics of dynamic DMN.
3. Results
3.1 Dynamic connectivity within DMN
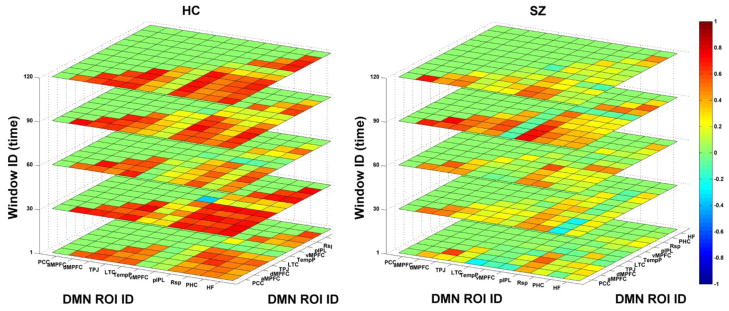
Fig. 3 displays functional connectivity matrices of dynamic DMN in five windows for one HC and one SZ patient. Results illustrate that functional connectivity patterns varied along time (windows) for both subjects. Network patterns corresponding to different windows from the same subject were similar to some extent. Furthermore, it can be seen in this example that dynamic DMN of this SZ patient had lower functional connectivity strengths compared to that of the HC.
Fig. 3.
Functional connectivity matrices of dynamic DMN in five time windows for one healthy control (HC) and one schizophrenia (SZ) patient, respectively. Both x-label and y-label denote the defined 11 regions of interest (ROI) ID. The z-label denotes the window ID.
3.2 Difference in the overall connectivity strength within dynamic DMN
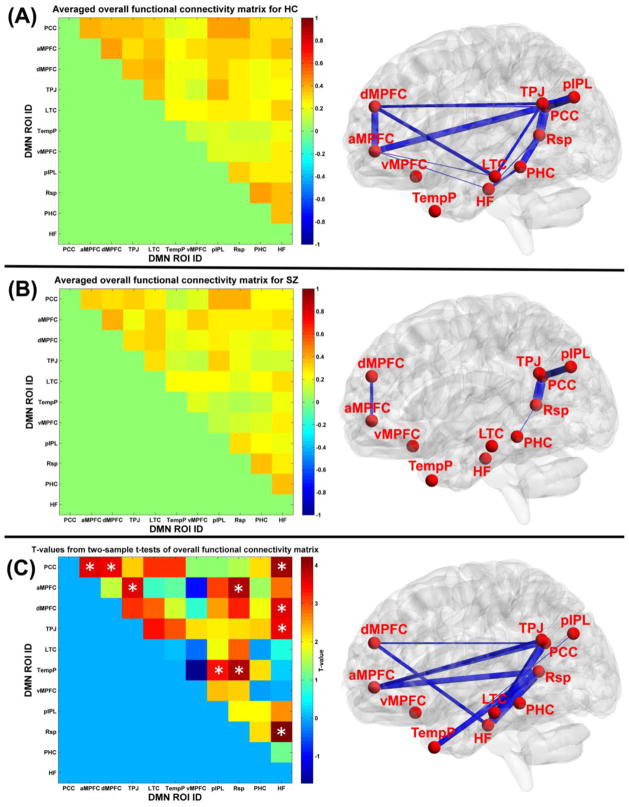
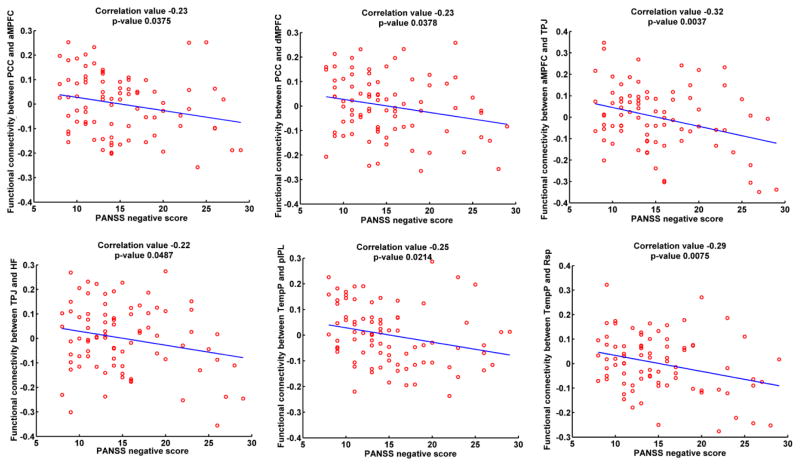
Fig. 4(A) displays the averaged overall functional connectivity matrix across subjects for HC group and its visualized network patterns using BrainNet Viewer software (Xia et al., 2013). The related results for SZ group are shown in Fig. 4(B). It is observed that in general the overall DMN connectivity pattern from HC group was similar to that from SZ group. However, most of the connectivity strengths of HC group were greater than those of SZ group. As displayed in Fig. 4(C), the significantly decreased functional connectivity (p<0.05 with FWE correction) in SZ group with positive t-values included PCC-aMPFC, PCC-dMPFC, PCC-HF, aMPFC-TPJ, aMPFC-Rsp, dMPFC-HF, TPJ-HF, TempP-pIPL, TempP-Rsp, and Rsp-HF. Most of these significantly aberrant connectivities involved different subsystems within DMN, except that Rsp-HF was a connectivity within the MTL subsystem. Furthermore, as shown in Fig. 5, connectivity strengths relating to PCC-aMPFC, PCC-dMPFC, aMPFC-TPJ, TPJ-HF, TempP-pIPL and TempP-Rsp were significantly negatively correlated with PANSS negative scores in SZ group. The results support that the inter-subsystem interaction within DMN diminished in SZ patients.
Fig. 4.
(A) The averaged overall functional connectivity matrix and its visualized network pattern thresholded by 0.35 for HC group. (B) The averaged overall functional connectivity matrix and its visualized network pattern thresholded by 0.35 for SZ patients group. In the right panels of (A) and (B), the thickness of each blue line reflects the functional connectivity strength. (C) Left: The two-sample t-test results from comparing the overall functional connectivity matrices between HC group and SZ group. White “*” denotes the significantly decreased functional connectivity (p<0.05 with family-wise error (FWE) correction) in SZ patients group. Right: Visualization of the significant aberrant connectivities. Each aberrant connectivity is denoted by a blue line, whose thickness reflects the t-value.
Fig. 5.
Significant correlations (with p-value<0.05) between the identified discriminative functional connectivity strengths after regressing out age and gender covariates in the overall functional connectivity matrix and PANSS positive/negative scores for SZ group.
3.3 Difference in functional connectivity states
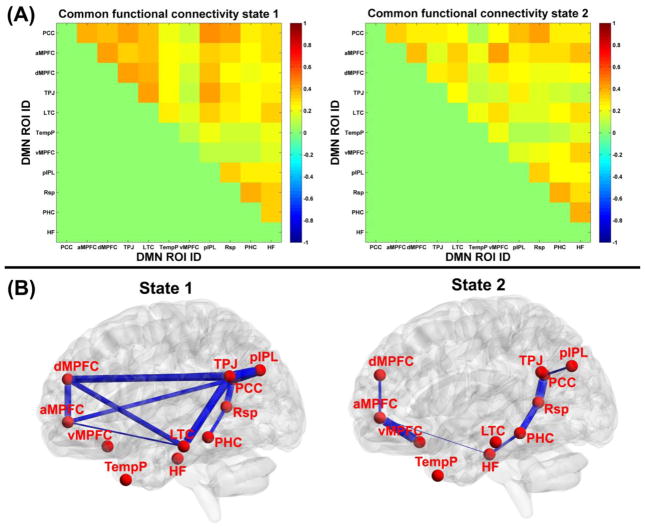
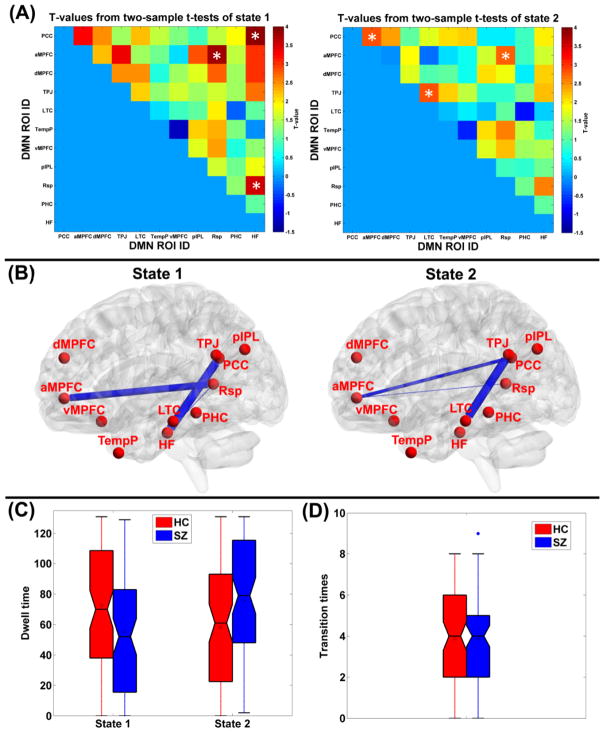
The common functional connectivity states and the corresponding visualized connectivity patterns are shown in Fig. 6(A) and Fig. 6(B), respectively. The results reveal that two different functional connectivity states existed in dynamic DMN. Compared to state 2, state 1 exhibited stronger connectivity strengths for both intra-subsystem and inter-subsystem. By estimating the subject-specific states for each subject based on the common states, specifically, 80 HC and 76 SZ patients had the subject-specific state 1, and 77 HC and 82 SZ patients had the subject-specific state 2. Fig. 7(A)-(B) display the two-sample t-tests results from comparing the subject-specific states between HC group and SZ patients group. In state 1, significantly higher connectivity strength (p<0.05 with FWE correction) including PCC-HF, aMPFC-Rsp, and Rsp-HF were observed in HC group, compared to SZ group. Among those altered connectivities in state 1, PCC-HF and aMPFC-Rsp involved different subsystems, while Rsp-HF came from the MTL subsystem. In state 2, no significant group difference was found, and the slightly reduced connectivity strengths (p<0.05 without FWE correction) in SZ group included aMPFC-PCC, TPJ-LTC, and aMPFC-Rsp. Among those harmed connecitivities in state 2, aMPFC-PCC and aMPFC-Rsp reflected interaction between different subsystems, while TPJ-LTC was a connectivity of the dMPFC subsystem. In summary, HC presented higher connectivity strengths than SZ patients primarily in terms of DMN inter-subsystem interaction, although slightly alteration with decreased values were also found for intra-subsystem connections. With respect to the dwell time in states, Fig. 7(C) shows that SZ patients spent significantly (p=0.0029 in two-sample t-test) less dwell time in state 1, whose nodes were tightly connected. In addition, as shown in Fig. 7(D), there was no significant difference in states transition times between these two groups, indicating that variability of the network dynamics for those two groups were similar. The results relating to the states number as 4 can be found in supplementary Fig. S1 and Fig. S2, and the conclusion is similar.
Fig. 6.
(A) The common functional connectivity states extracted by clustering the connectivity patterns from all windows of all subjects using K-means. (B) The visualized patterns of the common functional connectivity states thresholded by 0.35, and the thickness of each blue line reflects the functional connectivity strength in states.
Fig. 7.
(A) Two-sample t-test results by comparing each connectivity strength in subject-specific functional connectivity states between HC group and SZ patients group. (B) The visualized aberrant connectivities (p<0.05 with family-wise error (FWE) correction) for state 1 and the visualized aberrant connectivities (p<0.05, without correction) for state 2. The thickness of each blue line reflects the related t-value. Those connectivities are also denoted using white “*” in (A). (C) The dwell time in states of each subject, shown using boxplot for HC group (red) and the SZ patients group (blue), respectively. (D) The inter-state transition times of each subject, shown using boxplot for HC group (red) and SZ group (blue), respectively. For each boxplot, the central line is the median, the square is the mean value, and the edges of the box are the 25th and 75th percentiles. The whiskers extend to 1 inter-quartile range, and each outlier is displayed using a red/blue “*” sign. Subsequent boxplots are formatted similarly.
3.4 Difference in graph metrics of dynamic DMN
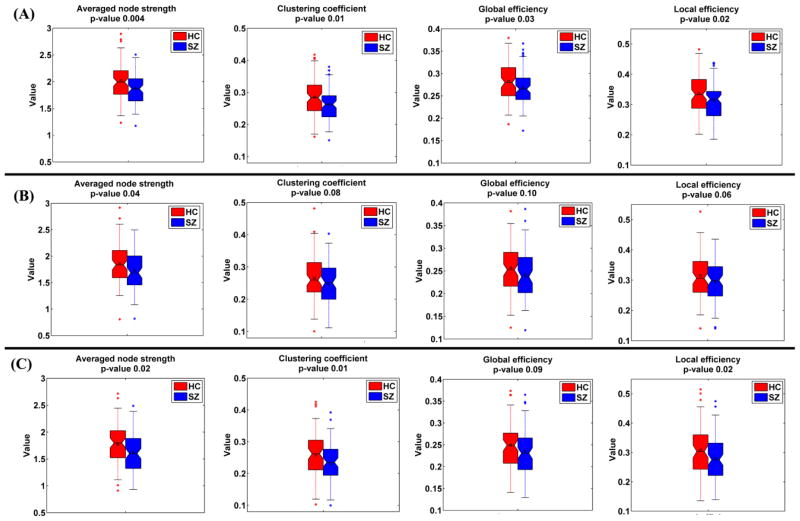
In Fig. 8(A), each sample in boxplot denotes the mean graph metric of one subject. Two-sample t-tests results of the mean graph metrics indicate that all graph metrics of dynamic DMN in HC group were significantly higher (all p-values < 0.03) than that in patients group. Similarly, the graph metrics of the subject-specific state 1 and state 2 are shown in Fig. 8(B) and (C), respectively. Results illustrate that for both states, the graph metrics of SZ group displayed slightly lower values (all p-values < 0.1), compared to that of HC group. We speculate that the reduced graph metrics (the averaged node strength, clustering coefficient, global efficiency, and local efficiency) in SZ patients primarily resulted from damaged interaction between subsystems within DMN. Fig. S3 in supplementary materials shows the graph metrics result relating to the states number as 4, and the conclusion is similar.
Fig. 8.
The graph metrics of (A) dynamic DMN, (B) state 1, and (C) state 2, shown using boxplot for HC group (red) and SZ group (blue), respectively. P-value from each two-sample t-test is shown in the title of the corresponding subfigure. In (A), each sample in boxplot denotes the mean graph metric across windows of one subject. In (B), each sample in boxplot denotes the graph metric computed based on the subject-specific state 1 of one subject. In (C), each sample in boxplot denotes the graph metric computed based on the subject-specific state 2 of one subject.
4. Discussion
Dynamic functional connectivity analysis has attracted increasing attention and is showing great potential for exploring mental disorders (Calhoun et al., 2014). DMN, which plays an important role in self-generated thoughts, has been reported to be damaged in SZ patients based on static network analysis methods. Although previous studies (Damaraju et al., 2014; Rashid et al., 2014; Yu et al., 2015) have investigated SZ using dynamic analysis methods based on ICA-based whole brain parcellation, to the best of our knowledge, our study is the first work to investigate the aberrance of SZ patients from the dynamic aspects of DMN. While previous work focused on the interaction between different functional networks including DMN, our study aims to investigate the interaction among subsystems within DMN that has been found to be involved in cognitive and social processing. Using resting-state fMRI, we investigated the difference within DMN between HC and SZ patients with respect to the overall functional connectivity strengths, the functional connectivity states, and the graph metrics.
Our results reveal that, measured by the overall functional connectivity, SZ patients exhibit significantly reduced strengths compared to HC. These aberrance consist of connectivity between the two key hubs (PCC-aMPFC), connectivities between PCC and other subsystems (PCC-dMPFC, PCC-HF), as well as connectivities between aMPFC and other subsystems (aMPFC-TPJ, aMPFC-Rsp). The finding indicates that the central hubs of DMN (PCC and aMPFC) are significantly impaired in SZ patients, demonstrating less interaction with each other as well as with other subsystems. Moreover, the decreased connectivity strengths in SZ patients are also found in connections between the dMPFC subsystem and the MTL subsystem, including dMPFC-HF, TPJ-HF, TempP-Rsp, and TempP-pIPL. Besides Rsp-HF is a connectivity within the MTL subsystem, most of these altered connectivities involve different hubs or subsystems. Furthermore, our results show that inter-subsystem connectivities including PCC-aMPFC, PCC-dMPFC, aMPFC-TPJ, TPJ-HF, TempP-pIPL, and TempP-Rsp are significantly negatively correlated with PANSS negative scores in SZ group. In summary, SZ patients show a reduced central role for the two functional hubs as well as the weaker interaction between the additional two subsystems. Therefore, our study suggests that the interaction among DMN subsystems is decreased in SZ patients.
Previous studies (Andrews-Hanna et al., 2010; Leech and Sharp, 2014; Li et al., 2014) suggest that the PCC-aMPFC connection plays an important role in making self-other distinctions. Hence, our findings hint that the impairment of self-awareness in SZ patients (Ebisch and Gallese, 2015; Jardri et al., 2011) could be related to the damaged PCC-aMPFC connectivity. There also have been reports (Andrews-Hanna et al., 2014), which support that both PCC and aMPFC are strongly correlated with the other two subsystems in normal conditions and the two functional hubs may help to transfer information between the dMPFC subsystem and the MTL subsystem. Therefore, the abnormality in PCC-aMPFC as well as the connections between the two hubs and the other two subsystems in SZ patients is likely to further harm the direct information flow between the other two subsystems. It is also known that the dMPFC and MTL subsystems transfer information when healthy individuals are left alone undisturbed (Andrews-Hanna et al., 2010). Since our results show decreased interaction between the dMPFC subsystem and the MTL subsystem in SZ patients, we speculate that the ability to freely coordinate the present mental states with the episodic retrieval and making decision for future may be damaged in SZ patients. Our work consists with many previous studies which also reported harmed connectivity within DMN in SZ by using static functional connectivity analysis (Bluhm et al., 2007; Bluhm et al., 2009; Camchong et al., 2011; Jang et al., 2011) or effective connectivity approach (Bastos-Leite et al., 2015), although some work (Whitfield-Gabrieli et al., 2009; Zhou et al., 2007) found increased connectivity within DMN in SZ patients compared to HC. In summary, our finding of dysfunctional connectivity within DMN supports the widely acknowledged dysconnectivity hypothesis of SZ (Friston, 1998, 1999; Pettersson-Yeo et al., 2011; Stephan et al., 2009; Zhou et al., 2015).
According to the analysis of functional connectivity states, SZ patients spend significantly more time than HC on the state, in which DMN nodes are sparsely connected. Moreover, for all states, HC present greater connectivity strengths than SZ patients primarily in terms of inter-subsystem connectivities. This results further reveal why the overall connectivity pattern in SZ patients show weaker interaction among subsystems than HC. Regarding the graph metrics computed for time-varying connectivity patterns as well as functional connectivity states, SZ patients show lower values than HC in the averaged node strength, clustering coefficient, global efficiency, and local efficiency. We speculate that the reduced graph metrics in SZ patients are due to the damaged functional integration within DMN, especially the diminished temporal coherence among subsystems. In summary, our results suggest that the main aberrance within DMN of SZ are associated with the decreased interaction among hubs/subsystems, although some connectivity strengths within subsystems are also found to be slightly reduced. We have noted that one study (Dodell-Feder et al., 2014) performed a static network analysis of DMN to investigate the difference between HC and individuals at high-risk for SZ. Since that work (Dodell-Feder et al., 2014) only focused on the connections within subsystems of DMN, the significantly reduced connection strengths within dMPFC subsystem were observed. In their study, the connectivity of Rsp-HF also showed a slightly decreased trend in patients, which is consistent with our results.
There are several limitations that merit further investigating in future work. (1) In order to investigate the aberrance in inter-subsystem connectivity and avoid biasing the connectivity pattern toward the strong correlations between the mirrored ROIs, our analysis was performed only using left-lateralized and midline ROIs of DMN. Our study is consistent to the previous work (Andrews-Hanna et al., 2010; Dodell-Feder et al., 2014). However, considering that aberrant connectivity between brain hemispheres could contribute to psychopathological conditions, we will explore DMN using both right and left regions in future work. (2) The cluster number for estimating functional connectivity states was set to 2 and 4 for separate test. Time-varying functional connectivity of most subjects were successfully grouped and the two settings draw a similar conclusion, indicating that the selection of parameter was relatively reasonable. However, other cluster numbers also deserve investigation. (3) Consistent to previous work (Andrews-Hanna et al., 2010; Dodell-Feder et al., 2014), we applied a-priori ROIs which have been shown to belong to different subsystems to extract DMN. However, defining DMN based on data-driven approaches (e.g., ICA) is also worth studying in the future.
In summary, our results support that the within-DMN functional connectivity pattern is disrupted in SZ patients, in agreement with the dysconnectivity hypothesis. The findings suggest that SZ patients show less strongly integrated DMN, with a reduced central role for the major hubs (PCC and aMPFC) as well as the weaker interaction between the dMPFC subsystem and the MTL subsystem. We speculate that the decreased integration within DMN of SZ patients may be associated with the impaired ability of making self-other distinctions and coordinating present mental states with episodic decisions about future in SZ. Our work shows that dynamic functional network analysis may provide interesting insights for exploring mental diseases.
Supplementary Material
Acknowledgments
This work was partially supported by National Institutes of Health grants R01EB006841, National Sciences Foundation grant 1016619, and Centers of Biomedical Research Excellence (COBRE) grant 5P20RR021938/P20GM103472 (VDC).
Footnotes
Conflict of interest
All authors declare that they have no conflicts of interest.
Contributors
Yuhui Du and Vince Calhoun designed the study. Yuhui Du completed the analyses, prepared all tables and figures, and drafted the manuscript. Qingbao Yu, Hao He, and Lei Wu were involved in study implementation and data analysis. All authors contributed to and have approved the final manuscript.
Publisher's Disclaimer: This is a PDF file of an unedited manuscript that has been accepted for publication. As a service to our customers we are providing this early version of the manuscript. The manuscript will undergo copyediting, typesetting, and review of the resulting proof before it is published in its final citable form. Please note that during the production process errors may be discovered which could affect the content, and all legal disclaimers that apply to the journal pertain.
References
- Allen EA, Damaraju E, Plis SM, Erhardt EB, Eichele T, Calhoun VD. Tracking whole-brain connectivity dynamics in the resting state. Cerebral cortex. 2014;24(3):663–676. doi: 10.1093/cercor/bhs352. [DOI] [PMC free article] [PubMed] [Google Scholar]
- Andrews-Hanna JR. The brain’s default network and its adaptive role in internal mentation. The Neuroscientist: a review journal bringing neurobiology, neurology and psychiatry. 2012;18(3):251–270. doi: 10.1177/1073858411403316. [DOI] [PMC free article] [PubMed] [Google Scholar]
- Andrews-Hanna JR, Reidler JS, Sepulcre J, Poulin R, Buckner RL. Functional-anatomic fractionation of the brain’s default network. Neuron. 2010;65(4):550–562. doi: 10.1016/j.neuron.2010.02.005. [DOI] [PMC free article] [PubMed] [Google Scholar]
- Andrews-Hanna JR, Smallwood J, Spreng RN. The default network and self-generated thought: component processes, dynamic control, and clinical relevance. Annals of the New York Academy of Sciences. 2014;1316:29–52. doi: 10.1111/nyas.12360. [DOI] [PMC free article] [PubMed] [Google Scholar]
- Baker JT, Holmes AJ, Masters GA, Yeo BT, Krienen F, Buckner RL, Ongur D. Disruption of cortical association networks in schizophrenia and psychotic bipolar disorder. JAMA psychiatry. 2014;71(2):109–118. doi: 10.1001/jamapsychiatry.2013.3469. [DOI] [PMC free article] [PubMed] [Google Scholar]
- Bastos-Leite AJ, Ridgway GR, Silveira C, Norton A, Reis S, Friston KJ. Dysconnectivity within the default mode in first-episode schizophrenia: a stochastic dynamic causal modeling study with functional magnetic resonance imaging. Schizophr Bull. 2015;41(1):144–153. doi: 10.1093/schbul/sbu080. [DOI] [PMC free article] [PubMed] [Google Scholar]
- Bluhm RL, Miller J, Lanius RA, Osuch EA, Boksman K, Neufeld RW, Theberge J, Schaefer B, Williamson P. Spontaneous low-frequency fluctuations in the BOLD signal in schizophrenic patients: anomalies in the default network. Schizophr Bull. 2007;33(4):1004–1012. doi: 10.1093/schbul/sbm052. [DOI] [PMC free article] [PubMed] [Google Scholar]
- Bluhm RL, Miller J, Lanius RA, Osuch EA, Boksman K, Neufeld RW, Theberge J, Schaefer B, Williamson PC. Retrosplenial cortex connectivity in schizophrenia. Psychiatry research. 2009;174(1):17–23. doi: 10.1016/j.pscychresns.2009.03.010. [DOI] [PubMed] [Google Scholar]
- Bockholt HJ, Scully M, Courtney W, Rachakonda S, Scott A, Caprihan A, Fries J, Kalyanam R, Segall JM, de la Garza R, Lane S, Calhoun VD. Mining the mind research network: a novel framework for exploring large scale, heterogeneous translational neuroscience research data sources. Front Neuroinform. 2010;3:36. doi: 10.3389/neuro.11.036.2009. [DOI] [PMC free article] [PubMed] [Google Scholar]
- Broyd SJ, Demanuele C, Debener S, Helps SK, James CJ, Sonuga-Barke EJ. Default-mode brain dysfunction in mental disorders: a systematic review. Neuroscience and biobehavioral reviews. 2009;33(3):279–296. doi: 10.1016/j.neubiorev.2008.09.002. [DOI] [PubMed] [Google Scholar]
- Buckner RL. The brain’s default network: origins and implications for the study of psychosis. Dialogues in clinical neuroscience. 2013;15(3):351–358. doi: 10.31887/DCNS.2013.15.3/rbuckner. [DOI] [PMC free article] [PubMed] [Google Scholar]
- Buckner RL, Andrews-Hanna JR, Schacter DL. The brain’s default network: anatomy, function, and relevance to disease. Annals of the New York Academy of Sciences. 2008;1124:1–38. doi: 10.1196/annals.1440.011. [DOI] [PubMed] [Google Scholar]
- Calhoun VD, Eichele T, Pearlson G. Functional brain networks in schizophrenia: a review. Frontiers in human neuroscience. 2009;3:17. doi: 10.3389/neuro.09.017.2009. [DOI] [PMC free article] [PubMed] [Google Scholar]
- Calhoun VD, Miller R, Pearlson GD, Adali T. The Chronnectome: Time-Varying Connectivity Networks as the Next Frontier in fMRI Data Discovery. Neuro. 2014;84:262–274. doi: 10.1016/j.neuron.2014.10.015. [DOI] [PMC free article] [PubMed] [Google Scholar]
- Camchong J, MacDonald AW, 3rd, Bell C, Mueller BA, Lim KO. Altered functional and anatomical connectivity in schizophrenia. Schizophr Bull. 2011;37(3):640–650. doi: 10.1093/schbul/sbp131. [DOI] [PMC free article] [PubMed] [Google Scholar]
- Chang X, Shen H, Wang L, Liu Z, Xin W, Hu D, Miao D. Altered default mode and fronto-parietal network subsystems in patients with schizophrenia and their unaffected siblings. Brain Res. 2014;1562:87–99. doi: 10.1016/j.brainres.2014.03.024. [DOI] [PubMed] [Google Scholar]
- Damaraju E, Allen EA, Belger A, Ford JM, McEwen S, Mathalon DH, Mueller BA, Pearlson GD, Potkin SG, Preda A, Turner JA, Vaidya JG, van Erp TG, Calhoun VD. Dynamic functional connectivity analysis reveals transient states of dysconnectivity in schizophrenia. NeuroImage Clinical. 2014;5:298–308. doi: 10.1016/j.nicl.2014.07.003. [DOI] [PMC free article] [PubMed] [Google Scholar]
- Di X, Biswal BB. Dynamic brain functional connectivity modulated by resting-state networks. Brain structure & function. 2015;220(1):37–46. doi: 10.1007/s00429-013-0634-3. [DOI] [PMC free article] [PubMed] [Google Scholar]
- Dodell-Feder D, DeLisi LE, Hooker CI. The relationship between default mode network connectivity and social functioning in individuals at familial high-risk for schizophrenia. Schizophrenia research. 2014;156(1):87–95. doi: 10.1016/j.schres.2014.03.031. [DOI] [PMC free article] [PubMed] [Google Scholar]
- Ebisch SJH, Gallese V. A Neuroscientific Perspective on the Nature of Altered Self-Other Relationships in Schizophrenia. J Consciousness Stud. 2015;22(1–2):220–240. [Google Scholar]
- Fitzsimmons J, Kubicki M, Shenton ME. Review of functional and anatomical brain connectivity findings in schizophrenia. Current opinion in psychiatry. 2013;26(2):172–187. doi: 10.1097/YCO.0b013e32835d9e6a. [DOI] [PubMed] [Google Scholar]
- Freire L, Roche A, Mangin JF. What is the best similarity measure for motion correction in fMRI time series? IEEE Trans Med Imaging. 2002;21(5):470–484. doi: 10.1109/TMI.2002.1009383. [DOI] [PubMed] [Google Scholar]
- Friedman J, Hastie T, Tibshirani R. Sparse inverse covariance estimation with the graphical lasso. Biostatistics. 2008;9(3):432–441. doi: 10.1093/biostatistics/kxm045. [DOI] [PMC free article] [PubMed] [Google Scholar]
- Friston KJ. The disconnection hypothesis. Schizophrenia research. 1998;30(2):115–125. doi: 10.1016/s0920-9964(97)00140-0. [DOI] [PubMed] [Google Scholar]
- Friston KJ. Schizophrenia and the disconnection hypothesis. Acta psychiatrica Scandinavica Supplementum. 1999;395:68–79. doi: 10.1111/j.1600-0447.1999.tb05985.x. [DOI] [PubMed] [Google Scholar]
- Garrity AG, Pearlson GD, McKiernan K, Lloyd D, Kiehl KA, Calhoun VD. Aberrant “default mode” functional connectivity in schizophrenia. The American journal of psychiatry. 2007;164(3):450–457. doi: 10.1176/ajp.2007.164.3.450. [DOI] [PubMed] [Google Scholar]
- Hutchison RM, Womelsdorf T, Gati JS, Everling S, Menon RS. Resting-state networks show dynamic functional connectivity in awake humans and anesthetized macaques. Human brain mapping. 2013;34(9):2154–2177. doi: 10.1002/hbm.22058. [DOI] [PMC free article] [PubMed] [Google Scholar]
- Jang JH, Jung WH, Choi JS, Choi CH, Kang DH, Shin NY, Hong KS, Kwon JS. Reduced prefrontal functional connectivity in the default mode network is related to greater psychopathology in subjects with high genetic loading for schizophrenia. Schizophrenia research. 2011;127(1–3):58–65. doi: 10.1016/j.schres.2010.12.022. [DOI] [PubMed] [Google Scholar]
- Jardri R, Pins D, Lafargue G, Very E, Ameller A, Delmaire C, Thomas P. Increased Overlap between the Brain Areas Involved in Self-Other Distinction in Schizophrenia. PloS one. 2011;6:3. doi: 10.1371/journal.pone.0017500. [DOI] [PMC free article] [PubMed] [Google Scholar]
- Ketchen DJ, Shook CL. The application of cluster analysis in strategic management research: An analysis and critique. Strategic Manage J. 1996;17(6):441–458. [Google Scholar]
- Kucyi A, Davis KD. Dynamic functional connectivity of the default mode network tracks daydreaming. NeuroImage. 2014;100:471–480. doi: 10.1016/j.neuroimage.2014.06.044. [DOI] [PubMed] [Google Scholar]
- Leech R, Sharp DJ. The role of the posterior cingulate cortex in cognition and disease. Brain: a journal of neurology. 2014;137(Pt 1):12–32. doi: 10.1093/brain/awt162. [DOI] [PMC free article] [PubMed] [Google Scholar]
- Li W, Mai X, Liu C. The default mode network and social understanding of others: what do brain connectivity studies tell us. Frontiers in human neuroscience. 2014;8:74. doi: 10.3389/fnhum.2014.00074. [DOI] [PMC free article] [PubMed] [Google Scholar]
- Liu Y, Liang M, Zhou Y, He Y, Hao Y, Song M, Yu C, Liu H, Liu Z, Jiang T. Disrupted small-world networks in schizophrenia. Brain: a journal of neurology. 2008;131(Pt 4):945–961. doi: 10.1093/brain/awn018. [DOI] [PubMed] [Google Scholar]
- Lynall ME, Bassett DS, Kerwin R, McKenna PJ, Kitzbichler M, Muller U, Bullmore E. Functional connectivity and brain networks in schizophrenia. J Neurosci. 2010;30(28):9477–9487. doi: 10.1523/JNEUROSCI.0333-10.2010. [DOI] [PMC free article] [PubMed] [Google Scholar]
- Meda SA, Ruano G, Windemuth A, O’Neil K, Berwise C, Dunn SM, Boccaccio LE, Narayanan B, Kocherla M, Sprooten E, Keshavan MS, Tamminga CA, Sweeney JA, Clementz BA, Calhoun VD, Pearlson GD. Multivariate analysis reveals genetic associations of the resting default mode network in psychotic bipolar disorder and schizophrenia. P Natl Acad Sci USA. 2014;111(19):6864–6864. doi: 10.1073/pnas.1313093111. [DOI] [PMC free article] [PubMed] [Google Scholar]
- Pettersson-Yeo W, Allen P, Benetti S, McGuire P, Mechelli A. Dysconnectivity in schizophrenia: Where are we now? Neuroscience and biobehavioral reviews. 2011;35(5):1110–1124. doi: 10.1016/j.neubiorev.2010.11.004. [DOI] [PubMed] [Google Scholar]
- Rashid B, Damaraju E, Pearlson GD, Calhoun VD. Dynamic connectivity states estimated from resting fMRI Identify differences among Schizophrenia, bipolar disorder, and healthy control subjects. Frontiers in human neuroscience. 2014;8 doi: 10.3389/fnhum.2014.00897. [DOI] [PMC free article] [PubMed] [Google Scholar]
- Repovs G, Csernansky JG, Barch DM. Brain network connectivity in individuals with schizophrenia and their siblings. Biol Psychiatry. 2011;69(10):967–973. doi: 10.1016/j.biopsych.2010.11.009. [DOI] [PMC free article] [PubMed] [Google Scholar]
- Rotarska-Jagiela A, van de Ven V, Oertel-Knochel V, Uhlhaas PJ, Vogeley K, Linden DE. Resting-state functional network correlates of psychotic symptoms in schizophrenia. Schizophrenia research. 2010;117(1):21–30. doi: 10.1016/j.schres.2010.01.001. [DOI] [PubMed] [Google Scholar]
- Rubinov M, Sporns O. Complex network measures of brain connectivity: uses and interpretations. Neuroimage. 2010;52(3):1059–1069. doi: 10.1016/j.neuroimage.2009.10.003. [DOI] [PubMed] [Google Scholar]
- Sakoglu U, Pearlson GD, Kiehl KA, Wang YM, Michael AM, Calhoun VD. A method for evaluating dynamic functional network connectivity and task-modulation: application to schizophrenia. Magma. 2010;23(5–6):351–366. doi: 10.1007/s10334-010-0197-8. [DOI] [PMC free article] [PubMed] [Google Scholar]
- Schacter DL, Addis DR. The cognitive neuroscience of constructive memory: remembering the past and imagining the future. Philosophical transactions of the Royal Society of London Series B, Biological sciences. 2007;362(1481):773–786. doi: 10.1098/rstb.2007.2087. [DOI] [PMC free article] [PubMed] [Google Scholar]
- Skudlarski P, Jagannathan K, Anderson K, Stevens MC, Calhoun VD, Skudlarska BA, Pearlson G. Brain connectivity is not only lower but different in schizophrenia: a combined anatomical and functional approach. Biol Psychiatry. 2010;68(1):61–69. doi: 10.1016/j.biopsych.2010.03.035. [DOI] [PMC free article] [PubMed] [Google Scholar]
- Smith SM, Miller KL, Salimi-Khorshidi G, Webster M, Beckmann CF, Nichols TE, Ramsey JD, Woolrich MW. Network modelling methods for FMRI. NeuroImage. 2011;54(2):875–891. doi: 10.1016/j.neuroimage.2010.08.063. [DOI] [PubMed] [Google Scholar]
- Sporns O. Contributions and challenges for network models in cognitive neuroscience. Nature neuroscience. 2014;17(5):652–660. doi: 10.1038/nn.3690. [DOI] [PubMed] [Google Scholar]
- Stephan KE, Friston KJ, Frith CD. Dysconnection in schizophrenia: from abnormal synaptic plasticity to failures of self-monitoring. Schizophr Bull. 2009;35(3):509–527. doi: 10.1093/schbul/sbn176. [DOI] [PMC free article] [PubMed] [Google Scholar]
- Supek S, Aine CJ. Magnetoencephalography: From signals to dynamic cortical networks. Springer; 2014. [Google Scholar]
- Tang J, Liao Y, Song M, Gao JH, Zhou B, Tan C, Liu T, Tang Y, Chen J, Chen X. Aberrant default mode functional connectivity in early onset schizophrenia. PloS one. 2013;8(7):e71061. doi: 10.1371/journal.pone.0071061. [DOI] [PMC free article] [PubMed] [Google Scholar]
- Uddin LQ, Kelly AM, Biswal BB, Castellanos FX, Milham MP. Functional connectivity of default mode network components: correlation, anticorrelation, and causality. Human brain mapping. 2009;30(2):625–637. doi: 10.1002/hbm.20531. [DOI] [PMC free article] [PubMed] [Google Scholar]
- van den Heuvel MP, Mandl RC, Stam CJ, Kahn RS, Hulshoff Pol HE. Aberrant frontal and temporal complex network structure in schizophrenia: a graph theoretical analysis. J Neurosci. 2010;30(47):15915–15926. doi: 10.1523/JNEUROSCI.2874-10.2010. [DOI] [PMC free article] [PubMed] [Google Scholar]
- Whitfield-Gabrieli S, Thermenos HW, Milanovic S, Tsuang MT, Faraone SV, McCarley RW, Shenton ME, Green AI, Nieto-Castanon A, LaViolette P, Wojcik J, Gabrieli JD, Seidman LJ. Hyperactivity and hyperconnectivity of the default network in schizophrenia and in first-degree relatives of persons with schizophrenia. Proc Natl Acad Sci U S A. 2009;106(4):1279–1284. doi: 10.1073/pnas.0809141106. [DOI] [PMC free article] [PubMed] [Google Scholar]
- Xia M, Wang J, He Y. BrainNet Viewer: a network visualization tool for human brain connectomics. PloS one. 2013;8(7):e68910. doi: 10.1371/journal.pone.0068910. [DOI] [PMC free article] [PubMed] [Google Scholar]
- Yaesoubi M, Allen EA, Miller R, Calhoun VD. Dynamic coherence analysis of resting fMRI data to jointly capture state-based phase, frequency, and time-domain information. NeuroImage. 2015a doi: 10.1016/j.neuroimage.2015.07.002. In press. [DOI] [PMC free article] [PubMed] [Google Scholar]
- Yaesoubi M, Miller RL, Calhoun VD. Mutually temporally independent connectivity patterns: A new framework to study the dynamics of brain connectivity at rest with application to explain group difference based on gender. NeuroImage. 2015b;107:85–94. doi: 10.1016/j.neuroimage.2014.11.054. [DOI] [PMC free article] [PubMed] [Google Scholar]
- Yu Q, Erhardt EB, Sui J, Du Y, He H, Hjelm D, Cetin MS, Rachakonda S, Miller RL, Pearlson G, Calhoun VD. Assessing dynamic brain graphs of time-varying connectivity in fMRI data: Application to healthy controls and patients with schizophrenia. NeuroImage. 2015;107:345–355. doi: 10.1016/j.neuroimage.2014.12.020. [DOI] [PMC free article] [PubMed] [Google Scholar]
- Yu Q, Sui J, Liu J, Plis SM, Kiehl KA, Pearlson G, Calhoun VD. Disrupted correlation between low frequency power and connectivity strength of resting state brain networks in schizophrenia. Schizophrenia research. 2013;143(1):165–171. doi: 10.1016/j.schres.2012.11.001. [DOI] [PMC free article] [PubMed] [Google Scholar]
- Zalesky A, Breakspear M. Towards a statistical test for functional connectivity dynamics. NeuroImage. 2015;114:466–470. doi: 10.1016/j.neuroimage.2015.03.047. [DOI] [PubMed] [Google Scholar]
- Zalesky A, Fornito A, Cocchi L, Gollo LL, Breakspear M. Time-resolved resting-state brain networks. Proc Natl Acad Sci U S A. 2014;111(28):10341–10346. doi: 10.1073/pnas.1400181111. [DOI] [PMC free article] [PubMed] [Google Scholar]
- Zhou Y, Fan L, Qiu C, Jiang T. Prefrontal cortex and the dysconnectivity hypothesis of schizophrenia. Neuroscience bulletin. 2015;31(2):207–219. doi: 10.1007/s12264-014-1502-8. [DOI] [PMC free article] [PubMed] [Google Scholar]
- Zhou Y, Liang M, Tian L, Wang K, Hao Y, Liu H, Liu Z, Jiang T. Functional disintegration in paranoid schizophrenia using resting-state fMRI. Schizophrenia research. 2007;97(1–3):194–205. doi: 10.1016/j.schres.2007.05.029. [DOI] [PubMed] [Google Scholar]
Associated Data
This section collects any data citations, data availability statements, or supplementary materials included in this article.


