Abstract
A G-matrix Fourier transform (GFT) NMR spectroscopy-based strategy for resonance assignment of proteins is described. Each of the GFT NMR experiments presented here rapidly affords four-, five-, or six-dimensional spectral information in combination with precise measurements of chemical shifts. The resulting high information content enables one to obtain nearly complete assignments by using only four NMR experiments. For the backbone amide proton detected “out-and-back” experiments, data collection was further accelerated up to ≈2.5-fold by use of longitudinal 1H relaxation optimization. The GFT NMR experiments were acquired for three proteins with molecular masses ranging from 8.6 to 17 kDa, demonstrating that the proposed strategy is of key interest for automated resonance assignment in structural genomics.
In an era of “big science,” efforts to establish NMR-based structural genomics (1–3) paralleled with improvements in spectrometer sensitivity (e.g., ref. 4), fast collection of multidimensional spectra has emerged as a subject of broader scientific interest in structural biology and pharmacology (5–8). Recently, we introduced G-matrix Fourier transform (GFT) NMR spectroscopy to meet this demand (9, 10).
GFT NMR allows one to acquire multidimensional FT NMR spectral information rapidly, thus avoiding “sampling limitations” (3) without compromising on the precision of chemical-shift measurements. Sampling limitations arise in higher-dimensional FT NMR because measurement times increase steeply with the number of spectral dimensions: typical 2D, 3D, and 4D spectra can be acquired within minutes, hours, or days, respectively, whereas recording 5D and 6D spectra would take too long to be feasible. As a result, the signal-to-noise ratios registered in higher-dimensional FT NMR may be exceedingly large; that is, instrument time is “wasted” to sample indirect dimensions. This is aggravated further when protein structures are determined, because this requires recording of several multidimensional spectra. Moreover, high dimensionality in FT NMR is generally associated with low spectral resolution in the indirect dimensions, which severely limits the precision of the chemical shift measurements and hampers automated data analysis (11). GFT NMR affords increased precision for shift measurements, thus enabling both fast and precise acquisition of high-dimensional information. This opens opportunities to establish rapid and automated protein structure determination (11) and accurately investigate dynamic phenomena with unprecedented time resolution.
GFT NMR is based on phase-sensitive joint sampling of several indirect dimensions of a multidimensional FT NMR experiment (9). Therefore, the dimensionality of an ND experiment can be reduced to N - K by sampling of K + 1 chemical shifts in a single “GFT dimension.” The components of the resulting chemical shift multiplets (9) are separated into different spectra through G-matrix transformation, resulting in 2K+1 - 1 (N - K)D FT NMR spectra. These constitute an (N, N - K)D GFT experiment providing the same information as the ND experiment. The overdetermination associated with 2K+1 - 1 peaks encoding linear combinations of the K + 1 chemical shifts warrants the increased precision of the shift measurements (9, 10).
Nearly complete resonance assignments are generally considered a necessity for NMR-based protein structure determination (e.g., refs. 11 and 12). Here we describe a strategy for complete protein resonance assignment based on GFT NMR experiments affording accurate 4D, 5D, and 6D spectral information. Applications are presented for proteins with molecular masses ranging from 8.6 to 17 kDa.
Materials and Methods
NMR Spectrometer and Protein Samples. All measurements were performed at 25°C on Varian INOVA 600 and 750 MHz spectrometers, equipped with conventional 1H/13C/15N triple-resonance probes, by using ≈1 mM solutions in 95% H2O/5% 2H2O [20 mM 2-(N-morpholino)-ethanesulfonic acid/100 mM NaCl/10 mM DTT/5 mM CaCl2/0.02% NaN3, pH 6.5] of two protein samples of the Northeast Structural Genomics Consortium pipeline, i.e., the proteins encoded in Escherichia coli gene YgdK (17 kDa; isotropic rotational correlation time measured as described (3), τrot ≈ 8.5 ns; Northeast Structural Genomics code, “ER75”) and Pyrococcus furiosus gene PF0455 (13 kDa; τrot ≈ 8 ns; “PfR13”), as well as a 2 mM solution of ubiquitin (8.6 kDa; τrot ≈ 4.5 ns) in 95% H2O/5% 2H2O (50 mM K-PO4, pH 5.8).
GFT NMR Experiments. Three groups of GFT NMR experiments were implemented as described in the following (underlined letters indicate nuclei for which the chemical shifts are jointly sampled in the GFT dimension).
Group I. (4,3)D CαβCα(CO)NHN/HNN(CO)CαβCα, (5,3)D HαβCαβCα(CO)NHN, and (6,3)D HαβCαβCαCONHN sequentially correlate the chemical shifts of C′–CαH–CβH moieties of residue i - 1 and the NH group of residue i.
Group II. (4,3)D HNNCαβCα provides intraresidue correlations of 13Cα, 13Cβ, and 1HN shifts of residue i.
Group III. (5,3)D HCC-CH and (4,2)D HCCH correlate two proton and two carbon shifts. Combinations of experiments selected from groups I–III allow one to obtain nearly complete protein resonance assignments.
(N, N - K)D GFT experiments yield 2K “basic” spectra delineating the linear combinations of K + 1 chemical shifts (Table 1). The measurement of combinations involving only K, K - 1,..., 1 shifts has been named “central peak detection” (9, 13) and is generally required to retain the full information of the parent ND spectrum. To facilitate data analysis, experiments presented here are designed so as to provide matching peak patterns along the GFT dimension of basic and/or central peak spectra of different experiments (Table 1).
Table 1. Linear combinations of shifts and reduction of measurement time in GFT NMR experiments.
| Group* | Experiment† | Linear combinations of chemical shifts‡ | Minimal measurement time, h§ | Reduction in measurement time¶ |
|---|---|---|---|---|
| I.1∥ | (4,3)D CαβCα(CO)NHN and (4,3)D HNN(CO)CαβCα |  |
3.7 | 14 |
 |
||||
| I.2∥ | L-(4,3)D HNN(CO)CαβCα | as in I.1 | 1.5 | 14 |
| I.3** | (5,3)D HαβCαβCα (CO)NHN |  |
12.7 | 75 |
 |
||||
| I.4†† | (6,3)D HαβCαβCαCONHN |  |
29.0 | 600 |
 |
||||
| II.1∥‡‡ | (4,3)D HNNCαβCα |  |
3.7 | 14 |
 |
||||
| II.2∥‡‡ | L-(4,3)D HNNCαβCα | as in II.1 | 1.5 | 14 |
| III.1§§ | (5,3)D HCC-CH | Ω0(13C(2)) ± Ω1(13C(2)) ± Ω2(1H(2)) “diagonal peak” | 24.0 | 423 |
| Ω0(13C(2)) ± Ω1(13C(1)) ± Ω2(1H(1)) “cross peak” | ||||
| III.2¶¶ | (4,2)D HCCH | as in III.1 | 0.3 | 30 |
The roman number indicates the group of the experiment (see text)
Nuclei for which (i) shifts are sampled in a single GFT dimension are underlined, (ii) shifts are measured in a separate indirect dimension are italicized, and (iii) shifts are not measured are given in parentheses. The nucleus for which the shift is detected in quadrature in the GFT dimension is shown in bold type. Longitudinal 1H relaxation optimization is indicated as “l-”
Linear combinations are measured in the GFT dimension of the respective basic spectra, with Ω0 being the chemical shift detected in quadrature. The lines of the chemical shift multiplets are centered about this shift, and subscript i — 1 and i indicate two neighboring amino acid residues. Linear combinations measured in first-order central peaks are obtained by omitting the right-most shift of a given linear combination, e.g. Ω2(1H) for (5,3)D HαβCαβCα(CO)NHN. Accordingly, linear combinations measured in higher-order central peak spectra are obtained by successive omission of shifts (9)
Minimal measurement times are calculated for the radio-frequency pulse schemes shown in Figs. 7—11, assuming that the experiments are recorded at 600-MHz 1H resonance frequency with the following acquisition parameters: 0.7-s relaxation delay between scans, one scan per free induction decay with 0.05-s acquisition time each, and t1max(GFT) = 6.5 ms or 4.2 ms for aromatic (4,2) HCCH (III.2). Spectral widths and maximal evolution times of other indirect dimensions are provided in the footnotes of the individual experiments
The reduction in minimal measurement time is given relative to the parent ND experiment. The value given for each experiment corresponds to the ε value defined in ref. 9 and represents the ratio of the number of free induction decays of the parent experiment divided by the number of free induction decays of the GFT experiment
No first-order central peak detection is required (see text). SW(GFT) = 12,000 Hz; t2max(15N) = 12 ms, SW(15N) = 2,000 Hz
SW(GFT) = 15,000 Hz; t2max(15N) = 12 ms, SW(15N) = 2,000 Hz
SW(GFT) = 16,500 Hz; t2max(15N) = 12 ms, SW(15N) = 2,000 Hz
First-order central peak detection is not required (see text). Only correlations arising from one-bond scalar couplings are considered; smaller two-bond 2JNCα scalar couplings (14) give rise to additional sequential signals as detected in I.1
The chemical shifts of H(1)C(1)—C(2)H(2) moieties are correlated. The carbons indicated in bold and italic type represent the same nucleus (see text). Therefore, second-order central peak detection is not required. SW(GFT) = 25,000 Hz; t2max(13C) = 4.5 ms, SW(13C) = 9,000 Hz
The chemical shifts of H(1)C(1)—C(2)H(2) moieties are correlated. SW(GFT) = 11,000 Hz
Radio-Frequency Pulse Sequence Design. The radio-frequency pulse schemes for the GFT NMR experiments are shown in Figs. 7–11, which are published as supporting information on the PNAS web site. Except for Cαβ shift evolution in HNN(CO)CαβCα/HNNCαβCα, indirect chemical shift evolution periods are incorporated in a (semi)constant-time manner (14). Thus, line widths registered in the GFT dimension become independent of K and do not increase with additional shifts being sampled. This is pivotal for obtaining increased precision for the shift measurements (9). Moreover, constant time-frequency labeling avoids additional sensitivity losses caused by transverse relaxation with increasing K.
Group I. (4,3)D CαβCα(CO)NHN (K = 1), (5,3)D HαβCαβCα(CO)NHN (K = 2), and (6,3)D HαβCαβCαCONHN (K = 3) are derived from Cαβ(CO)NHN (15) by successively introducing 13Cα, 1Hαβ, and 13C′ chemical shift evolution periods (Fig. 7). The magnetization transfer and frequency labeling is summarized as:
 |
[1] |
A salient feature is a “double-frequency labeling” of the transfer amplitude with Ω(13Cα), first simultaneously with Ω(13Cβ) and then a second time only with Ω(13Cα). Inspection of linear combinations of shifts in (4,3)D CαβCα(CO)NHN (Table 1) reveals that a direct correlation is introduced between the 13Cα and 13Cβ shifts, rendering spin-system identification unambiguous in cases of Ω(15Ni)/Ω(1HNi) degeneracy. Moreover, central peak information (9, 13) is obtained from Ω0(13Cα) + Ω1(13Cα) [= 2·Ω(13Cα)] so that recording of 3D HNN(CO)Cα is not necessary. For the (5,3)D and (6,3)D experiments, 13Cα steady-state magnetization is preferably used to detect central peaks if the basic spectra are acquired with at least two scans per increment (9). Otherwise, central peaks can be acquired by omitting the 1Hαβ shift evolution. Notably, (6,3)D HαβCαβCαCONHN constitutes a paradigm of a GFT NMR experiment wherein all delays required for magnetization transfer are likewise used for frequency labeling; that is, the number of shift correlations obtained from such an experiment reaches its theoretical maximum.
(4,3)D HNN(CO)CαβCα (K = 1) is derived from out-and-back HNN(CO)Cαβ (16) and provides the same shift information as (4,3)D CαβCα(CO)NHN:
 |
[2] |
 |
Importantly, the exclusive use of amide proton polarization allows one to implement a longitudinal 1H-relaxation-optimized version (17) referred to as L-(4,3)D HNN(CO)CαβCα (Fig. 8).
Group II. (4,3)D HNNCαβCα (K = 1) is derived from out-and-back HNNCαβ (18) by introducing double-frequency labeling of 13Cα:
 |
[3] |
The advantages of such frequency labeling are as discussed above for (4,3)D CαβCα(CO)NHN, and L-(4,3)D HNNCαβCα was implemented (Fig. 9).
Group III. (5,3)D HCC–CH (K = 2) and (4,2)D HCCH (K = 2) are derived from HCCH (14) and correlate the shifts of H(1)C(1)–C(2)H(2) moieties. In both experiments, magnetization is transferred first from 1H(1) to 13C(1) and then to 13C(2) (Figs. 10 and 11), and 1H(1), 13C(1), and 13C(2) shifts are sampled jointly. In (4,2)D HCCH, the magnetization is subsequently transferred to 1H(2) and detected, whereas in (5,3)D HCC–CH, a second frequency labeling with Ω[13C(2)] is introduced before signal detection on 1H(2):
 |
[4] |
The HCC module provides linear combinations of three chemical shifts (Table 1), and 13C(1) steady-state magnetization can be used to detect first-order central peaks (9, 13). In (5,3)D HCC–CH, the second frequency labeling with Ω2[13C(2)] enhances spectral resolution and simultaneously provides second-order central peak information [i.e., 2D (13C,1H) correlations].
Assignment Strategy. The assignment of polypeptide backbone and β–CH moieties is obtained by combining one of the experiments of group I with (4,3)D HNNCαβCα (group II). Three linear combinations of shifts [Table 1; Ω(13Cα) ± Ω(13Cβ) and Ω(13Cα) + Ω(13Cα)] yield sequential connectivities. Because directly correlated 13Cα and 13Cβ chemical shifts are used, this strategy represents an extension of the widely used protocol based on Cαβ(CO)NH/HNNCαβ (14, 15, 18).
A group I experiment is used in conjunction with (5,3)D HCC–CH for sequence-specific assignment of aliphatic side chains. (5,3)D HCC–CH comprises the same peak pattern along the GFT dimension as (5,3)D HαβCαβCα(CO)NHN, whereas those observed in the first-order central peak spectra of (5,3)D HCC–CH match the pattern of (4,3)D CαβCα(CO)NHN. Because aromatic protons quite generally exhibit good chemical-shift dispersion and relatively fewer aromatic spins are present, (4,2)D HCCH is the first choice for identification of aromatic spin systems. Aliphatic and aromatic HCC experiments can be recorded so that the aromatic 13Cγ chemical shifts, being derived from 13C steady-state magnetization, are measured in first-order central peak spectra. These shifts can be used to (i) link aromatic and aliphatic spin systems and (ii) identify the type of the aromatic residue (19). Moreover, NOESY is used whenever aromatic rings need to be assigned for structure determination and is an effective way to obtain through-space connectivities for their sequence-specific assignment (12, 14).
Results and Discussion
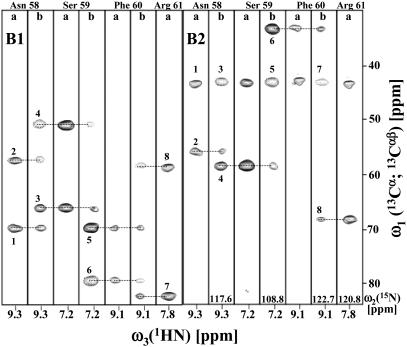
Sequential Polypeptide Backbone and β-CH Assignment. (4,3)D HNNCαβCα and (4,3)D CαβCα(CO)NHN were acquired for 13 kDa PfR13, enabling complete assignment of 1HN, 15N, and Cαβ shifts by matching three intraresidue and sequential peak positions (Fig. 1; measurement time, 16 h each; peak detection yield, 99%; completeness of Cαβ assignment, 100%; for spectral parameters see Table 2, which is published as supporting information on the PNAS web site). For ER75, (4,3)D HNNCαβCα/ HNN(CO)CαβCα data acquisition was longer (measurement time, 58 h each; peak detection yield, 93%; completeness of Cαβ assignment, 99%), whereas the minimal measurement time (Table 1) was achieved for ubiquitin (measurement time, 3.7 h each; peak detection yield, 100%; completeness of Cαβ assignment, 100%). A comparison with 3D HNNCαβ/Cαβ(CO)NHN illustrates how 13Cα or 13Cβ shift degeneracies can be resolved by using (4,3)D HNNCαβCα/CαβCα(CO)NHN (Fig. 12, which is published as supporting information on the PNAS web site). Three equations (Table 1) can be used to calculate the 13Cα and 13Cβ shifts with approximately √3 increased precision (9, 10).
Fig. 1.
[ω1(13Cα; 13Cαβ), ω3(1HN)] strips taken from (4,3)D CαβCα(CO)NHN (labeled “a”) and (4,3)D HNNCαβCα (labeled “b”) recorded for PfR13. The strips were taken at ω2(15N) (indicated at the bottom) of residues 58–61 and are centered about their backbone 1HN chemical shifts. Positive and negative peaks are shown with solid and dotted contour lines, respectively. The strips on the left are taken from spectrum B1, comprising peaks at Ω0(13Cα) + Ω1(13Cα) (labeled 1, 3, 5, and 7) and Ω0(13Cα) + Ω1(13Cβ) (labeled 2, 4, 6, and 8), and those on the right are taken from spectrum B2, comprising peaks at Ω0(13Cα) - Ω1(13Cα) (labeled 1, 3, 5, and 7) and Ω0(13Cα) - Ω1(13Cβ) (labeled 2, 4, 6, and 8). These peaks have been assigned to the 13Cαβ shifts of Tyr-57 (1 and 2), Asn-58 (3 and 4), Ser-59 (5 and 6), and Phe-60 (7 and 8). Sequential connectivities are indicated by dashed lines [peaks at Ω0(13Cα) - Ω1(13Cα) in B2 are at the carrier position and do not provide connectivities].
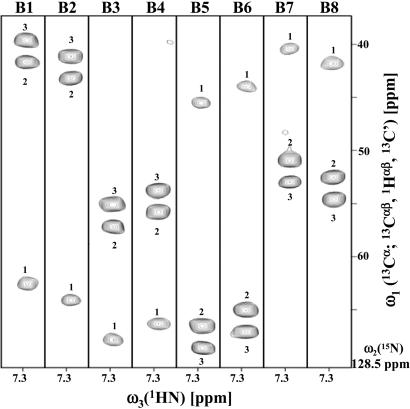
For ubiquitin, (5,3)D HαβCαβCα(CO)NHN (measurement time, 22 h each; peak detection yield, 98%; completeness of Cαβ assignment, 100%) and (6,3)D HαβCαβCαCONHN (Fig. 2; 14.2 h for basic spectra; peak detection yield, 98%; completeness of Cαβ assignment, 100%) were acquired. When used together with (4,3)D HNNCαβCα, the (6,3)D experiment can provide complete assignment of backbone and β–CH moieties (representing, respectively, 68%, 79%, and 70% of all 1H, 15N, and 13C spins in a protein with average amino acid composition) based on 6D spectral information (Fig. 2).
Fig. 2.
[ω1(13Cα; 13Cαβ, 1Hαβ, 13C′), ω3(1HN)] strips taken from the eight basic spectra (labeled B1–B8) of (6,3)D HαβCαβCαCONHN recorded for ubiquitin. The strips were taken at ω2(15N) of Ile-6 (indicated at the bottom on the right) and comprise peaks (Table 1) at: B1, Ω0(13Cα) + Ω1(X) + Ω2(Y) + Ω3(Z); B2, Ω0(13Cα) + Ω1(X) + Ω2(Y) - Ω3(Z); B3, Ω0(13Cα) + Ω1(X) - Ω2(Y) + Ω3(Z); B4, Ω0(13Cα) + Ω1(X) - Ω2(Y) - Ω3(Z); B5, Ω0(13Cα) - Ω1(X) + Ω2(Y) + Ω3(Z); B6, Ω0(13Cα) - Ω1(X) + Ω2(Y) - Ω3(Z); B7, Ω0(13Cα) - Ω1(X) - Ω2(Y) + Ω3(Z); and B8, Ω0(13Cα) - Ω1(X) - Ω2(Y) - Ω3(Z), with (X, Y, Z) = (13Cα, 1Hα, 13C′) (for peaks labeled “1”), (X, Y, Z) = (13Cβ, 1Hβ2, 13C′) (for peaks labeled “2”), or (X, Y, Z) = (13Cβ, 1Hβ3, 13C′) (for peaks labeled “3”).
Longitudinal 1H-Relaxation-Optimized “L-GFT” NMR. L-optimization (17) is based on “flip-back” of aliphatic proton magnetization along the z axis and enhances longitudinal relaxation of 1HN. Fig. 13, which is published as supporting information on the PNAS web site, shows the signal-to-noise ratio divided by the square root of the measurement time as registered in first [ω1(15N), ω2(1HN)] planes of (4,3)D HNNCαβCα as a function of the relaxation delay between scans. The data show that the relaxation enhancement allows one to use relaxation delays around 0.35 s without loss (or in favorable cases even some gain) of intrinsic sensitivity. Hence, L-optimization can be used to increase the sampling speed of out-and-back (14) GFT NMR experiments by a factor of ≈2.5; L-(4,3)D HNN(CO)CαβCα/ HNNCαβCα were recorded for ubiquitin in 1.5 h each (Fig. 14, which is published as supporting information on the PNAS web site, and Table 2).
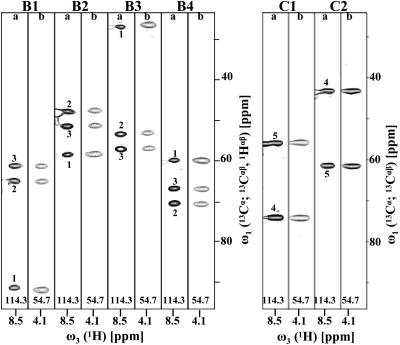
Assignment of Peripheral Aliphatic Spins from CHα-CHβ Shifts. (5,3)D HCC–CH was acquired for ubiquitin (24 h; yield of peak detection, 99%; yield of shifts assigned, 100%) and exhibits the peak pattern of (5,3)D HαβCαβCα(CO)NHN along the GFT dimension (Fig. 3), which facilities interactive analysis. For automated assignment based on matching of shifts, it is of key importance that up to four (Hαβ and Cαβ) or five (if two nondegenerate β-protons are present) mutually correlated shifts serve as a starting point to assign the long aliphatic side chains. For ER75, first-order central peak spectra of (5,3)D HCC–CH (see below) were used in conjunction with (4,3)D CαβCα(CO)NHN.
Fig. 3.
[ω1(13Cα; 13Cαβ,1Hαβ), ω3(1HN)] and [ω1(13Cα; 13Cαβ,1Hαβ), ω3(1Hα)] strips taken from the basic spectra (pairs of strips labeled B1–B4) of (5,3)D HαβCαβCα(CO)NHN (strips labeled “a”) and (5,3)D HCC–CH (labeled “b”), respectively, recorded for ubiquitin. [ω1(13Cα; 13Cαβ), ω3(1HN)] and [ω1(13Cα; 13Cαβ), ω3(1Hα)] strips taken from the first-order central peak spectra (pairs of strips labeled C1 and C2) are shown on the right. The strips were taken along ω2 at the 15N shift of Ser-57 and the 13Cα shift of Leu-56, respectively (indicated at the bottom of the strips). Basic spectra comprise peaks (Table 1) at: B1, Ω0(13Cα) + Ω1(X) + Ω2(Y); B2, Ω0(13Cα) + Ω1(X) - Ω2(Y); B3, Ω0(13Cα) - Ω1(X) + Ω2(Y); and B4, Ω0(13Cα) - Ω1(X) - Ω2(Y), with (X, Y) = (13Cα,1Hα) (peaks labeled “1”), (X, Y) = (13Cβ, 1Hβ2) (peaks labeled “2”), or (X, Y) = (13Cβ, 1Hβ3) (peaks labeled “3”). The first-order central peak spectra comprise peaks at: C1: Ω0(13Cα) + Ω1(X); and C2: Ω0(13Cα) - Ω1(X), with (X) = (13Cα) (peaks labeled “4”) or (X) = (13Cβ) (peaks labeled “5”).
Precision of Shift Measurements in HCC Experiments. In HCCH, the chemical shifts of H(1)C(1)–C(2)H(2) moieties are linked by matching Ω[13C(1)]/Ω[1H(1)] with Ω[13C(2)]/Ω[1H(2)]. Both pairs of shifts are “detected” on 1H(1) and 1H(2), giving rise to cross and diagonal peaks (14). The efficiency of this procedure depends on the precision of shifts, which defines the “matching tolerance” (11). GFT NMR warrants increased precision, because shifts are obtained from an overdetermined system of equations (9). In HCC experiments, overdetermination is increased further compared with triple-resonance experiments: both “cross” and “diagonal” peaks are observed, and the polarization transfer is bidirectional. The additional peaks yield additional equations to calculate the shifts.
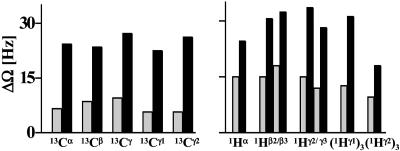
The mean absolute differences, ΔΩ(1H) = |Ωcross(1Hκ) - Ωdia(1Hκ)| and ΔΩ(13C) = |Ωcross(13Cκ) - Ωdia(13Cκ)|, were measured at ω1(Hκ) and ω1(13Cκ) of cross and diagonal peaks for various atom types (κ = α, β, γ, γ1, γ2) in conventional 3D H(C)CH/(H)CCH (14). The same differences then were calculated for (5,3)D HCC–CH, with the shifts being obtained from a least-squares fit to the system of equations representing the shift linear combinations (Table 1 and Fig. 4). The expected increase in precision (9, 10) was registered; use of (5,3)D HCC–CH leads to a reduction of ΔΩ(1H) and ΔΩ(13C) by factors of 2.1 ± 0.3 and 3.6 ± 0.7, respectively. These numbers are in agreement with previous statistical considerations (9) and imply that automated assignment protocols (11, 20) can be used, respectively, with ≈2- to 4-fold reduced matching tolerances. Clearly, this holds also for (4,2)D HCCH, in which the same peak pattern are detected in the GFT dimension. Considering that 4D HCCH information suffices to identify spin systems of medium-sized proteins (21), the large reduction of matching tolerances suggests that this also can be achieved for proteins up to ≈20 kDa using (5,3)D HCC–CH.
Fig. 4.
Mean values of ΔΩ(1H) = |Ωcross(1Hκ) - Ωdia(1Hκ)| and ΔΩ(13C) = |Ωcross(13Cκ) - Ωdia(13Cκ)| (κ = α, β, γ, γ1, γ2) obtained from conventional 3D HCCH (black bars) and (5,3)D HCC–CH (gray bars) recorded for ubiquitin (see text; see also Fig. 5).
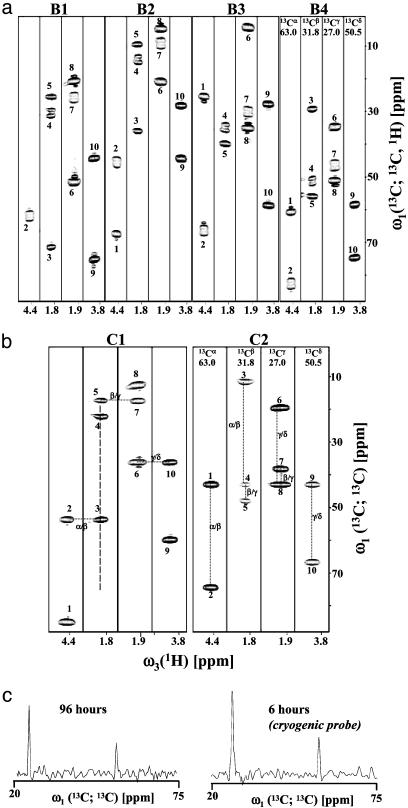
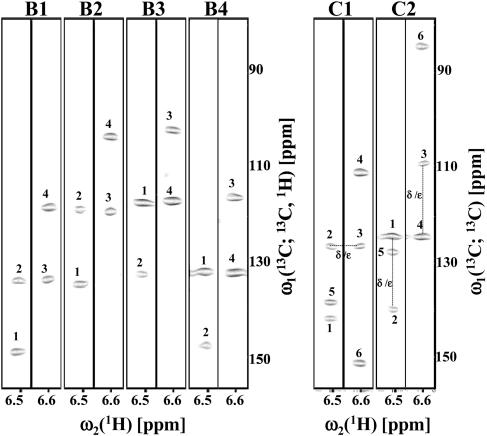
HCC GFT NMR-Based Spin-System Identification. For ER75, we acquired aliphatic (5,3)D HCC–CH (Fig. 5; measurement time, 96 h; peak detection yield, 93%; completeness of resonance assignment, 95%; Table 2) and aromatic (4,2)D HCCH (Fig. 6; measurement time, 12 h; peak detection yield, 90%; completeness of resonance assignment, 90%). The spectral width of GFT dimensions increases when additional chemical shift evolution periods are introduced, whereas the number of peaks per spectrum after G-matrix transformation remains invariant (9). Consequently, spectral resolution in (5,3)D HCC–CH is significantly better than in 3D (H)CCH/H(C)CH (Fig. 15, which is published as supporting information on the PNAS web site), which is routinely used for large systems (e.g., ref. 22). Hence, primarily sensitivity considerations remain to judge on feasibility (see below). Spin-system identification in the first-order central peak spectra can be pursued by matching peak positions and separation of peaks (Figs. 5 and 6), whereas the use of basic spectra requires that shifts are first calculated from the respective systems of equations (Table 1). Sampling of (5,3)D HCC–CH can be accelerated by 25% when central peaks in HC-type experiments are derived from 1H magnetization (10). When using cryogenic probes, this may become a viable option even for larger systems: central peaks detected in 96 h from steady-state magnetization at 750 MHz and in 6 h from 1H magnetization at 600 MHz by using a cryogenic probe exhibit quite comparable signal-to-noise ratios (Fig. 5c).
Fig. 5.
Aliphatic (5,3)D HCC-CH recorded for ER75. (a) [ω1(13C; 13C, 1H), ω3(1H)] strips taken from the basic spectra (labeled B1–B4; each spectrum is represented by a set of four strips). (b) [ω1(13C; 13C), ω3(1H)] strips taken from the corresponding first-order central peak spectra (labeled C1 and C2; each comprising a set of two strips) are shown below. The four strips of a given spectrum were taken along ω2 at the shifts of 13Cα, 13Cβ, 13Cγ, and 13Cδ (indicated on top of the strips of B4 and C2) of Pro-4. For simplicity, only one strip (corresponding to 1Hβ2, 1Hγ2, and 1Hδ2) is shown for each of the methylene protons with nondegenerate shifts. Peaks (Table 1) are at: B1, Ω0[13C(2)] + Ω1[13C(2)] + Ω2[1H(2)] (diagonal peak) and Ω0[13C(2)] + Ω1[13C(1)] + Ω2[1H(1)] (cross peak); B2, Ω0[13C(2)] + Ω1[13C(2)] - Ω2[1H(2)] and Ω0[13C(2)] + Ω1[13C(1)] - Ω2[1H(1)]; B3, Ω0[13C(2)] - Ω1[13C(2)] + Ω2[1H(2)] and Ω0[13C(2)] - Ω1[13C(1)] + Ω2[1H(1)]; B4, Ω0[13C(2)] - Ω1[13C(2)] - Ω2[1H(2)] and Ω0[13C(2)] + Ω1[13C(1)] - Ω2[1H(1)]; C1, Ω0[13C(2)] + Ω1[13C(2)] and Ω0[13C(2)] + Ω1[13C(1)]; and C2, Ω0[13C(2)] - Ω1[13C(2)] and Ω0[13C(2)] - Ω1[13C(1)]. Specifically, the peaks labeled 1–10 in basic and central peak spectra are assigned to the following linear combinations of shifts: 1, Ω0(13Cα) ± Ω1(13Cα) ± Ω2(1Hα) (B1–B4) and Ω0(13Cα) ± Ω1(13Cα) (C1–C2) (in B1, the peak has a chemical shift of 102.3 ppm and is not shown); 2, Ω0(13Cα) ± Ω1(13Cβ) ± Ω2(1Hβ2/β3) (B1–B4) and Ω0(13Cα) ± Ω1(13Cβ) (C1–C2); 3, Ω0(13Cβ) ± Ω1(13Cα) ± Ω2(1Hα) (B1–B4) and Ω0(13Cβ) ± Ω1(13Cα) (C1–C2); 4, Ω0(13Cβ) ± Ω1(13Cβ) ± Ω2(1Hβ2/β3) (B1–B4) and Ω0(13Cβ) ± Ω1(13Cβ) (C1–C2); 5, Ω0(13Cβ) ± Ω1(13Cγ) ± Ω2(1Hγ2/γ3) (B1–B4) and Ω0(13Cβ) ± Ω1(13Cγ) (C1–C2) (in B1, the peak has a chemical shift of –5.8 ppm and is not shown); 6, Ω0(13Cγ) ± Ω1(13Cδ) ± Ω2(1Hδ2/δ3) (B1–B4) and Ω0(13Cγ) ± Ω1(13Cδ) (C1–C2); 7, Ω0(13Cγ) ± Ω1(13Cβ) ± Ω2(1Hβ2/β3) (B1–B4) and Ω0(13Cγ) ± Ω1(13Cβ) (C1–C2); 8, Ω0(13Cγ) ± Ω1(13Cγ) ± Ω2(1Hγ2/γ3) (B1–B4) and Ω0(13Cγ) ± Ω1(13Cγ) (C1–C2); 9, Ω0(13Cδ) ± Ω1(13Cδ) ± Ω2(1Hδ2/δ3) (B1–B4) and Ω0(13Cδ) ± Ω1(13Cδ) (C1–C2); and 10, Ω0(13Cδ) ± Ω1(13Cγ) ± Ω2(1Hγ2/γ3) (B1–B4) and Ω0(13Cδ) ± Ω1(13Cγ) (C1–C2). In the first-order central peak spectra, dashed lines indicate connectivities that can be readily established. In C1, diagonal and cross peaks encode the sum of the shifts of two coupled 13C spins. This allows one to “walk” as in conventional HCCH. In C2, differences of shifts are encoded, and differences between peak positions need to be matched. The peaks in C1 and C2 allow unambiguous grouping of shift multiplets in the basic spectra B1–B4. The dashed line in C1 indicates the spectral range of the cross section shown in c. (c) Cross sections taken along ω1(13C; 13C) from the central peak spectrum shown (Left) and the central peak spectrum recorded by using a cryogenic probe (Right), demonstrating that comparable sensitivity is achieved in 96 and 6 h, respectively, of measurement time (Table 1; see text).
Fig. 6.
[ω1(13C; 13C, 1H), ω2(1H)] strips taken from the basic spectra (labeled B1–B4; each spectrum is represented by two strips) and first-order central peak spectra (labeled C1 and C2) of aromatic (4,2)D HCCH recorded for ER75. The strips are centered about the 1Hδ and 1Hε chemical shifts of Tyr-59. The spectra comprise peaks along ω1 at positions as listed for (5,3)D HCC–CH in the Fig. 5 legend. Specifically, the peaks labeled 1–8 correspond to: 1, Ω0(13Cδ) ± Ω1(13Cδ) ± Ω2(1Hδ) (B1–B4) and Ω0(13Cδ) ± Ω1(13Cδ) (C1–C2); 2, Ω0(13Cδ) ± Ω1(13Cε) ± Ω2(1Hε) (B1–B4) and Ω0(13Cδ) ± Ω1(13Cε) (C1–C2); 3, Ω0(13Cε) ± Ω1(13Cδ) ± Ω2(1Hδ) (B1–B4) and Ω0(13Cε) ± Ω1(13Cδ)(C1–C2); and 4, Ω0(13Cε) ± Ω1(13Cε) ± Ω2(1Hε) (B1–B4) and Ω0(13Cε) ± Ω1(13Cε) (C1–C2). In first-order central peak spectra, dashed lines sketch how connectivities between attached CH moieties can be established (see the Fig. 5 legend). The first-order central peak spectra were derived from 13C steady-state magnetization and thus contain: 5, Ω0(13Cδ) ± Ω1(13Cγ); and 6, Ω0(13Cε) ± Ω1(13Cη) (that is, peaks that are derived from 13Cγ and 13Cη magnetization encoding the shifts of the quaternary carbons).
Sensitivity Considerations. Because the additional Ω(13Cα) frequency labeling in CαβCα experiments is achieved during delays required for polarization transfer (Figs. 7–9), signal attenuation caused by transverse relaxation remains the same as in the conventional schemes (15, 16, 18). Because of signal splitting arising from the additional frequency labeling, sensitivity, however, is a priori reduced 2-fold in the GFT implementations. Similarly, 4D HCCH is 2 and 2·√2 times, respectively, more sensitive than (4,2)D HCCH and (5,3)D HCC–CH (see ref. 9). However, the symmetry of peak pattern in GFT NMR allows one to identify signals closer to the noise level (9), which compensates partly for the loss in sensitivity. Moreover, cryogenic probes exhibit 3-fold increased sensitivity (Fig. 5c) in routine biological NMR applications (4). Taken together, we have demonstrated feasibility of GFT NMR-based resonance assignment for proteins in the range from 8.6 to 17 kDa when using conventional probes, and the data acquired for 17-kDa ER75 by using a cryogenic probe (Fig. 5c) indicate feasibility for systems of at least 20 kDa.
Conclusions
GFT NMR is a powerful technique for protein resonance assignment. Four experiments forming a “core” set [e.g., L-(4,3)D HNNCαβCα/HNN(CO)CαβCα, aromatic (4,2)D HCCH or (4,3)D HCCH (3), and aliphatic (5,3)D HCC–CH or (4,3)D HCCH (3)] can be recorded within ≈1 day. The associated precise shift measurements are of particular value for automated (side-chain) assignment. For smaller systems, [L-](4,2)D HNNCαβCα/HNN(CO)CαβCα and (4,2)D HCCH for both aliphatic and aromatic spin systems can be recorded in 40 min, and sensitive L-(4,2)D HNN(CO)CαβCα (minimal measurement time, 3.5 min) might be considered for 4D-type chemical shift perturbation screening. If high-shift degeneracy is encountered, the core set can be complemented by GFT NMR experiments delineating 1Hα and/or 13C′ chemical shifts (10, 23). Moreover, heteronuclear-resolved [1H,1H]-nuclear Overhauser effect GFT NMR spectroscopy will allow one to also accelerate the collection of through-space nuclear Overhauser effect connectivities required for determination of 3D structures.
Supplementary Material
Acknowledgments
We thank Dr. G. Liu for assigning the spectra acquired for PfR13; Mr. E. Chirivino for help in analyzing the precision of HCC experiments and preparing some of the figures; Drs. T. Acton and G. Montelione (Rutgers, The State University of New Jersey, Piscataway) for providing the ER75 and PfR13 samples; and Drs. J. Cort and M. Kennedy (Pacific Northwest National Laboratory, Richland, WA) for providing the ubiquitin sample. This work was supported by National Science Foundation Grant MCB 0075773 and National Institutes of Health Grant P50 GM62413.
Abbreviations: FT, Fourier transform; GFT, G-matrix FT.
References
- 1.Montelione, G. T., Zheng, D., Huang, Y., Gunsalus, K. C. & Szyperski, T. (2000) Nat. Struct. Biol. 7, 982-984. [DOI] [PubMed] [Google Scholar]
- 2.Kennedy, M. A., Montelione, G. T., Arrowsmith, C. H. & Markley, J. L. (2002) J. Struct. Funct. Genomics 2, 155-169. [DOI] [PubMed] [Google Scholar]
- 3.Szyperski, T., Yeh, D. C., Sukumaran, D. K., Moseley, H. N. B. & Montelione, G. T. (2002) Proc. Natl. Acad. Sci. USA 99, 8009-8014. [DOI] [PMC free article] [PubMed] [Google Scholar]
- 4.Monleon, D., Colson, K., Moseley, H. N. B., Anklin, C., Oswald, R., Szyperski, T. & Montelione, G. T. (2002) J. Struct. Funct. Genomics 2, 93-101. [DOI] [PubMed] [Google Scholar]
- 5.Service, R. F. (2003) Science 299, 503. [DOI] [PubMed] [Google Scholar]
- 6.Freeman, R. & Kupce, E. (2003) J. Biomol. NMR 27, 101-113. [DOI] [PubMed] [Google Scholar]
- 7.Constants, A. (2003) Scientist 17, 45-48. [Google Scholar]
- 8.Meoli, D. (2003) Pharmacogenomics 3, 10-11. [Google Scholar]
- 9.Kim, S. & Szyperski, T. (2003) J. Am. Chem. Soc. 125, 1385-1393. [DOI] [PubMed] [Google Scholar]
- 10.Kim, S. & Szyperski, T. (2004) J. Biomol. NMR 28, 117-130. [DOI] [PubMed] [Google Scholar]
- 11.Güntert, P. (2003) Prog. NMR Spectrosc. 43, 105-125. [Google Scholar]
- 12.Wüthrich, K. (1986) NMR of Proteins and Nucleic Acids (Wiley, New York).
- 13.Szyperski, T., Braun, D., Fernandez, C. & Wüthrich, K. (1996) J. Am. Chem. Soc. 118, 8146-8147. [Google Scholar]
- 14.Cavanagh, J., Fairbrother, W. J., Palmer, A. G. & Skelton, N. J. (1996) Protein NMR Spectroscopy (Academic, San Diego).
- 15.Grzesiek, S. & Bax, A. (1992) J. Am. Chem. Soc. 114, 6291-6293. [Google Scholar]
- 16.Yamazaki, T., Lee, W., Arrowsmith, C. H., Muhandiram, D. R. & Kay, L. E. (1994) J. Am. Chem. Soc. 116, 11655-11666. [Google Scholar]
- 17.Pervushin, K., Vogeli, B. & Eletsky, A. (2002) J. Am. Chem. Soc. 124, 12898-12902. [DOI] [PubMed] [Google Scholar]
- 18.Wittekind, M. & Müller, L. (1992) J. Magn. Reson. B 101, 201-205. [Google Scholar]
- 19.Schubert, M., Oschkinat, H. & Schmieder, P. (2001) J. Magn. Reson. 153, 186-192. [DOI] [PubMed] [Google Scholar]
- 20.Moseley, H. N. B., Monleon, D. & Montelione, G. T. (2001) Methods Enzymol. 338, 91-108. [DOI] [PubMed] [Google Scholar]
- 21.Szymczyna, B. R., Pineda-Lucena, A., Mills, J. L., Szyperski, T. & Arrowsmith, C. H. (2002) J. Biomol. NMR 22, 299-300. [DOI] [PubMed] [Google Scholar]
- 22.Garrett, D. S., Seok, Y.-J., Liao, D.-I., Peterkofsky, A., Gronenborn, A. M. & Clore, G. M. (1997) Biochemistry 36, 2517-2530. [DOI] [PubMed] [Google Scholar]
- 23.Xia, Y., Arrowsmith, C. H. & Szyperski, T. (2002) J. Biomol. NMR 24, 41-50. [DOI] [PubMed] [Google Scholar]
Associated Data
This section collects any data citations, data availability statements, or supplementary materials included in this article.


