

Abstract
Motor learning can be defined as changing performance so as to optimize some function of the task, such as accuracy. The measure of accuracy that is optimized is called a loss function and specifies how the CNS rates the relative success or cost of a particular movement outcome. Models of pointing in sensorimotor control and learning usually assume a quadratic loss function in which the mean squared error is minimized. Here we develop a technique for measuring the loss associated with errors. Subjects were required to perform a task while we experimentally controlled the skewness of the distribution of errors they experienced. Based on the change in the subjects' average performance, we infer the loss function. We show that people use a loss function in which the cost increases approximately quadratically with error for small errors and significantly less than quadratically for large errors. The system is thus robust to outliers. This suggests that models of sensorimotor control and learning that have assumed minimizing squared error are a good approximation but tend to penalize large errors excessively.
The concept of a loss function that measures the success or cost of an outcome of a motor action is central to many theories of sensorimotor control. For goal directed movements, such a loss function, ψ = f(error) defines the relative merits, for example, of a 1-cm error compared with a 2-cm error. Once a loss function is defined, it can be used to determine the overall loss (the sum of individual losses) for a series of movements. A loss function thus specifies whether it is better to perform a series of movements in which the errors can have one of two possible distributions, for example, always 2 cm or alternating between 1 and 3 cm. If the loss function is quadratic in error, ψ ∼|error|2, then the first distribution of errors is more desirable (average loss = 4 vs. 5). However, if the loss is linear in error,ψ ∼|error|, then both are equally good (2 vs. 2). But if the loss function is proportional to the square root of the error, ψ ∼|error|0.5, then the alternating strategy is better (1.41 vs. 1.36).
Loss functions have been assumed to be quadratic in the error in almost all the models of sensorimotor control that consider them. Such models are often motivated by problems in engineering, such as linear quadratic regulators and Kalman filters (1), which are prominent because of their mathematical tractability. Examples come from models of reaching (2-5), posture (6), and eye movements (3). In the statistical literature, there is a large area of research exploring which loss functions are best to use when modeling real-world data. In many cases, it has been shown that it is beneficial to have fitting procedures that are resistant to outliers. This notion has given rise to the idea of robust fitting procedures that use loss functions that are not as sensitive to outliers as are quadratic functions (e.g., see ref. 7). Although the loss function is central to many theories of sensorimotor control, it has not been empirically measured.
Knowledge of the loss function can allow us to predict what constitutes the behavior that on average minimizes the loss (known as optimal behavior). In general, loss functions used by the CNS can be expected to increase with the error (the bigger the error, the bigger the loss) and be symmetric; that is, the loss is independent of the sign of the error. For linear systems with Gaussian noise, all such loss functions lead to the same optimal behavior in which movement should be unbiased (that is, on average on target). Therefore, examination of such movement provides little information about the loss function. However the human musculoskeletal system is a highly nonlinear system (8), leading to non-Gaussian statistics of errors, and, in this case, the loss function could have a profound effect on the optimal behavior.
We have developed a technique that allows us to directly measure the loss function. Although economists have measured loss (or utility) functions for a long time (9, 10), these methods have not yet been applied to sensorimotor control. To measure the loss function, we made the distribution of perceived errors asymmetric or skewed. Under such a skewed distribution, different loss functions predict specific changes in average behavior. We effectively gave people the choice of either making many small errors with the occasional very large error, or to make a large number of intermediate errors. The choice subjects made can be used to estimate the loss function.
Methods
Four male and four female naïve subjects participated in this study after giving informed consent. A projection/mirror system prevented direct view of their arm and allowed us to generate virtual images, displayed in the horizontal plane of the movement (for details of the set-up, see ref. 11). Subjects were required to aim a virtual pea-shooter at a target line 15 cm distal to their hand. To start a trial, subjects were required to move their finger into a starting sphere of radius 1 cm that was aligned with the horizontal position of the target. The translation of the pea-shooter was then controlled by the translation of the subject's index finger, which was measured online by using an Optotrak 3020 motion analysis system (NDI, Waterloo, ON, Canada).
Each trial lasted 6 seconds, during which white dots appeared that represented the location where the peas passed the target. Each pea was presented for 50 ms and a new one appeared every 100 ms. The location of each pea, x, was drawn from a probability distribution pρ (x,m) that depended on the mean, m, and a single parameter ρ that determined the skewness of the distribution:
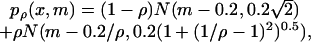 |
where N(μ, σ) is a Gaussian centered at μ with the standard deviation σ. The way this distribution is constructed is depicted in Fig. 1A. The value of ρ and, therefore, the shape of the distribution was fixed during each trial. However, movement of the hand determined the mean of the distribution (m) and, therefore, caused the entire distribution to be translated (Fig. 1B). The mean was related to the location of the hand by m = 0.4xhand + xoffset, where xhand is the location of the hand relative to the target and xoffset is drawn each trial from a zero-mean Gaussian distribution with a 1-cm SD. The gain factor of 0.4 was chosen to allow precise placement of the mean, independent of any motor noise. The offset was used to minimize effects of previous trials on the current trial. In 50% of the trials, the distribution was inverted to avoid biases subjects might have with respect to pointing left or right: p′ρ(x) = pρ(-x).
Fig. 1.

Experimental paradigm and theoretical predictions. (A) The distribution of the peas is constructed as a mixture of two Gaussians; the asymmetry is determined by a parameter ρ. (B) The experimental setup is shown. (C) Possible loss functions. (D) The resulting distributions are shown for various ρ along with the predictions of the optimal behavior under the four models shown in C.
Subjects were requested to move their finger so that the peas were “on average as close to the target as possible”. After an initial training period to familiarize the subjects with the experiment, each subject performed 1,000 trials. On each trial, ρ was chosen from a uniform distribution between 0.1 and 0.8. We analyzed subjects' behaviors by averaging their chosen value of m in bins of 0.05 in ρ. Each bin contained ≈70 points, and we only analyzed the median in each bin (a robust fitting technique) to avoid the effect of outliers on our results.
To asses the combined sensorimotor noise inherent in this task, four additional subjects performed 50 trials of a control experiment in which the peas appeared on the screen without any noise (so that the distribution was a delta function).
Possible Loss Functions. A number of different loss functions can be hypothesized to explain the performance of the subjects. Here, we only consider loss functions that are both symmetric and monotonically increasing functions of error (Fig. 1C). We first consider a strategy in which the loss function punishes all nonzero errors equally (Fig. 1C, hits). For this loss, subjects should maximize the number of direct hits by aligning the mode, the highest point of the distribution, with the target. Fig. 1D shows some of the distributions used in the experiment together with the point on the distribution that should be aligned with the target for optimal performance (icons correspond to the losses in Fig. 1C, absolute error). Alternatively, we can consider loss functions in which the errors are differentially penalized over the range. For example, we can consider a loss that penalizes the absolute error, ψ ∼|error| (Fig. 1C). For arbitrary distributions, it can be shown analytically that the optimal strategy is to align the median of the distribution with the target. For the distributions used in the experiment, the median lies between the mean and the mode of the distributions (Fig. 1D). Alternatively, the loss could penalize the squared error ψ ∼|error|2, the standard loss assumed in most studies. In this case, large errors are penalized disproportionately to small errors. For arbitrary distributions, it can be analytically shown that the optimal strategy is to align the mean of the distribution with the target (Fig. 1D). Finally, we can consider a loss that is similar to squared error but is robust to large errors. An example of such as loss is the inverted Gaussian ψ ∼ -exp(-error2/2σ2), which saturates for large errors (Fig. 1C lower). This loss function rises slower than a quadratic and is often used in robust fitting procedures. The optimal strategy for this robust function can be found numerically (Fig. 1D). Therefore, depending on the skewness of the peas' distributions, these loss functions make different predictions of how subjects should place the mean of the distribution (m) relative to the target.
Analysis. To estimate the subject's loss function, we examined the three fixed models above (hits, absolute error, and squared error) as well as two parametric models, that is (1) a power function of error ψ ∼|error|α and (2) an inverse Gaussian loss of the form ψ ∼ -exp(-error2/2σ2). For a given value of α or σ we can predict how the optimal mean, m, should vary with the asymmetry parameter, ρ. This value is found by finding the value of m that minimizes the expected loss. For example, for the power model we minimized
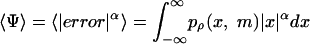 |
by using fminsearch in matlab (Mathworks, Natick, MA). For each subject, we found the value of α or σ that led to the closest fit to the binned data.
In addition, we also generated a nonparametric estimate of the loss function for each subject. We optimized a loss function so that it explained the data well and at the same time was smooth. For this purpose, we minimized the following functional:
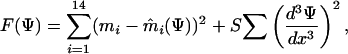 |
where ψ is the loss function being fitted, represented by a symmetrical piecewise linear function defined by 12 points between 0 and 3 (and the same points between 0 and -3), S is a parameter that regulates the tradeoff between smoothness of the loss function and fitting error, mi is the subject's chosen mean for the ith bin of ρ and m̂i(ψ) is the optimal mean given the loss function ψ, d3ψ/dx3 is the third derivative of the loss function given by  in matlab, where ψ is the 24-dimensional vector specifying the loss function. As the predictions of the loss function are invariant to both its offset and global scaling, we constrained the loss function to be 0 at x = 0 cm and to be 1 at x = 1 cm. In numeric simulations, we used a value of smoothing parameter S = 0.01. We found the inferred loss function to be relatively insensitive to the precise value of S. For example, increasing or decreasing S by a factor of 10 changed the inferred value of the loss function for an error of 2 cm by +10% and -15%, respectively. To find the best fit, we used a stochastic optimization method, which yielded a nonparameteric estimate of the loss function for each subject.
Results
Subjects found the task simple to perform. For the control subjects' trials, in which the peas had no noise associated with them, the SD across 50 trials was 0.25 ± 0.02 mm, showing that the combined motor and visual noise are very small in this experiment.
For the experimental subjects, we varied the asymmetry of the distributions of the peas. Subjects regulated the mean of the distribution to obtain a distribution of pea positions that was on average as close to the target as possible. For a representative subject (Fig. 2A) the mean m showed a systematic variation with the skewness parameter ρ. A strategy that minimizes the mean squared error, ψ ∼|error|2, would always place the mean on target (m = 0) independent of ρ (Fig. 2 A, horizontal line). A strategy that minimizes the absolute error, ψ ∼|error|, aligns the median with the target (Fig. 2 A, dashed line). A strategy that maximizes the number of hits aligns the mode with the target (Fig. 2 A, dotted line). The data show that this subject on average chose a mean that moves leftwards with decreasing ρ but with a more gradual slope than the one predicted by the absolute error. This behavior is in between that expected for a mean squared error loss and that expected for mean absolute error loss.
Fig. 2.

Results. (A) For a single subject, the value of m, where the subject placed the means of the distribution relative to the target, is shown as a function of ρ (thick black line with SEM). The different lines show the optimal behavior under the four models shown in Fig. 1C (icons as in Fig. 1) and the optimal fit for the power function model (red line). (B) The average mean, m, for all subjects together with the model fits. Error bars indicate SEM across subjects. The green lines show the data only for noninverted trials. (C) The nonparametric fit (SEM across subjects) is shown together with a quadratic loss function. The fitted functions are normalized so that the losses at 0 and 1 cm are identical for each subject.
We fit two different models to the subjects' data. We first fit α for loss function of the form ψ ∼|error|α. The red line in Fig. 2A shows this optimal fit for this subject, which corresponds to a value α = 1.69. The blue line shows the fit to the inverse Gaussian loss function, ψ ∼ -exp(-error2/2σ2), which for this subject resulted in σ = 1.70 cm.
Across the eight subjects there was also a systematic variation (Fig. 2B) of the chosen mean as the skewness parameter varied. This variation is also seen when only the noninverted trials are analyzed (Fig. 2B, green line). Fig. 2B shows the fits resulting from fitting the two loss functions for each of the subjects. For the power function of error, the population exhibited an α of 1.72 ± 0.03 (mean ± SEM), which is significantly different from 2 (P < 0.0001), and for the inverse Gaussian loss a σ of 2.03 ± 0.08 cm (mean ± SEM). Although the fit of the latter function is qualitatively somewhat better, we cannot statistically distinguish between them. However, for the fitted values, both of these loss functions punish large errors less than the quadratic function. Punishing large errors less means that the response is less influenced by the occasional outlier.
When fitting the above loss functions we have assumed a particular form of the loss function. There is a different approach that can be used to infer the loss function. Instead of fitting a specific loss function to the data, we can use a nonparametric approach in which we try to infer a smooth function that fits the data well. We fit such a function to all of our subjects (see Methods). Fig. 2C shows the inferred loss function for the set of all of our subjects along with a quadratic function. All of the inferred loss functions increase less than quadratically with error.
Discussion
We have measured the loss function used by subjects when aiming at a spatial target. We found that altering the skewness of the distribution of errors, without altering the average error, systematically influenced the subjects' targeting behaviors. The behavior was inconsistent with minimizing either the absolute error or the mean squared error. Fitting two parametric models of the loss function as well as performing a nonparametric fit showed that the loss function punishes large errors less than predicted by a quadratic loss function. For small errors, however, the function is very well approximated by a quadratic function. This finding suggests that models of sensorimotor control and learning that have assumed minimizing squared errors are a good approximation but tend to overly penalize large errors.
Although we can be sure from our data that the loss function is significantly less than quadratic for large errors, it is hard to distinguish between models, such as robust polynomial and inverted Gaussian. The difficulty in distinguishing between these models arises from the models being similar for large errors and from the relative infrequency of large errors in the experiment. However, the key feature of robust estimators is that the loss is subquadratic for large errors systems (7).
A number of other studies have addressed related issues. Scheidt and coworkers (12) used probabilistic stimuli and showed that subjects adapt to the average perturbation. However, they did not systematically analyze skewed distributions and could not address the issue of loss functions. Because their experiment furthermore involved significant forces, the loss function should be expected to be a mixture between force-dependent and precision-dependent terms. Trommershäuser and coworkers (5) used externally defined loss functions (defined by monetary rewards) to show that people can use decision theory to perform optimally for such an externally defined loss. Our study goes beyond the idea of imposing a loss function but assumes that people are able to optimize an inherent loss function and that we can systematically measure this function.
Our visual system provides us with the error estimate. Various studies have shown that the system uses prior knowledge, for example, about the symmetry of configurations when memorizing visual stimuli (e.g., ref. 13). Could our results be influenced by a prior expectation of errors playing into a Bayesian process? Such a Bayesian integration process is unlikely to account for the measured effects based on two lines of reasoning. First, it may well be that because sensory and motor noise tend to be corrupted by Gaussian processes that subjects come to the experiment with a Gaussian prior over errors. As we have shown recently (14), such a Gaussian prior together with uncertainty in sensory feedback leads to a Bayes optimal estimate that shifts the percept toward the mean of the prior. The amount of this shift is proportional to the distance from the mean of the prior. The net effect is that all perceived errors are simply scaled by an unknown constant, k. All of the model classes we have examined in the current study are invariant under such a scaling; for example, the optimal behavior arising from minimizing |error|α is identical to minimizing|k·error|α = kα|error|α. Therefore, the fit to the data and the quality of fit is unaltered. Second, although we feel a Gaussian prior is the most likely based on previous studies, we performed a control experiment to assess the combined sensory and motor variability. We found that, in this case, subjects were very precise, with a SD of 0.25 mm in visual space, showing that, in this task, both their visual and motor systems are very precise. The width of the distributions used is, therefore, large compared with the width of the uncertainty, and Bayesian processing is unlikely to have a significant influence.
Loss functions are central to computational theories of sensorimotor control. Theories of optimal control (3) and of optimal Bayesian decisions (14), as well as those approaches that rely on reinforcement learning (15), all depend on the choice of a loss function. The current implementations of these theories use the mean squared error as the loss function, such that doubling an error quadruples the cost. In this paper, we have provided evidence for a loss function that is close to such a quadratic error function that had been hypothesized on theoretical grounds. However, the loss deviates from a quadratic such that outliers are not penalized excessively. Such insensitivity to outliers is the defining feature or robust fitting procedures and has been shown to be useful in many real-world systems (7). Deviating from a quadratic function might thus be of ethological advantage. However, because the measured loss functions are relatively close to quadratic, the theoretical predictions of the present models that assume that people minimize the mean squared error are good approximations to the human loss function as long as the movements are such that no strong nonlinear properties of the underlying motor plant skew the resulting distributions
Previous studies have examined how an error on one movement affects errors on subsequent movements (16, 17). In our experiment, it could be that, if the peas' distributions changed over time, more recent peas would be more important in determining behavior than earlier peas. However, given that, within each trial the distribution was fixed, the order of peas will on average not influence our results. It is an open question over what time period the distribution is sensed and optimized.
In this study, we have analyzed how the human loss function depends on the errors made. However, in general, the loss function will also depend on the task demands. When holding a cup, for example, the loss as a function of grip force may have an abrupt transition at the point when the grip force becomes too small and the cup slips from the grasp. For the type of task analyzed in this study, the loss function seems to be highly conserved over subjects, and we expect it to generalize to various kinds of pointing tasks. In general, the loss function for different tasks will depend on many other factors, such as smoothness, energy, or time (18-20). By using techniques related to the one we have described, it should be possible to measure quantitatively how the loss depends on such parameters.
Acknowledgments
We thank Joshua Tenenbaum and Sandro Mussa-Ivaldi for inspiring discussions and James Ingram for technical support. This work was supported by the Wellcome Trust, the McDonnell Foundation, and the Human Frontiers Science Program.
This paper was submitted directly (Track II) to the PNAS office.
References
- 1.Kalman, R. E. (1960) J. Basic Eng. 82, 35-45. [Google Scholar]
- 2.Wolpert, D. M., Ghahramani, Z. & Jordan, M. I. (1995) Science 269, 1880-1882. [DOI] [PubMed] [Google Scholar]
- 3.Harris, C. M. & Wolpert, D. M. (1998) Nature 394, 780-784. [DOI] [PubMed] [Google Scholar]
- 4.Todorov, E. & Jordan, M. I. (2002) Nat. Neurosci. 5, 1226-1235. [DOI] [PubMed] [Google Scholar]
- 5.Trommershäuser, J., Maloney, L. T. & Landy, M. S. (2003) J. Opt. Soc. Am. A 20, 1419-1433. [DOI] [PubMed] [Google Scholar]
- 6.Kuo, A. D. (1995) IEEE Trans. Biomed. Eng. 42, 87-101. [DOI] [PubMed] [Google Scholar]
- 7.Huber, P. J. (1981) Robust Statistics (Wiley, New York).
- 8.Cheng, E., Brown, I. E. & Loeb, G. E. (2000) J. Neurosci. Methods 101, 117-130. [DOI] [PubMed] [Google Scholar]
- 9.Mosteller, F. & Nogee, P. (1951) J. Political Econ. 59, 371-404. [Google Scholar]
- 10.Starmer, C. (2000) J. Econ. Lit. 38, 332-382. [Google Scholar]
- 11.Goodbody, S. J. & Wolpert, D. M. (1998) J. Neurophysiol. 79, 1825-1838. [DOI] [PubMed] [Google Scholar]
- 12.Scheidt, R. A., Dingwell, J. B. & Mussa-Ivaldi, F. A. (2001) J. Neurophysiol. 86, 971-985. [DOI] [PubMed] [Google Scholar]
- 13.Tversky, B. & Schiano, D. (1989) J. Exp. Psychol. 118, 387-398. [DOI] [PubMed] [Google Scholar]
- 14.Körding, K. P. & Wolpert, D. M. (2004) Nature 427, 244-247. [DOI] [PubMed] [Google Scholar]
- 15.Sutton, R. S. & Barto, A. G. (1981) Cognit. Brain Theory 3, 217-246. [Google Scholar]
- 16.Thoroughman, K. A. & Shadmehr, R. (2000) Nature 407, 742-747. [DOI] [PMC free article] [PubMed] [Google Scholar]
- 17.Donchin, O., Francis, J. T. & Shadmehr, R. (2003) J. Neurosci. 23, 9032-9045. [DOI] [PMC free article] [PubMed] [Google Scholar]
- 18.Flash, T. & Hogan, N. (1985) J. Neurosci. 5, 1688-1703. [DOI] [PMC free article] [PubMed] [Google Scholar]
- 19.Uno, Y., Kawato, M. & Suzuki, R. (1989) Biol. Cybern. 61, 89-101. [DOI] [PubMed] [Google Scholar]
- 20.Harris, C. M. (1995) Vision Res. 35, 691-701. [DOI] [PubMed] [Google Scholar]