Abstract
In this study, a comparative analysis of metal-related neuronal vulnerability was performed in two brainstem nuclei, the locus coeruleus (LC) and substantia nigra (SN), known targets of the etiological noxae in Parkinson's disease and related disorders. LC and SN pars compacta neurons both degenerate in Parkinson's disease and other Parkinsonisms; however, LC neurons are comparatively less affected and with a variable degree of involvement. In this study, iron, copper, and their major molecular forms like ferritins, ceruloplasmin, neuromelanin (NM), manganese-superoxide dismutase (SOD), and copper/zinc-SOD were measured in LC and SN of normal subjects at different ages. Iron content in LC was much lower than that in SN, and the ratio heavy-chain ferritin/iron in LC was higher than in the SN. The NM concentration was similar in LC and SN, but the iron content in NM of LC was much lower than SN. In both regions, heavy- and light-chain ferritins were present only in glia and were not detectable in neurons. These data suggest that in LC neurons, the iron mobilization and toxicity is lower than that in SN and is efficiently buffered by NM. The bigger damage occurring in SN could be related to the higher content of iron. Ferritins accomplish the same function of buffering iron in glial cells. Ceruloplasmin levels were similar in LC and SN, but copper was higher in LC. However, the copper content in NM of LC was higher than that of SN, indicating a higher copper mobilization in LC neurons. Manganese-SOD and copper/zinc-SOD had similar age trend in LC and SN. These results may explain at least one of the reasons underlying lower vulnerability of LC compared to SN in Parkinsonian syndromes.
Locus coeruleus (LC) is the main brain region containing norepinephrine neurons. The rostral projections from these neurons seem to be involved in the modulation of neuronal activity, metabolism, and memory (1, 2), whereas the spinal cord projections are known to modulate spinal motoneuron function (3, 4).
Neuronal loss in LC occurs in conditions such as Parkinson's disease (PD) and Alzheimer's disease and Down's syndrome (5, 6) with different cellular loss in rostral and caudal parts of LC. In Alzheimer's disease and Down's syndrome, it is not clear whether neuronal loss in LC is a primary event or a consequence of retrograde degeneration of cortically projecting cells due to the loss of cortical synapses. In idiopathic PD, most studies have documented a higher degree of neuronal loss in substantia nigra (SN) compared to LC (5-8). However, a recent study reported extensive impairment of LC neurons in PD (9). SN and LC share anatomical and biochemical similarities, being both pigmented because of neuromelanin (NM), and both composed of catecholaminergic neurons. Yet, in 1-methyl-4-phenyl-1,2,3,6-tetrahydropyridine-intoxicated subjects, LC neurons are spared, whereas a large neuronal depletion occurs in SN (10, 11). Also, in other types of Parkinsonian syndromes caused by exposure to toxins, the LC neurons seem less damaged than those of SN (12, 13). For some reason, in case of intoxication, neurons in the LC seem to be less vulnerable than in the SN.
In previous studies, the trend in aging of factors like iron, ferritins, and NM (14-18) has been analyzed. These factors may influence neuronal viability and undergo dramatic changes in PD. Aging is also an important risk factor for PD. Thus, it seems relevant to establish the age trend of elements involved in oxidative stress like iron, copper, and related molecules, all of which have been implicated as putative pathogenic factors.
Because of their role in peroxidation, in the present study the age trends of iron, copper, their major storage proteins ferritin and ceruloplasmin (Cp), together with the enzymes manganese-superoxide dismutase (SOD) and copper/zinc-SOD, were determined in human SN and LC at various ages. Being a strong chelator of iron and other toxic metals (18), NM was also investigated in consideration of its ability to bind organic toxins (19, 20), making NM a strong modulator of cellular effects of metals and organic toxins (21).
Materials and Methods
Collection of Brain Areas. For this study, midbrain samples were obtained during autopsies of male and female subjects who had died at different ages (ranging from 14 to 97 years old) without evidence of neuropsychiatric and degenerative disorders. Autopsies were carried out within 24 h after death. Samples of LC and SN were carefully dissected always by the same person (L.Z.) and then stored at -80°C until use. Tissues for histology and histochemistry evaluation were fixed in 10% formalin and processed accordingly. The normal subjects included in this study at pathological examination did not show macroscopic alterations of neurological and vascular type. At histological examination, no Lewy bodies and other pathological markers were observed. The vast majority of the samples of LC and SN used were obtained from the same subjects. However, because of the smaller size of LC with respect to SN, the amounts of LC tissue available were sometimes insufficient for all measurements, so LC samples from other subjects were also used in this study.
Isolation of NM from LC. Pooled samples of LC were processed as described for SN to isolate the NM in ref. 18.
Determination of NM Concentration in LC Samples. The NM levels were measured as reported in ref. 18.
Isolation of NM from SN. Pooled SN samples were processed for NM isolation as previously described in refs. 22-24.
Determination of NM Concentration in SN Samples. The NM content in SN samples was determined as described in ref. 18.
Determination of Heavy-Chain (H-) and Light-Chain (L-)Ferritin Concentration. Samples of LC and SN were processed for ferritin quantitation as described in ref. 17.
Determination of Cp Concentration. Samples of LC and SN were homogenized in lysis buffer containing Tris (20 mM, pH 7.4) and protease inhibitor mixture (Sigma) and centrifuged at 2,240 × g for 10 min at 4°C. The supernatants were collected and stored at -20°C until analysis. The content of Cp was determined by immunonephelometric assay with a BNA II automatic analyzer (Behring) by using rabbit polyclonal antibodies against Cp.
Determination of Copper/Zinc-SOD and Manganese-SOD Activity. Activity of copper/zinc-SOD and manganese-SOD was measured in LC and SN according to the methods described in ref. 25.
Determination of Iron and Copper. Concentrations of metals were measured as reported in ref. 17.
Electron Paramagnetic Resonance Spectroscopy of NM-Iron Complex. Spectra of SN and LC tissues were recorded and analyzed as described in ref. 22.
Immunohistochemistry of H- and L-Ferritins. Immunostaining was performed on formalin-fixed, paraffin-embedded tissue sections by using monoclonal antibodies specific for H- (rH02) and L-ferritin (LF03) developed in the mouse. Biotinylated goat anti-mouse IgM (Jackson ImmunoResearch) was used as a secondary antibody with avidin-biotin-horseradish peroxidase complex (Vector Laboratories). Slides were developed with diaminobenzidine substrate with nickel enhancement (Vector Laboratories), mounted, and photographed.
Iron Histochemistry. Iron (III) staining was performed on 6-μm tissue sections from paraffin-embedded tissues. After deparaffinization and rehydration through graded ethanol, sections were incubated for1hat37°C in 7% potassium ferrocyanide in aqueous hydrochloric acid (3%), according to a modified Perls' method (26). Counterstain was performed with Carmalum Mayer.
Results
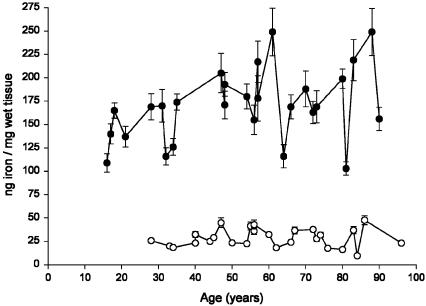
Age Trend of Iron Concentration in SN and LC. In Fig. 1, the concentrations of iron in the SN and LC of subjects in the whole age-range considered in this study are shown. The concentration of iron in LC was constant in aging and was much lower than that measured in SN. The concentrations of iron in SN had a smooth increase during life according to a linear model. Particular attention was paid to methodological issues. Samples were dissected and collected with tools made only with Teflon or titanium. This issue was important, considering the low iron content found in LC. To confirm the values measured by neutron activation analysis, iron was also measured by electrothermal atomic absorption spectroscopy, and very similar values were found (data not shown).
Fig. 1.
Concentration of iron (ng/mg of wet tissue) in LC (○) and in SN (•)of human normal subjects during aging. Values are given as mean ± SEM (n = 2). In SN, data were best fit to a linear regression model (Y = 0.668X + 134.494, R2 = 0.158, P = 0.040).
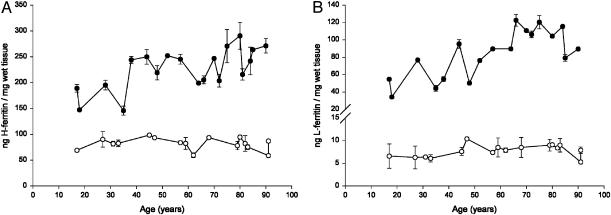
Age Trend of H-Ferrritin and L-Ferritin in SN and LC. The age trend of H-ferritin in SN and LC are shown in Fig. 2A. The values of H-ferritin in LC were constant during the life and lower than those found in SN. The levels of H-ferritin in SN increased during the life according to a linear function. A similar situation was observed for L-ferritin in SN and LC as shown in Fig. 2B. That is, L-ferritin was constant during life in LC, whereas it increased linearly with age in the SN. However, the concentration of L-ferritin was lower than that of H-ferritin in the respective brain area.
Fig. 2.
Age trend of ferritins in SN and LC. (A) Concentration of H-ferritin (ng/mg of wet tissue) in LC (○) and in SN (•) of human normal subjects during aging. Values are expressed as mean ± SEM (n = 6). In SN, data were best fit to a linear regression model (Y = 1.151X + 159.455, R2 = 0.439, P = 0.002). (B) Concentration of L-ferritin (ng/mg of wet tissue) in LC (○) and in SN (•) of human normal subjects during aging. Values are expressed as mean ± SEM (n = 6). In SN, data were best fit to a linear regression model (Y = 0.886X + 33.830, R2 = 0.562, P = 0.0003).
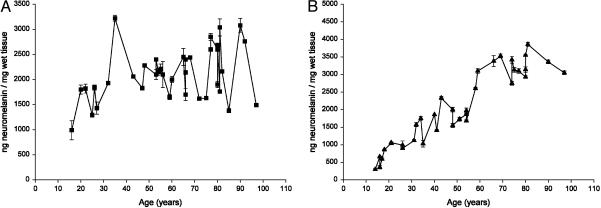
Age Trend of NM in LC and SN. In Fig. 3, the values of NM concentrations in LC and SN are shown. In both areas, a linear increase of NM concentration occurred during life. However, the slope of the accumulation curve in SN was steeper than in LC as shown by the corresponding values given in the legend. There was also a larger spread of concentration values in LC compared to SN and the relative R2 values are reported.
Fig. 3.
Concentration of NM (ng/mg of wet tissue) in LC (A) and in SN (B) of human normal subjects during aging. Values are expressed as mean ± SEM (n = 2). Data were best fit to a linear regression model (Y = 8.345X + 1587.954, R2 = 0.127, P = 0.028 in LC; Y = 40.648X + 10.108, R2 = 0.872, P = 0.0001 in SN).
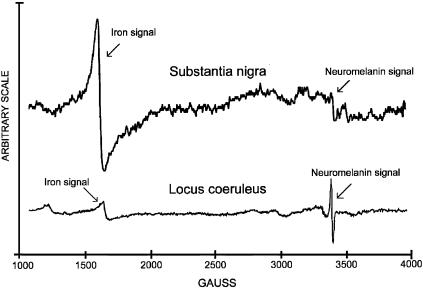
Interaction of NM with Iron Investigated by EPR Spectroscopy. In Fig. 4, typical EPR spectra of LC and SN are shown. The signal at g4 corresponds to iron (Fe3+) high spin complex in octahedral configuration. The g2 signal is from the stable free radical typically present in both NMs. The ratio of signal intensity iron/free radical in SN was 5.16, whereas in LC it was 0.31. Based on our previously reported calibrations (27), this means that the iron content in NM of LC was 7.9% of that found in NM of SN. The same signals were present in NM isolated from LC and SN, but the ratio of signal intensity of the iron/free radical was higher in isolated NMs than in original LC and SN (data not shown). The higher iron/free radical signal found in isolated NMs is due to an uptake of iron by NM during isolation from LC and SN when cellular compartments are broken and the free iron is scavenged by NM. The NM of LC and SN form a very stable complex with iron, and only treatment for 48 h with strong chelators like desferal or EDTA can remove 30% of the bound iron.
Fig. 4.
EPR spectra of NM-iron complex in SN and in LC.
Concentration of Iron and Copper in NM Isolated from LC and SN. The concentration of iron in NM from LC was 1,777 ± 92 ng/mg NM (mean ± SEM; n = 3), which is much lower (t test; P = 0.003) than that found in NM from SN corresponding to 10,891 ± 1,416 ng/mg NM (mean ± SEM; n = 3). This value is higher than that found with EPR because, during isolation of NM, a further amount of iron is accumulated as explained above. In contrast to iron, the concentration of copper in NM from LC was 605 ± 79 ng/mg of NM (mean ± SEM; n = 3), higher (t test; P = 0.007) than that measured in NM from SN, which was 185 ± 24 ng/mg of NM (mean ± SEM; n = 3).
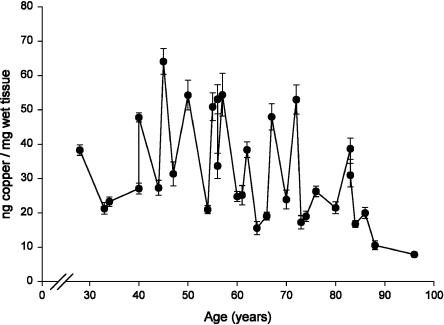
Age Trend of Copper in LC and SN. In Fig. 5, the concentrations of copper in LC is reported. The trend of values fits a linear model with a decreasing trend during aging. In SN the concentration values of copper did not show any significant trend. The average concentration in LC (age range, 28-96 years) was 31 ± 3 ng/mg of wet tissue (mean ± SEM; n = 32) and was higher (t test; P = 0.001) than that in SN (age range, 17-88 years), which was 16 ± 2 ng/mg of wet tissue (mean ± SEM; n = 24).
Fig. 5.
Concentration of copper (ng/mg of wet tissue) in LC of human normal subjects during aging. Values are mean ± SEM (n = 2). Data were best fit to a linear regression model (Y = -0.331X + 51.935, R2 = 0.157, P = 0.025).
Age Trend of Cp in LC and SN. The average concentrations of Cp in LC (age range, 18-95 years) was 854 ± 66 ng/mg of wet tissue (mean ± SEM; n = 25) and that in SN (age range, 16-95 years) was 1,198 ± 108 ng/mg of wet tissue (mean ± SEM; n = 19). The concentration of Cp in LC had a bell-shaped trend with lowest values in the 50- to 80-year-old range. The concentration of Cp in SN did not show any specific trend.
Age Trend of Copper/Zinc-SOD and Manganese-SOD in LC and SN. The activity values of copper/zinc-SOD in LC and SN did not vary during aging. The value of copper/zinc-SOD in LC (age range, 33-88 years) was 693 ± 95 milliunits/mg of protein (mean ± SEM; n = 14), and the value in SN (age range, 30-88 years) was 1,188 ± 153 milliunits/mg of protein (mean ± SEM; n = 14). Values of copper/zinc-SOD in LC were significantly lower than in SN (t test; P = 0.01).
The activity values of manganese-SOD in LC decreased during aging according to a linear regression model (Y = -55.121X + 6979.571, R2 = 0.441, P = 0.009), whereas in SN no significant trend was observed. The activity of manganese-SOD in LC (age range, 33-88 years) was 3,468 ± 322 milliunits/mg of protein (mean ± SEM; n = 14), and activity in SN (age range, 30-88 years) was 4,421 ± 482 milliunits/mg of protein (mean ± SEM; n = 14).
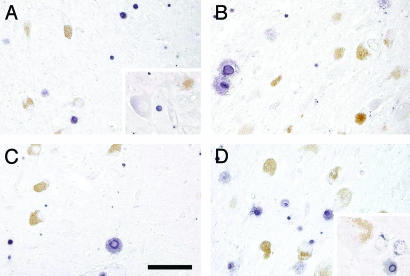
Cellular Distribution of H- and L-Ferritin in LC and SN. In Fig. 6, the immunostaining with monoclonal antibodies against H-ferritin and L-ferritin in LC and SN is shown. In SN, the H-ferritin staining is found mostly in oligodendrocyte cells, and only a very weak staining appears in a few neurons containing NM. In a very few nonpigmented neurons of SN, a light H-ferritin staining was observed. In SN, the L-ferritin is largely seen again in oligodendrocytes and is undetectable in NM neurons. H and L-ferritin are similarly localized in the LC cells with high staining for both in oligodendrocytes but no staining in NM neurons. Only a few nonpigmented neurons of LC had a light L-ferritin staining.
Fig. 6.
Cellular distribution of ferritins in SN and LC. Immunohistochemistry of H-ferritin in SN (A) and in LC (B). Immunohistochemistry of L-ferritin in SN (C) and in LC (D). Tissues are from a normal 83-year-old female subject. NM of dopaminergic neurons of SN and norepinephrine neurons of LC are brown granules. The H- and L-ferritin reaction products are violet. (Scale bar, 100 μm.) In SN, only a few neurons containing NM have a very light violet staining; the neurons then show a low content of H-ferritin. At higher magnification, a light violet staining is observed in a nonpigmented neuron (A). Many violet-staining oligodendrocytes occur in SN (A) and LC (B) with H-ferritin-positive reactions in nuclei and cytoplasm. L-ferritin staining is not detected in any NM neuron of both SN (C) and LC (D). At higher magnification in two nonpigmented neurons of LC, only a few spots of L-ferritin staining are present in the cytoplasm (D). Again, a high number of L-ferritin positive oligodendrocytes is observed in SN (C) and LC (D).
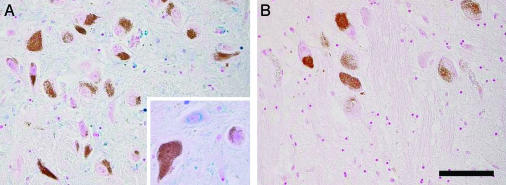
Cellular Distribution of Nonchelated Iron in LC and SN. In Fig. 7, slices of SN and LC, respectively, stained for iron by modified Perls' method are shown. A high number of extraneuronal iron deposits are present in SN, whereas very few iron deposits are observed in LC. Iron occurs in a large number of SN cells and especially in oligodendrocytes, whereas very few LC cells have iron staining. No iron deposits are seen in NM containing neurons of both SN and LC. Iron deposits are found in several nonpigmented neurons of SN.
Fig. 7.
Iron histochemistry with modified Perls' staining of human SN (A) and LC (B) from a normal 88-year-old male subject. NM of dopaminergic neurons of SN and norepinephrine neurons of LC are brown granules, and iron deposits are colored in blue. (Scale bar, 100 μm.) NM-containing neurons in both SN (A) and LC (B) do not have the blue staining of iron. In SN (A), there are many iron-positive cells, which are most often oligodendrocytes with cytoplasmic iron deposits, and in LC (B) there are very few oligodendrocytes with light iron staining. Iron deposits are present also in the cytoplasm of nonpigmented neurons of SN (A) as shown at higher magnification. Iron deposits can be observed in the whole SN (A) parenchima with the exception of pigmented neurons, but they are completely absent in LC (B) parenchima.
Discussion
Iron Content in LC Is Much Lower than That of SN and Is Steady in Aging. The content of iron, copper, NM, ferritins, Cp, copper/zinc-SOD, and manganese-SOD in LC are reported here. The most striking finding is the very low concentration of iron measured in LC, which is much lower than that found in SN and other brain regions, such as basal ganglia nuclei (14, 15, 17, 22). The levels of iron in LC were constant throughout life, whereas iron in SN increases in aging (17). Iron deposits histochemically detectable are absent in NM neurons of SN, in agreement with previous studies (22, 28), and are due to the ability of NM in scavenging iron to form the complex NM-iron. The density of iron deposits observed by histochemistry in LC is also much lower than that in SN, thus paralleling the difference in total iron concentration between LC and SN measured by electrothermal atomic absorption spectroscopy and neutron activation analysis. It is important to note that such a low density of iron deposits in LC is found even in elderly subjects (>80 years old). These deposits contain mobile iron compared to the highly stable iron present in ferritins and NM. Thus, the risk of iron mobilization and the consequent neurotoxic effect seems lower in LC than in SN even in elderly subjects.
NM Accumulation in LC in Aging Starts Earlier than in SN. The levels of NM found in LC were similar to those found in SN (18). However, the slope of the accumulation curve in SN was much steeper than in LC. In other words, an earlier accumulation of NM occurs in LC with respect to SN. Extrapolation of the LC curve suggests that NM is already present at birth in agreement with observations from histological studies (29). Because NM synthesis depends on the levels of cytosolic catecholamine (30), this earlier but slower accumulation of NM in LC could be due to a low and constant expression of VMAT2 during life. The NM of LC derives from norepinephrine oxidation, whereas NM of SN derives from dopamine oxidation; however, these two NMs share several structural aspects as shown by EPR spectra here reported, previously described (22), and by UV-VIS, IR, and NMR spectra (data not shown).
Low Iron in LC Neurons Is Chelated by NM. NM is a strong chelator of heavy metals because of the presence of catechol groups in its structure (31). The ratio NM/iron is much higher in LC than in SN. NM has strong chelating ability for iron, which provides another important mechanism of protection from iron mobilization and the consequent toxicity in LC and SN. Indeed, ferritins are poorly expressed in both LC and SN neurons, where the major buffer system against iron and other metals toxicity is NM.
The larger amount of NM bound iron in the SN with respect to LC indicates that more free iron is present in SN neurons. The lower exposure of LC neurons to free iron is a key to their lesser vulnerability to oxidative stress compared to the SN. In this regard, it is relevant that NM inhibits the formation of hydroxy radicals catalyzed by iron (32).
As shown by EPR measurements, only a minor part of NM chelating ability is filled with iron, leaving ample availability to block more iron and other toxic metals. In fact, NM can form stable complexes with cadmium, mercury, and lead, thus reducing their toxicity (33, 34).
NM accumulation in LC occurs earlier than in SN in the early phase of life (29). As a consequence, LC neurons are less exposed than those of SN against iron toxicity, as the same content of NM in SN is reached toward the sixth decade of life. The very low content of iron found in NM of LC compared to NM of SN suggests a lower iron mobilization in LC neurons, and consequently, a lower intraneuronal iron-mediated toxicity should be expected. Apart from metal chelation, other factors contribute to NM's protecting ability such as the capability of accumulating organic toxins (19, 20, 34). In addition, during NM synthesis, excess catechols are removed from the cytosol, providing yet another antioxidant mechanism (30).
Glial Iron in LC Is Low and Is Efficiently Chelated by Ferritins. The concentrations of H- and L-ferritins in SN were increasing during life and were much higher than those measured in the LC. Because ferritins are the major storage molecules of iron, their content must be referred to iron content to infer the risk effect of free iron. The ratio of H-ferritin/iron concentration in LC was 2.85, whereas such a ratio in SN was only 1.33. H-ferritin binds iron (Fe2+) and converts it into iron (Fe3+), which is stored in both H- and L-ferritin. Because of the higher H-ferritin/iron ratio present in LC with respect to SN, there is a more efficient iron stabilization, which could make LC more protected against the cytotoxic effect of iron. The low iron content in glia and the low iron load in ferritins probably reduces the reactive gliosis and the consequent risk of neuronal damage in LC compared to SN. The increase of H-ferritin observed during aging seems to be a compensatory response to block the increase of free iron in the SN. On the contrary, in keeping with steady iron content, in the LC, H-ferritin is also constant throughout life.
Because H and L-ferritin antibody staining observed in neurons is much lower than that in glia and because of the large amount of NM-Fe complex detected by EPR, NM is the major molecule for iron storage in LC neurons. A similar situation was described previously in SN neurons (17). On the other hand, the toxicity arising from glial iron in LC could be efficiently reduced by a ratio H-ferritin/iron, which is much higher than that found in SN. In animal studies, it was demonstrated that the decrease in content of reactive iron by genetic or pharmacological chelation results in protection against 1-methyl-4-phenyl-1,2,3,6-tetrahydropyridine toxicity, and efforts are made for the development of specific chelators for removal of iron overload in brain (35-38).
As shown by immunohistochemistry, the ferritin content in both LC and SN neurons is much lower than that present in glia. Whereas iron in neurons is efficiently blocked from the NM-Fe complex, in glia the major iron storage molecule is ferritin.
Iron can participate in neurodegenerative processes through different pathways (Fenton's reaction, protein aggregation, etc.) taking place in neurons and causing them damage (39). Alternatively, iron can activate microglia, which releases toxic molecules like cytokines and nitric oxide. Several studies demonstrated the key role of iron in neurodegeneration (for review, see ref. 40). It was shown that a point mutation in ferritin L-chain is responsible for a primary disorder of iron storage with increased iron and ferritin deposits in globus pallidus and other brain regions. This neuroferritinopathy is characterized by chorea, focal distonia, and akinetic-rigid Parkinsonism (41).
Copper Content in LC Decreases with Aging LC and Increases in SN. The average copper content in LC was higher than that measured in SN within the considered age range; however, the trends were quite different. In fact, the copper concentration in LC decreases in the elderly, whereas it does not vary in SN. This study shows SN copper levels lower than those previously reported (42), but we used a more specific method and certified standards, whereas in a previous study flame atomic absorption spectroscopy was used and details on the standards were not given.
More Copper Is Bound to NM in LC Neurons than in SN. Interestingly, copper is more concentrated in NM isolated from LC than in NM isolated from SN. Thus, free copper is more abundant in LC neurons than in SN neurons; and so, copper could play a role more important than that of iron in the toxic process within LC neurons. Indeed, the free metals are promptly chelated by NM in neurons. The higher content of copper found in NM of LC compared to NM of SN is likely due to the occurrence of dopamine beta hydroxylase, a copper containing monooxygenase, responsible for the conversion of dopamine into norepinephrine (43).
Cp in LC Increases in Aging to Compensate for Copper Decrease and to Maintain Iron Homeostasis. For Cp, which is the major transport molecule of copper, it is observed that the average concentration is similar in LC and SN, but the trends seem different. In LC, the concentration of Cp increases after 80 years of age, whereas copper levels decrease in the same age range. No correlation between copper and Cp is observed in SN. The observed increase of Cp in LC in the elderly is likely to be a compensatory response to provide the copper supply to cells in situations of reduced copper availability, even if Cp accounts only for 1% of the copper present in brain tissue. No correlation was found between copper content and copper/zinc-SOD content in LC and SN, although this enzyme contains 25% of the total copper content of the brain. The conditions of copper decrease and Cp increase, found in LC of aged subjects, resemble that reported in SN of PD patients (15, 42, 44). Thus, copper could eventually be more involved than iron in neurodegenerative processes of LC. However, Cp also plays an important role in maintaining iron homeostasis in the brain, and its ferroxidase activity protects from iron toxicity (45). Altered copper metabolism is an established causative factor in diseased like Wilson and Menke's with neurodegenerative consequences and in primary distonia (46). In any case, copper pathways in the brain are quite complicated because of the presence of several copper proteins whose role is still unclear. It is thus difficult to draw conclusions on the neuroprotective or neurotoxic role of copper until its puzzle is not fully decoded.
Manganese-SOD Activity in Aging Decreases in LC. In SN, no changes in the activity of copper/zinc-SOD and manganese-SOD were observed, whereas in LC the reduction of manganese-SOD probably indicates a lower degree of oxidative stress taking place in this region, and conditions for neuronal survival are better than those of SN. In SN of PD subjects, the picture of changes for copper/zinc-SOD and manganese-SOD is not clear (47, 48), and a decrease in copper/zinc-SOD mRNA was described (49).
Conclusions
In this study, iron, copper, and their major molecular forms ferritins, Cp, NM, manganese-SOD, and copper/zinc-SOD were measured in LC and SN of normal subjects at different ages. In the LC, iron levels were much lower than those in the SN, and the H-ferritin/iron ratios were much higher than those of SN. The NM concentration was similar in the two nuclei, but the iron content in NM of LC was much lower than in the SN. In both regions, H- and L-ferritins were present mostly in glia and only at very low levels in neurons. Altogether, these data suggest that in neurons NM buffers free metals and likely their toxicity in both LC and SN. In the latter brain region, the bigger damage occurring in PD is probably the consequence of the higher presence of iron. Ferritins accomplish the same function in glial cells. Copper and Cp levels were similar in LC and SN. However, the copper content in NM of LC was higher than that of SN, indicating a higher copper mobilization in LC neurons. Manganese-SOD and copper/zinc-SOD had similar age trends in LC and SN. These results may explain at least one of the reasons underlying selective vulnerability of the SN to noxae involving iron-mediated oxidative damage. In those pathological conditions where iron-mediated oxidative stress plays an important role, SN neurons are more vulnerable. Other pathogenic mechanisms need to be at work for selective degeneration of LC neurons. The preferential depletion of one of the two structures in different neurodegenerative disorders may depend on this iron-related pathogenic specificity.
Acknowledgments
We thank Ms. Chiara Bellei for assistance. This work was supported by the Michael J. Fox Foundation for Parkinson's Research, the Parkinson's Disease Foundation, the Cariplo Foundation, and National Science Foundation Grant CHE01-10655 (to N.T.).
Abbreviations: LC, locus coeruleus; PD, Parkinson's disease; SN, substantia nigra; NM, neuromelanin; Cp, ceruloplasmin; SOD, superoxide dismutase; H-ferritin, heavy-chain ferritin; L-ferritin, light-chain ferritin.
References
- 1.Foote, S. L., Freedman, R. & Oliver, A. P. (1975) Brain Res. 86, 229-242. [DOI] [PubMed] [Google Scholar]
- 2.Arnsten, A. F. & Goldman-Rakic, P. S. (1987) J. Neural Transm. 24, 317-324. [PubMed] [Google Scholar]
- 3.Mason, S. T. & Fibiger, H. C. (1979) J. Comp. Neurol. 187, 703-724. [DOI] [PubMed] [Google Scholar]
- 4.Nygren, L. G. & Olson, L. (1977) Brain Res. 132, 85-93. [DOI] [PubMed] [Google Scholar]
- 5.German, D. C., Manaye, K. F., White, C. L. III, Woodward, D. J., McIntire, D. D., Smith, W. K., Kalaria, R. N. & Mann, D. M. (1992) Ann. Neurol. 32, 667-676. [DOI] [PubMed] [Google Scholar]
- 6.Chan-Palay, V. & Asan, E. (1989) J. Comp. Neurol. 287, 373-392. [DOI] [PubMed] [Google Scholar]
- 7.Paulus, W. & Jellinger, K. (1991) J. Neuropathol. Exp. Neurol. 50, 743-755. [DOI] [PubMed] [Google Scholar]
- 8.Hoogendijk, W. J., Pool, C. W., Troost, D., van Zwieten, E. & Swaab, D. F. (1995) Brain 118, 131-143. [DOI] [PubMed] [Google Scholar]
- 9.Zarow, C., Lyness, S. A., Mortimer, J. A. & Chui, H. C. (2003) Arch. Neurol. 60, 337-341. [DOI] [PubMed] [Google Scholar]
- 10.Langston, J. W., Forno, L. S., Tetrud, J., Reeves, A. G., Kaplan, J. A. & Karluk, D. (1999) Ann. Neurol. 46, 598-605. [DOI] [PubMed] [Google Scholar]
- 11.Przedborski, S. & Vila, M. (2001) Clin. Neurosci. Res. 1, 407-418. [Google Scholar]
- 12.Cook, D. G., Fahn, S. & Brait, K. A. (1974) Arch. Neurol. 30, 59-64. [DOI] [PubMed] [Google Scholar]
- 13.Lee, J. W. (2000) Arch. Neurol. 57, 597-599. [DOI] [PubMed] [Google Scholar]
- 14.Sofic, E., Riederer, P., Heinsen, H., Beckmann, H., Reynolds, G. P., Hebenstreit, G. & Youdim, M. B. (1988) J. Neural Transm. 74, 199-205. [DOI] [PubMed] [Google Scholar]
- 15.Dexter, D. T., Wells, F. R., Lees, A. J., Agid, F., Agid, Y., Jenner, P. & Marsden, C. D. (1989) J. Neurochem. 52, 1830-1836. [DOI] [PubMed] [Google Scholar]
- 16.Connor, J. R., Snyder, B. S., Arosio, P., Loeffler, D. A. & LeWitt, P. (1995) J. Neurochem. 65, 717-724. [DOI] [PubMed] [Google Scholar]
- 17.Zecca, L., Gallorini, M., Schunemann, V., Trautwein, A. X., Gerlach, M., Riederer, P., Vezzoni, P. & Tampellini, D. (2001) J. Neurochem. 76, 1766-1773. [DOI] [PubMed] [Google Scholar]
- 18.Zecca, L., Fariello, R., Riederer, P., Sulzer, D., Gatti, A. & Tampellini, D. (2002) FEBS Lett. 510, 216-220. [DOI] [PubMed] [Google Scholar]
- 19.Lindquist, N. G., Larsson, B. S. & Lyden-Sokolowski, A. (1988) Neurosci. Lett. 93, 1-6. [DOI] [PubMed] [Google Scholar]
- 20.D'Amato, R. J., Lipman, Z. P. & Snyder, S. H. (1986) Science 231, 987-989. [DOI] [PubMed] [Google Scholar]
- 21.Zecca, L., Zucca, F. A., Wilms, H. & Sulzer, D. (2003) Trends. Neurosci. 26, 578-580. [DOI] [PubMed] [Google Scholar]
- 22.Zecca, L., Shima, T., Stroppolo, A., Goj, C., Battiston, G. A., Gerbasi, R., Sarna, T. & Swartz, H. M. (1996) Neuroscience 73, 407-415. [DOI] [PubMed] [Google Scholar]
- 23.Zecca, L., Costi, P., Mecacci, C., Ito, S., Terreni, M. & Sonnino, S. (2000) J. Neurochem. 74, 1758-1765. [DOI] [PubMed] [Google Scholar]
- 24.Wilms, H., Rosenstiel, P., Sievers, J., Deuschl, G., Zecca, L. & Lucius, R. (2003) FASEB J. 17, 500-502. [DOI] [PubMed] [Google Scholar]
- 25.Rego, A. C., Monteiro, N. M., Silva, A. P., Gil, J., Malva, J. O. & Oliveira, C. R. (2003) J. Neurochem. 86, 792-804. [DOI] [PubMed] [Google Scholar]
- 26.Smith, M. A., Harris, P. L., Sayre, L. M. & Perry, G. (1997) Proc. Natl. Acad. Sci. USA 94, 9866-9868. [DOI] [PMC free article] [PubMed] [Google Scholar]
- 27.Shima, T., Sarna, T., Swartz, H. M., Stroppolo, A., Gerbasi, R. & Zecca, L. (1997) Free Radical Biol. Med. 23, 110-119. [DOI] [PubMed] [Google Scholar]
- 28.Connor, J. R., Boyer, P. J., Menzies, S. L., Dellinger, B., Allen, R. P., Ondo, W. G. & Earley, C. J. (2003) Neurology 61, 304-309. [DOI] [PubMed] [Google Scholar]
- 29.Fenichel, G. M. & Bazelon, M. (1968) Neurology 18, 817-820. [DOI] [PubMed] [Google Scholar]
- 30.Sulzer, D., Bogulavsky, J., Larsen, K. E., Behr, G., Karatekin, E., Kleinman, M. H., Turro, N., Krantz, D., Edwards, R. H., Greene, L. A., et al. (2000) Proc. Natl. Acad. Sci. USA 97, 11869-11874. [DOI] [PMC free article] [PubMed] [Google Scholar]
- 31.Wakamatsu, K., Fujikawa, K., Zucca, F. A., Zecca, L. & Ito, S. (2003) J. Neurochem. 86, 1015-1023. [DOI] [PubMed] [Google Scholar]
- 32.Zareba, M., Bober, A., Korytowski, W., Zecca, L. & Sarna, T. (1995) Biochim. Biophys. Acta 1271, 343-348. [DOI] [PubMed] [Google Scholar]
- 33.Zecca, L. & Swartz, H. M. (1993) J. Neural Transm. Parkinson's Dis. Dementia Sect. 5, 203-213. [DOI] [PubMed] [Google Scholar]
- 34.Zecca, L., Pietra, R., Goj, C., Mecacci, C., Radice, D. & Sabbioni, E. (1994) J. Neurochem. 62, 1097-1101. [DOI] [PubMed] [Google Scholar]
- 35.Kaur, D., Yantiri, F., Rajagopalan, S., Kumar, J., Mo, J. Q., Boonplueang, R., Viswanath, V., Jacobs, R., Yang, L., Beal, M. F., et al. (2003) Neuron 37, 899-909. [DOI] [PubMed] [Google Scholar]
- 36.Kalivendi, S. V., Kotamraju, S., Cunningham, S., Shang, T., Hillard, C. J. & Kalyanaraman, B. (2003) Biochem. J. 371, 151-164. [DOI] [PMC free article] [PubMed] [Google Scholar]
- 37.Grunblatt, E., Mandel, S. & Youdim, M. B. (2000) J. Neurol. 247, Suppl. 2, 95-102. [DOI] [PubMed] [Google Scholar]
- 38.Crichton, R. R. & Ward, R. J. (2003) Curr. Med. Chem. 10, 997-1004. [DOI] [PubMed] [Google Scholar]
- 39.Crichton, R. R., Wilmet, S., Legssyer, R. & Ward, R. J. (2002) J. Inorg. Biochem. 91, 9-18. [DOI] [PubMed] [Google Scholar]
- 40.Berg, D., Gerlach, M., Youdim, M. B., Double, K. L., Zecca, L., Riederer, P. & Becker, G. (2001) J. Neurochem. 79, 225-236. [DOI] [PubMed] [Google Scholar]
- 41.Curtis, A. R., Fey, C., Morris, C. M., Bindoff, L. A., Ince, P. G., Chinnery, P. F., Coulthard, A., Jackson, M. J., Jackson, A. P., McHale, D. P., et al. (2001) Nat. Genet. 28, 350-354. [DOI] [PubMed] [Google Scholar]
- 42.Loeffler, D. A., LeWitt, P. A., Juneau, P. L., Sima, A. A., Nguyen, H. U., DeMaggio, A. J., Brickman, C. M., Brewer, G. J., Dick, R. D., Troyer, M. D., et al. (1996) Brain Res. 738, 265-274. [DOI] [PubMed] [Google Scholar]
- 43.Blain, I., Slama, P., Giorgi, M., Tron, T. & Reglier, M. (2002) J. Biotechnol. 90, 95-112. [DOI] [PubMed] [Google Scholar]
- 44.Riederer, P., Sofic, E., Rausch, W. D., Schmidt, B., Reynolds, G. P., Jellinger, K. & Youdim, M. B. (1989) J. Neurochem. 52, 515-520. [DOI] [PubMed] [Google Scholar]
- 45.Patel, B. N., Dunn, R. J., Jeong, S. Y., Zhu, Q., Julien, J. P. & David, S. (2002) J. Neurosci. 22, 6578-6586. [DOI] [PMC free article] [PubMed] [Google Scholar]
- 46.Berg, D., Weishaupt, A., Francis, M. J., Miura, N., Yang, X. L., Goodyer, I. D., Naumann, M., Koltzenburg, M., Reiners, K. & Becker, G. (2000) Ann. Neurol. 47, 827-830. [PubMed] [Google Scholar]
- 47.Marttila, R. J., Viljanen, M., Toivonen, E., Lorentz, H. & Rinne, U. K. (1990) Adv. Neurol. 53, 141-144. [PubMed] [Google Scholar]
- 48.Saggu, H., Cooksey, J., Dexter, D., Wells, F. R., Lees, A., Jenner, P. & Marsden, C. D. (1989) J. Neurochem. 53, 692-697. [DOI] [PubMed] [Google Scholar]
- 49.Kunikowska, G. & Jenner, P. (2003) Brain Res. 968, 206-218. [DOI] [PubMed] [Google Scholar]


