Abstract
Background/Aim:
In celiac disease (CD), there is increased mRNA coding for tissue transglutaminase (tTG) and interferon gamma (IFNγ). In seronegative celiac patients, the mucosal immune complexes anti-tTG IgA/tTG are found. We assayed tTG- and IFNγ-mRNA in the mucosa of patients with a clinical suspicion of seronegative CD and correlated the values with intraepithelial CD3 lymphocytes (IELs).
Materials and Methods:
Distal duodenum specimens from 67 patients were retrieved and re-evaluated for immunohistochemically proven CD3 IELs. Five 10 μm sections were used for the extraction and assay of tTG and IFNγ coding mRNA levels using reverse transcriptase real-time polymerase chain reaction (RT-PCR). Samples from 15 seropositive CD patients and 15 healthy subjects were used as positive and negative controls. Results were expressed as fold-change.
Results:
Our series was divided into three groups based on IEL count: >25 (14 patients: group A), 15–25 (26 patients: group B), and 0–15 (27 patients: Group C). tTG-mRNA levels were (mean ± SD): CD = 9.8 ± 2.6; group A = 10.04 ± 4.7; group B = 4.99 ± 2.3; group C = 2.26 ± 0.8, controls = 1.04 ± 0.2 (CD = group A > group B > group C = controls). IFNα-mRNA levels were: CD = 13.4 ± 3.6; group A = 7.28 ± 3.6; group B = 4.45 ± 2.9; group C = 2.06 ± 1.21, controls = 1.04 ± 0.4.
Conclusions:
Our results suggest that tTG- and IFNγmRNA levels are increased in both seropositive and potential seronegative patients with CD, showing a strong correlation with the CD3 IEL count at stage Marsh 1. An increase in both molecules is found even when IELs are in the range 15–25 (Marsh 0), suggesting the possibility of a “gray zone” inhabited by patients which should be closely followed up in gluten-related disorders.
Keywords: Celiac disease, interferon gamma, intraepithelial lymphocytes, seronegative celiac disease, tissue transglutaminase
Although seronegative celiac disease (SNCD) represents a known clinical entity, it is still a diagnostic challenge. The disorder is defined by the following peculiarities: (a) Negative anti-tissue transglutaminase (tTG) IgA and anti-endomysium antibodies,[1] (b) human leukocyte antigen (HLA) compatibility (DQ2–DQ8 haplotypes) with celiac disease (CD), and c) a histological picture of the distal duodenum showing intraepithelial CD3 lymphocytes (IELs) more than 25/100 enterocytes, the so-called Marsh stage 1.[2,3] However, this remains debatable as there is evidence suggesting that only a minority of patients with an increased IEL count and negative tTG antibodies are actually affected by CD.[4,5,6]
In 2005, by immunohistochemistry, Kaukinen et al. demonstrated the possibility of finding tTG-targeted mucosal IgA immune complex deposits in the intestinal mucosa of patients with SNCD.[7] In 2008, this feature was confirmed by double immunofluorescence by Tosco et al., who showed the presence of IgA anti-tTG antibody deposits in the small intestinal mucosa of children with SNCD at Marsh stage 1.[8]
Finally, there is evidence that mRNA coding for tTG is strongly over-expressed in the mucosa of a large population of patients with CD.[9] Recently, reports by our group[10] and others[11,12] demonstrated the possibility of obtaining mRNA from paraffin-embedded biopsy samples.
Interferon gamma (IFNγ) is a pro-inflammatory cytokine that plays a crucial role in gluten-related inflammation, as it is fundamental in the amplification of the mucosal immune response,[13] increasing the gliadin flux from the intestinal lumen to the submucosa.[14] This molecule too, is over-expressed in the mucosa of subjects with CD,[15] and high levels are found in peripheral blood of subjects affected by CD, which are produced by gluten-reactive T cells.[16]
This was the rationale for the present study in subjects with a clinical suspicion of SNCD. We measured mRNA coding for tTG and IFNγ in the mucosa, in order to evaluate a possible correlation with IELs.
MATERIALS AND METHODS
Patients
We retrospectively retrieved duodenal biopsy specimens from 67 adult patients with a clinical suspicion of CD observed in the period August 2012–2013. Collection and processing had been performed according to Biospecimen Reporting for Improved Study Quality (BRISQ) recommendations.[17] Oral consent to treat and manage biological samples was obtained by phone interview. Inclusion criteria were: Diarrhea, dyspeptic symptoms, clinical and biochemical signs of malabsorption, known associated autoimmune disorders, negative serum detection of anti-tTG IgA and anti-endomysium, and positivity for CD-related HLA haplotypes. The following exclusion criteria were adopted according to the literature, to rule out other causes of duodenal injury or lymphocytosis:[2,18] Crohn's disease or ulcerative colitis, Helicobacter pylori infection, congenital and acquired immune-deficiencies (except for IgA deficit, a condition well-known to be associated with CD), intestinal bacterial overgrowth syndrome, allergy to food proteins other than gluten, connective tissue diseases, chronic non-steroidal anti-inflammatory drugs or Olmesartan intake, and intestinal infections. This last point was managed according to the American Gastroenterological Association Guidelines for both classification and specific detection of infective causes of small bowel inflammation.[19] All patients underwent a full blood count, fecal calprotectin test, evaluation of immunoglobulins, urea, glucose and lactulose breath test, skin patch test, and radioallergosorbent test (RAST) for wheat allergy. In selected cases, when an inflammatory bowel disease was suspected, a colonoscopy was performed. In all subjects, HLA haplotypes had been investigated, which yielded the following results: DQ2 HLA: 52.2%, DQ8 HLA: 20.9%, DQ2 plus DQ8: 11.9%, DQA1*0501 14.9%. All subjects were on a diet containing gluten.
Histology and immunohistochemistry
Histological examination was performed on Hematoxylin–Eosin stained sections. Immunohistochemistry of CD3 lymphocytes was performed using monoclonal murine antibody (Novocastra Leica Biosystems Ltd, Newcastle, UK), according to the manufacturer's instructions.[20,21] Samples from15 seropositive CD patients and 15 healthy subjects were used as positive and negative controls, respectively. In all subjects, IELs were counted in a field containing at least 1000 enterocytes and expressed as number per 100 enterocytes. The count was confined to the epithelial layer and performed by two observers (DP and FB) in a blinded fashion.
Molecular analysis
Reverse transcriptase real-time polymerase chain reaction (RT-PCR) can detect the expression of genes dedicated to the synthesis of a specific molecule and quantify the transcription levels. Therefore, in this study, the technique was used to detect the amount of mRNA coding for tTG2 and IFNγ. The quantity was expressed as fold-change compared to controls. The relative expression of the studied gene levels was calculated with the 2-ΔΔCT method. RNA was extracted from at least five sections of 10 µm paraffin blocks using the RNeasy FFPE Kit (Qiagen, GmbH, Heidelberg, Germany), specifically designed for the purification of total RNA from formalin-fixed paraffin-embedded (FFPE) tissue sections.[10] Although the specimens were collected in the period August 2012–2013, the RNA extraction was done within 3 months of the paraffin embedding to ensure the purity and integrity of the extracted RNA according to the Qiagen protocol. Five hundred microliters of xylene were added to the sections to yield a solution that was vortexed for 10 s and then incubated for 10 min at room temperature (25°C). Subsequently, 500 µl of absolute ethanol was added and the novel solution was again vortexed vigorously for 10 s and centrifuged for 2 min at 11,000 rpm. The supernatant was carefully removed by pipetting without disturbing the pellet. Finally, the mRNA concentrations were estimated by ultraviolet absorbance at 260/280 nm. We performed the agarose formaldehyde gel run to confirm the RNA integrity. Imaging analysis after this procedure was performed with the Bio-Rad Chemidoch Analyzer (Bio-Rad Laboratories S. r. l., Milan, Italy). Aliquots of total mRNA (1 mg) were reverse-transcribed using random hexamers and TaqMan Reverse Transcription Reagents (Applied Biosystems, Foster City, CA, USA) in a final volume of 25 µl. A series of six serial dilutions (from 20 to 0.1 ng/ml) of colon tissue DNA (cDNA) was used as template. Two-step reverse transcription PCR was performed using the first-strand cDNA with a final concentration of 1 x TaqMan gene expression assay, i. e. the analyzed molecules and glyceraldehyde-3-phosphate-dehydrogenase as reference gene (Applied Biosystems, Foster City, CA). The final reaction volume was 25 µl and analyzed in triplicate (all experiments were repeated twice). A non-template control (Rnase-free water) was included on every plate. Our method was further validated by including in each assay fresh samples from three normal patients, frozen at −90°C until the analysis. These samples were treated with the same technique as the paraffin-embedded samples, except for the paraffin removal and rehydration procedures. Specific thermal cycler conditions were employed using a real-time PCR System (Applied Biosystems). A standard curve plus validation experiment was performed for each primer/probe set. The reference gene was represented by glyceraldehydes-3- phosphate dehydrogenase. Primers and probes are reported in Table 1.
Table 1.
Primers and probes used for the assay of mRNA encoding for tissue transglutaminase 2 and interferon gamma in the intestinal mucosa of paraffin-embedded biopsy samples

Statistical analysis
Comparison among the data obtained in our groups of patients was performed by one-way analysis of variance (ANOVA) and Bonferroni's test as post-hoc analysis for continuous data. The χ2 test for trend was used to compare percentages or proportions. Correlations between IFNγ and tTG were assessed by Pearson's test. Significance was set at P < 0.05. Diagnostic agreement for the IEL count was tested by calculating the weighted k statistics coefficient interpreted in accordance with the Landis and Koch benchmarks, whereby a value of more than 0.8 indicated excellent agreement. Statistical analyses were performed using the statistical software GraphPad Prism version 5.00 for Windows (GraphPad Software, San Diego, CA, USA).
RESULTS
A total of 112 patients were retrieved and 67 satisfied the inclusion criteria, as shown in Figure 1. Demographic and clinical features of our population are reported in Tables 2 and 3, respectively. Histology demonstrated a brush border thickness reduction in 28 patients and mild villous blunting in 8 patients. Analysis of the agreement about the calculation of IELs between the observers provided k = 0.87 [95% confidence interval (CI) = 0.76–0.98].
Figure 1.
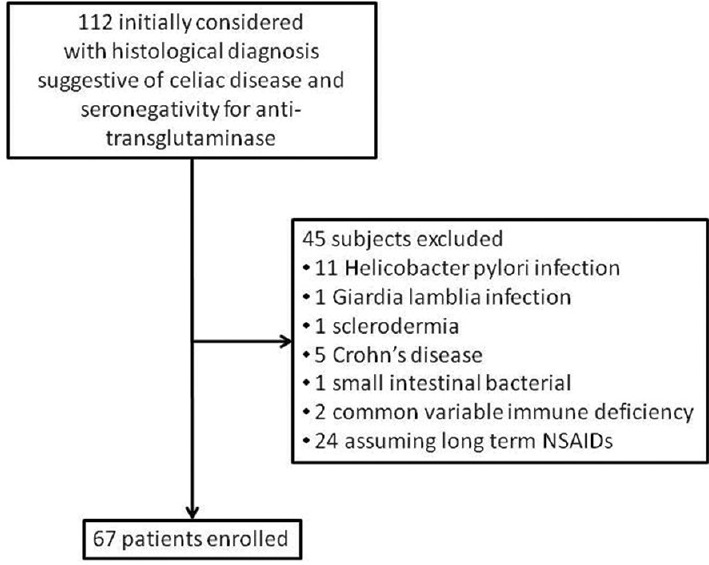
Flow diagram illustrating the study design and patient selection process
Table 2.
Demographic characteristics of the studied subjects
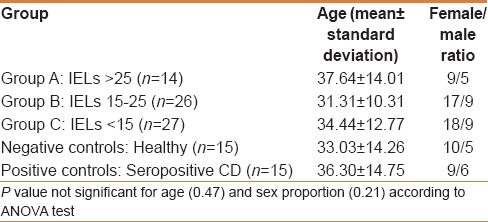
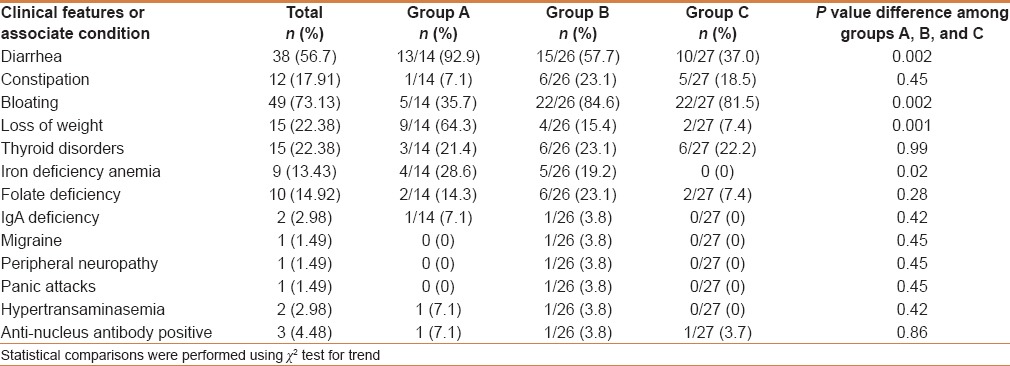
Table 3.
Clinical features of the 67 studied subjects
On the basis of the IEL count per 100 enterocytes, our study group was divided into three groups: A (14 patients): IELs >25 [Figure 2a]; B (26 patients): IELs from 15 to 25 [Figure 2b]; and C (27 patients): IELs <15 [Figure 2c]. The age (mean, range, and standard deviations) was homogeneous among the groups with no significant differences [Table 2].
Figure 2.
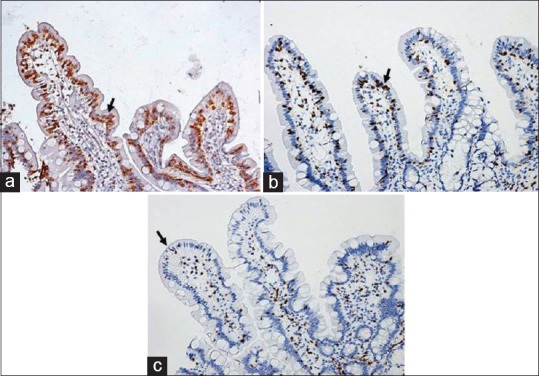
CD3 immunohistostaining in a group A patient with suspected SNCD (a) (IELs >25 per 100 enterocytes) in a group B patient (b) (IELs = 15–25 per 100 enterocytes) and (2c) in a group C. patient (IELs <15 per 100 enterocytes) Positive cells are stained brownish (diaminobenzidine – arrow) and negative cells counterstained blue (hematoxylin)
The mucosal expression of tTG-mRNA in the three groups, as well as in positive and negative controls is reported in Figure 3. In detail, group A showed similar results when compared to positive controls (9.8 ± 2.6 vs 10.04 ± 4.7), group B showed significantly higher values than negative controls (4.99 ± 2.3 vs 1.04 ± 0.2), and group C did not show differences from healthy subjects. ANOVA plus Bonferroni's test demonstrated: Positive controls = group A > group B > group C = negative controls. In conclusion, seronegative patients showed significantly increased levels of tTG in relation to a number of IELs > 15, but they paralleled the values of CD patients only in the IELs > 25 group.
Figure 3.
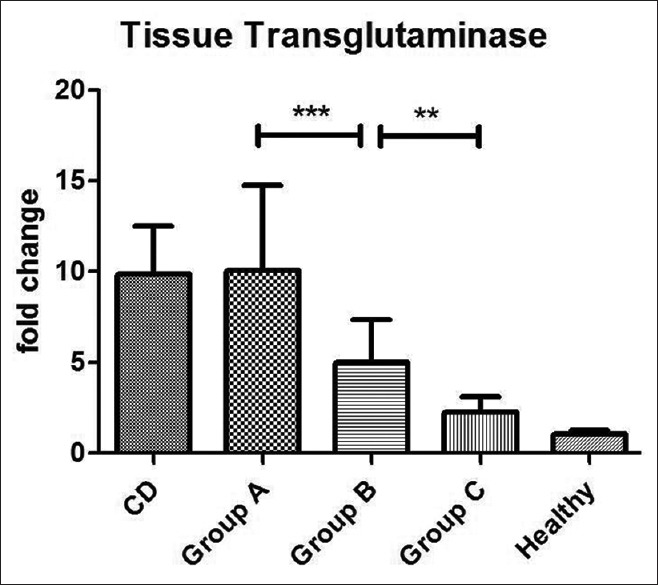
Mucosal expression of mRNA coding for tTG detected by RT-PCR and expressed as fold-change. Statistical analysis shows: positive control = group A > group B > group C = negative controls. ***P < 0.001, **P < 0.01
IFNγ-mRNA values are reported in Figure 4. In detail, group A showed higher values than groups B and C, but lower values than positive controls (13.4 ± 3.6 vs 7.28 ± 3.6), while group B showed significantly higher values than negative controls (4.45 ± 2.9) and group C did not show any differences from healthy subjects. ANOVA plus Bonferroni's test showed: Positive controls > group A > group B > group C = negative controls. In conclusion, seronegative patients showed significantly increased levels of IFNγ in relation to a number of IELs >15, but unlike the tTG values, they did not completely parallel the values of CD except in the IELs >25 group.
Figure 4.
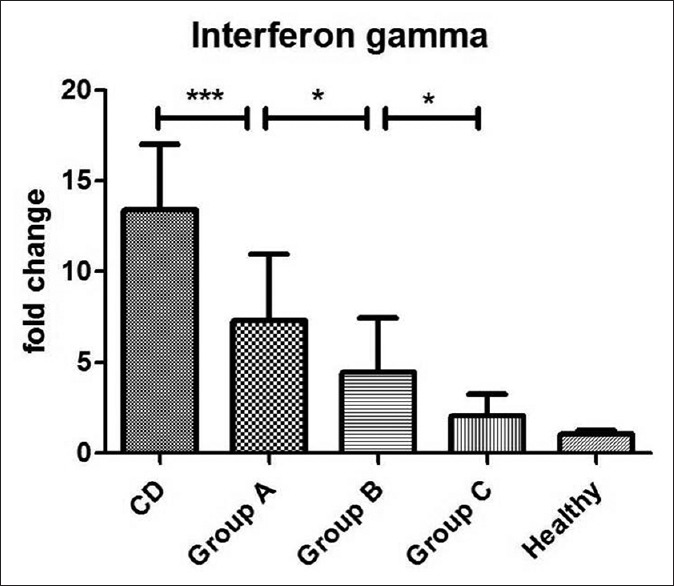
Mucosal expression of mRNA coding for IFNγ detected by RT-PCR and expressed as fold-change. Statistical analysis shows: positive control > group A > group B > group C = negative controls. ***P < 0.001; *P < 0.05
Pearson's test revealed a good positive direct correlation between IFNγ and tTG, with an r value of 0.81 (P < 0.0001). In particular, the correlation was stronger in groups A (r = 0.69; P = 0.0064) and B (r = 0.72; P < 0.0001) than in group C (r = 0.62; P = 0.0006). Figure 5 shows a scatterplot illustrating the correlation.
Figure 5.
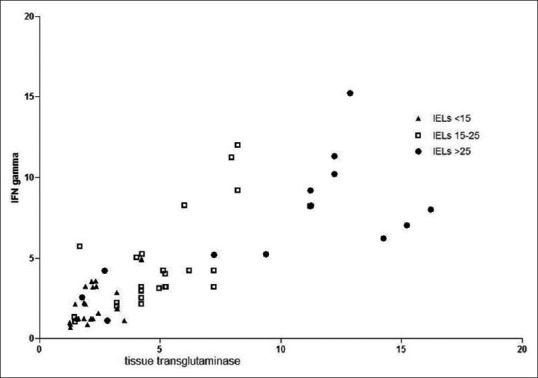
Scatterplot illustrating the relationship between tissue transglutaminase and interferon gamma. Pearson's r index and P values are illustrated in the text
DISCUSSION
SNCD is a clinically well-defined condition,[3] which may be suspected when clinical features of CD are associated with conflicting results using diagnostic tools. For these reasons, there may be some pitfalls underlying the diagnosis of SNCD, which can result in a misdiagnosis with potential dangers in the long term. Currently, histological aspects (villous damage and IEL count) associated with gluten “challenge” are the most reliable method to detect SNCD.[22] However, patients are poorly compliant to this practice because they are afraid of interrupting the gluten free diet GFD. On the other hand, in many countries, a GFD is not allowed by National Health Systems even in the presence of seropositivity in cases with a Marsh 0 and 1 histological picture. Therefore, the need for new insights into this controversial topic is evident.
In this study, we correlated immunohistochemically proven IELs (considered an appropriate diagnostic tool for doubtful CD[20,21]) with mucosal levels of mRNA coding for both tTG, which has been shown to be strongly increased in CD,[9,23,24] and IFNγ, a pro-inflammatory cytokine in gluten-induced inflammation.[23,25] Many studies in literature have demonstrated a strict correlation between IELs and serum anti-tTG antibodies.[26] However, very little evidence has correlated mucosal tTG-mRNA to IE Ls. Studies which correlated IELs to mucosal tTG have been performed only in pediatric populations[8] and, in these cases, techniques (immunohistochemistry or double immunofluorescence) other than molecular biology have been applied.
Our results show an interesting correlation between tTG-mRNA mucosal expression and the IEL count. Other studies have analyzed the protein expression in SNCD. Although a gene transcribed into mRNA does not necessarily mean that the protein is synthesized, there is evidence of a strict correlation between tTG-mRNA levels and tTG immunohistochemical expression in the intestinal mucosa.[27] Moreover, since our study was retrospectively performed on paraffin-embedded samples, we decided to apply RT-PCR as this technique is less operator-dependant than immunohistochemistry or immunofluorescence.
Our findings confirm the baseline hypothesis, i.e. the presence in SNCD of tTG-targeted mucosal IgA immune complex deposits in the intestinal mucosa, which could account for both the increased mucosal tTG expression and the lack of a serological immune response. A further clue may be found in the report of Salmi et al.,[28] who evaluated the link between the immune complex components using potassium thiocyanate and demonstrated a very strong chemical bond between antigen (tTG) and antibody (anti-tTG IgA). Therefore, it may be argued that anti-tTG could be confined to the site of production and does not pass into the systemic circulation in SNCD. A single case report confirmed this finding, demonstrating significantly higher tTG-mRNA in a patient with SNCD than in controls, and also that GFD was able to restore normal levels of duodenal tTG-mRNA.[29]
Unlike tTG, IFNγ showed a mucosal pattern characterized by an increased mucosal expression, although this did not reach that of positive controls. On the other hand, group C (IELs <15) showed a similar IFNγ pattern to negative controls, as also tTG. A possible explanation for these data might be a qualitative more than a quantitative difference in the population of IELs. Indeed, Forsberg et al.[25] have demonstrated that IELs are constituted by different subpopulations. IELγδ produce small amounts of IFNγ. A second explanation for our finding is that IFNγ levels are strongly correlated with villous atrophy.[30] Since this aspect is not marked in SNCD,[31] the moderately increased IFNγ mucosal levels in this condition could presumably be related to the mild villous degeneration. Finally, Westerholm-Ormio et al.[32] found that a moderate increase of IFNγ characterizes potential, more than overt CD and, in this case, IELs are predominantly IELγδ. The strong correlation (r = 0.81) found in our series is consistent with a report by Bayardo et al.[23] demonstrating that the expression of tTG in the intestinal mucosa is enhanced by IFNγ.
Finally, the clinical pattern of the enrolled patients, shown in Table 3, invites some interesting conclusions. In particular, subjects with a more severe IELs infiltrate more commonly suffer from diarrhea, bloating, weight loss, and iron-deficiency anemia. Thus, we may hypothesize that these symptoms may be more easily associated with SNCD. Indeed, a clinical pattern with these conditions is commonly associated with organic disorders such as CD.[33]
In conclusion, the results of this study suggest the following points:
Patients with IELs <15 per 100 enterocytes may be considered non-celiac
Patients with IELs >25 per 100 enterocytes may be considered celiac even if mainly Marsh stage 1, and with a doubtful indication for a GFD
Patients with IEL values between 15 and 25 per 100 enterocytes may be considered to inhabit a “gray zone,” in which there may be both very mild and potential forms of CD[22]
Mucosal expression of tTG and IFNγ detected by RT-PCR in paraffin-embedded biopsy samples may offer, in the near future, a synergic tool supporting the IEL count in doubtful cases of SNCD.
A final mention should be made of the dispute about whether patients with a histological picture of Marsh 1 should be put on a GFD diet.[34] Leffler et al.[35] have recently emphasized the ineffectiveness of a GFD in this group of subjects. However, another study[36] demonstrated that normalization of IELs is obtained after a GFD in patients with both Marsh 1 and Marsh 2 histological picture, and this is associated with an improvement of the symptoms. Our aim was to explore the molecular pathways of CD in patients with the clinical suspicion of a seronegative form of the disorder and did not aim to provide clear therapeutic indications. However, this study suggests that the submerged part of the CD “iceberg” should be paid more attention. Indeed, rather than exploring the effects of a GFD in group A and B subjects, which could be expensive and not covered by our National Health System, we believe that these patients should be seriously considered for closer follow-up in order to detect an increased predisposition to develop CD.
Footnotes
Source of Support: Nil
Conflict of Interest: None declared.
REFERENCES
- 1.Rostom A, Murray JA, Kagnoff MF. American Gastroenterological Association (AGA) Institute technical review on the diagnosis and management of celiac disease. Gastroenterology. 2006;131:1981–2002. doi: 10.1053/j.gastro.2006.10.004. [DOI] [PubMed] [Google Scholar]
- 2.Dickson BC, Streutker CJ, Chetty R. Coeliac disease: An update for pathologists. J Clin Pathol. 2006;59:1008–16. doi: 10.1136/jcp.2005.035345. [DOI] [PMC free article] [PubMed] [Google Scholar]
- 3.Abrams JA, Diamond B, Rotterdam H, Green PH. Seronegative celiac disease: Increased prevalence with lesser degrees of villous atrophy. Dig Dis Sci. 2004;49:546–50. doi: 10.1023/b:ddas.0000026296.02308.00. [DOI] [PubMed] [Google Scholar]
- 4.Mahadeva S, Wyatt JI, Howdle PD. Is a raised intraepithelial lymphocyte count with normal duodenal villous architecture clinically relevant? J Clin Pathol. 2002;55:424–8. doi: 10.1136/jcp.55.6.424. [DOI] [PMC free article] [PubMed] [Google Scholar]
- 5.Kakar S, Nehra V, Murray JA, Dayharsh GA, Burgart LJ. Significance of intraepithelial lymphocytosis in small bowel biopsy samples with normal mucosal architecture. Am J Gastroenterol. 2003;98:2027–33. doi: 10.1111/j.1572-0241.2003.07631.x. [DOI] [PubMed] [Google Scholar]
- 6.Biagi F, Bianchi PI, Campanella J, Badulli C, Martinetti M, Klersy C, et al. The prevalence and the causes of minimal intestinal lesions in patients complaining of symptoms suggestive of enteropathy: A follow-up study. J Clin Pathol. 2008;61:1116–8. doi: 10.1136/jcp.2008.060145. [DOI] [PubMed] [Google Scholar]
- 7.Kaukinen K, Peräaho M, Collin P, Partanen J, Woolley N, Kaartinen T, et al. Small-bowel mucosal transglutaminase 2-specific IgA deposits in coeliac disease without villous atrophy: A prospective and randomized clinical study. Scand J Gastroenterol. 2005;40:564–72. doi: 10.1080/00365520510023422. [DOI] [PubMed] [Google Scholar]
- 8.Tosco A, Maglio M, Paparo F, Rapacciuolo L, Sannino A, Miele E, et al. Immunoglobulin A anti-tissue transglutaminase antibody deposits in the small intestinal mucosa of children with no villous atrophy. J Pediatr Gastroenterol Nutr. 2008;47:293–8. doi: 10.1097/MPG.0b013e3181677067. [DOI] [PubMed] [Google Scholar]
- 9.Esposito C, Paparo F, Caputo I, Porta R, Salvati VM, Mazzarella G, et al. Expression and enzymatic activity of small intestinal tissue transglutaminase in celiac disease. Am J Gastroenterol. 2003;98:1813–20. doi: 10.1111/j.1572-0241.2003.07582.x. [DOI] [PubMed] [Google Scholar]
- 10.Ierardi E, Giorgio F, Rosania R, Zotti M, Prencipe S, Della Valle N, et al. Mucosal assessment of tumor necrosis factor alpha levels on paraffined samples: A comparison between immunohistochemistry and real time polymerase chain reaction. Scand J Gastroenterol. 2010;45:1007–8. doi: 10.3109/00365521.2010.483739. [DOI] [PubMed] [Google Scholar]
- 11.Ribeiro-Silva A, Zhang H, Jeffrey SS. RNA extraction from ten year old formalin-fixed paraffin-embedded breast cancer samples: A comparison of column purification and magnetic bead-based technologies. BMC Mol Biol. 2007;21(8):118. doi: 10.1186/1471-2199-8-118. [DOI] [PMC free article] [PubMed] [Google Scholar]
- 12.Bohmann K, Hennig G, Rogel U, Poremba C, Mueller BM, Fritz P, et al. RNA extraction from archival formalin-fixed paraffin-embedded tissue: A comparison of manual, semiautomated, and fully automated purification methods. Clin Chem. 2009;55:1719–27. doi: 10.1373/clinchem.2008.122572. [DOI] [PubMed] [Google Scholar]
- 13.Manavalan JS, Hernandez L, Shah JG, Konikkara J, Naiyer AJ, Lee AR, et al. Serum cytokine elevations in celiac disease: Association with disease presentation. Hum Immunol. 2010;71:50–7. doi: 10.1016/j.humimm.2009.09.351. [DOI] [PubMed] [Google Scholar]
- 14.Bethune MT, Siegel M, Howles-Banerji S, Khosla C. Interferon-gamma released by gluten-stimulated celiac disease-specific intestinal T cells enhances the transepithelial flux of gluten peptides. J Pharmacol Exp Ther. 2009;329:657–68. doi: 10.1124/jpet.108.148007. [DOI] [PMC free article] [PubMed] [Google Scholar]
- 15.Sapone A, Lammers KM, Casolaro V, Cammarota M, Giuliano MT, De Rosa M, et al. Divergence of gut permeability and mucosal immune gene expression in two gluten-associated conditions: Celiac disease and gluten sensitivity. BMC Med. 2011;9:23. doi: 10.1186/1741-7015-9-23. [DOI] [PMC free article] [PubMed] [Google Scholar]
- 16.Ontiveros N, Tye-Din JA, Hardy MY, Anderson RP. Ex-vivo whole blood secretion of interferon (IFN)-γ and IFN-γ-inducible protein-10 measured by enzyme-linked immunosorbent assay are as sensitive as IFN-γ enzyme-linked immune spot for the detection of gluten-reactive T cells in human leucocyte antigen (HLA)-DQ2·5(+) –associated coeliac disease. Clin Exp Immunol. 2014;175:305–15. doi: 10.1111/cei.12232. [DOI] [PMC free article] [PubMed] [Google Scholar]
- 17.Moore HM, Kelly AB, Jewell SB, McShane LM, Clark DP, Greenspan R, et al. Biospecimen Reporting for improved study quality (BRISQ) Cancer Cytopathol. 2011;119:92–101. doi: 10.1002/cncy.20147. [DOI] [PubMed] [Google Scholar]
- 18.Elli L, Bergamini CM, Bardella MT, Schuppan D. Transglutaminases in inflammation and fibrosis of the gastrointestinal tract and the liver. Dig Liver Dis. 2009;41:541–50. doi: 10.1016/j.dld.2008.12.095. [DOI] [PubMed] [Google Scholar]
- 19.American Gastroenterological Association medical position statement: Guidelines for the evaluation and management of chronic diarrhea. Gastroenterology. 1999;116:1461–3. doi: 10.1016/s0016-5085(99)70512-3. [DOI] [PubMed] [Google Scholar]
- 20.Mino M, Lauwers GY. Role of lymphocytic immunophenotyping in the diagnosis of gluten-sensitive enteropathy with preserved villous architecture. Am J Surg Pathol. 2003;27:1237–42. doi: 10.1097/00000478-200309000-00007. [DOI] [PubMed] [Google Scholar]
- 21.Settakorn J, Leong AS. Immunohistologic parameters in minimal morphologic change duodenal biopsies from patients with clinically suspected gluten-sensitive enteropathy. Appl Immunohistochem Mol Morphol. 2004;12:198–204. doi: 10.1097/00129039-200409000-00003. [DOI] [PubMed] [Google Scholar]
- 22.Ludvigsson JF, Leffler DA, Bai JC, Biagi F, Fasano A, Green PH, et al. The Oslo definitions for coeliac disease and related terms. Gut. 2013;62:43–52. doi: 10.1136/gutjnl-2011-301346. [DOI] [PMC free article] [PubMed] [Google Scholar]
- 23.Bayardo M, Punzi F, Bondar C, Chopita N, Chirdo F. Transglutaminase 2 expression is enhanced synergistically by interferon-γ and tumour necrosis factor-α in human small intestine. Clin Exp Immunol. 2012;168:95–104. doi: 10.1111/j.1365-2249.2011.04545.x. [DOI] [PMC free article] [PubMed] [Google Scholar]
- 24.Kim SY, Jeong EJ, Steinert PM. IFN-gamma induces transglutaminase 2 expression in rat small intestinal cells. J Interferon Cytokine Res. 2002;22:677–82. doi: 10.1089/10799900260100169. [DOI] [PubMed] [Google Scholar]
- 25.Forsberg G, Hernell O, Hammarström S, Hammarström ML. Concomitant increase of IL-10 and pro-inflammatory cytokines in intraepithelial lymphocyte subsets in celiac disease. Int Immunol. 2007;19:993–1001. doi: 10.1093/intimm/dxm077. [DOI] [PubMed] [Google Scholar]
- 26.Walker MM, Murray JA, Ronkainen J, Aro P, Storskrubb T, D’Amato M, et al. Detection of celiac disease and lymphocytic enteropathy by parallel serology and histopathology in a population-based study. Gastroenterology. 2010;139:112–9. doi: 10.1053/j.gastro.2010.04.007. [DOI] [PMC free article] [PubMed] [Google Scholar]
- 27.D’Argenio G, Calvani M, Della Valle N, Cosenza V, Di Matteo G, Giorgio P, et al. Differential expression of multiple transglutaminases in human colon: Impaired keratinocyte transglutaminase expression in ulcerative colitis. Gut. 2005;54:496–502. doi: 10.1136/gut.2004.049411. [DOI] [PMC free article] [PubMed] [Google Scholar]
- 28.Salmi TT, Collin P, Korponay-Szabó IR, Laurila K, Partanen J, Huhtala H, et al. Endomysial antibody-negative coeliac disease: Clinical characteristics and intestinal autoantibody deposits. Gut. 2006;55:1746–53. doi: 10.1136/gut.2005.071514. [DOI] [PMC free article] [PubMed] [Google Scholar]
- 29.Montenegro L, Piscitelli D, Giorgio F, Covelli C, Fiore MG, Losurdo G, et al. Reversal of IgM deficiency following a after gluten-free diet in a seronegative celiac disease. World J Gastroenterol. 2014;20:17686–9. doi: 10.3748/wjg.v20.i46.17686. [DOI] [PMC free article] [PubMed] [Google Scholar]
- 30.Kontakou M, Sturgess RP, Przemioslo RT, Limb GA, Nelufer JM, Ciclitira PJ. Detection of interferon gamma mRNA in the mucosa of patients with coeliac disease by in situ hybridisation. Gut. 1994;35:1037–41. doi: 10.1136/gut.35.8.1037. [DOI] [PMC free article] [PubMed] [Google Scholar]
- 31.Tursi A, Brandimarte G, Giorgetti GM. Prevalence of antitissue transglutaminase antibodies in different degrees of intestinal damage in celiac disease. J Clin Gastroenterol. 2003;36:219–21. doi: 10.1097/00004836-200303000-00007. [DOI] [PubMed] [Google Scholar]
- 32.Westerholm-Ormio M, Garioch J, Ketola I, Savilahti E. Inflammatory cytokines in small intestinal mucosa of patients with potential coeliac disease. Clin Exp Immunol. 2002;128:94–101. doi: 10.1046/j.1365-2249.2002.01798.x. [DOI] [PMC free article] [PubMed] [Google Scholar]
- 33.Iwańczak B, Matusiewicz K, Iwańczak F. Clinical picture of classical, atypical and silent celiac disease in children and adolescents. Adv Clin Exp Med. 2013;22:667–73. [PubMed] [Google Scholar]
- 34.Ierardi E, Losurdo G, Piscitelli D, Giorgio F, Sorrentino C, Principi M, et al. Seronegative celiac disease: Where is the specific setting? Gastroenterol Hepatol Bed Bench. 2015;8:110–6. [PMC free article] [PubMed] [Google Scholar]
- 35.Leffler D, Vanga R, Mukherjee R. Mild enteropathy celiac disease: A wolf in sheep's clothing? Clin Gastroenterol Hepatol. 2013;11:259–61. doi: 10.1016/j.cgh.2012.11.005. [DOI] [PubMed] [Google Scholar]
- 36.Tursi A, Brandimarte G. The symptomatic and histologic response to a gluten-free diet in patients with borderline enteropathy. J Clin Gastroenterol. 2003;36:13–7. doi: 10.1097/00004836-200301000-00006. [DOI] [PubMed] [Google Scholar]


