Figure 2.
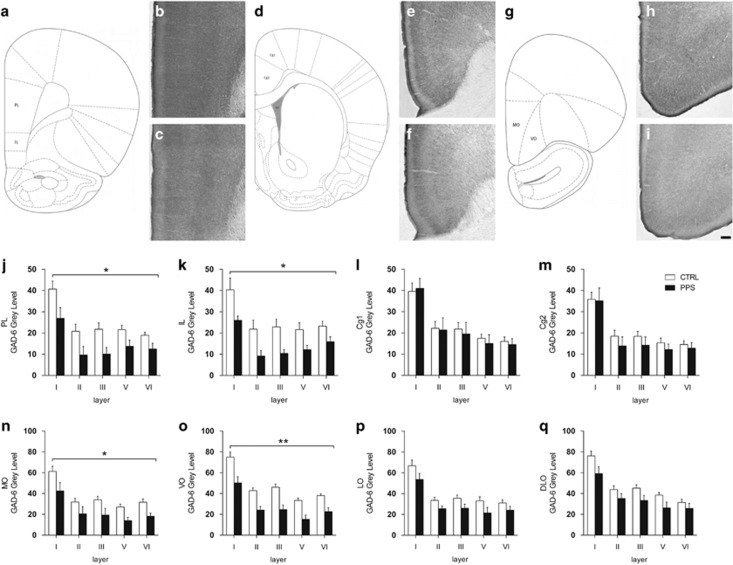
Effects of peripubertal stress on the expression of glutamic acid decarboxylase 65/67 (GAD-6) in the prefrontal cortex during adulthood. Schematic diagram of the prelimbic and infralimbic regions (a) and representative photomicrographs of these regions for CTRL (b) and PPS (c) animals. d depicts the cingulate cortex 1 and 2, while e and f depict representative images for the cingulate cortex from CTRL and PPS animals, respectively. The schematic diagram of the medial orbitofrontal and ventral orbitofrontal cortices is shown in g, and photomicrographs of the GAD-6 expression for these regions are depicted for CTRL (h) and PPS (i) animals. A significant decrease of GAD protein was observed across the layers of the prelimbic (j) and infralimbic (k) subregions of the medial PFC of PPS animals as compared with CTRL. (l, m) No differences were observed between the groups for data from cingulate 1 (l) and cingulate 2 (m) cortex. (n and o) A reduction of GAD-6 immunoreactivity was observed in PPS rats at the level of the medial orbitofrontal (n) and ventral orbitofrontal (o) cortices. (p and q) A tendency toward GAD-6 protein reduction was observed in the lateral orbitofrontal (p) and dorsolateral orbitofrontal (q) cortex of PPS animals in comparison to CTRL rats. Scale bar, 100 μm. N: CTRL=8–9, PPS=5–6. *p<0.05, **p<0.01, main effect of stress, results are expressed as the mean±SEM. CTRL, control; PFC, prefrontal cortex; PPS, peripubertally stressed.

