

Abstract
Transcatheter aortic valve replacements (TAVRs) are a percutaneous alternative to surgical aortic valve replacements and are used to treat patients with aortic valve stenosis. This minimally invasive procedure relies on expansion of the TAVR stent to radially displace calcified aortic valve leaflets against the aortic root wall. However, these calcium deposits can impede the expansion of the device causing distortion of the valve stent and pericardial tissue leaflets. The objective of this study was to elucidate the impact of eccentric TAVR stent distortion on the dynamic deformation of the tissue leaflets of the prosthesis in vitro. Dual-camera stereophotogrammetry was used to measure the regional variation in strain in a leaflet of a TAVR deployed in nominal circular and eccentric (eccentricity index = 28%) orifices, representative of deployed TAVRs in vivo. It was observed that (i) eccentric stent distortion caused incorrect coaptation of the leaflets at peak diastole resulting in a ‘peel-back’ leaflet geometry that was not present in the circular valve and (ii) adverse bending of the leaflet, arising in the eccentric valve at peak diastole, caused significantly higher commissure strains compared with the circular valve in both normotensive and hypertensive pressure conditions (normotension: eccentric = 13.76 ± 2.04% versus circular = 11.77 ± 1.61%, p = 0.0014, hypertension: eccentric = 15.07 ± 1.13% versus circular = 13.56 ± 0.87%, p = 0.0042). This study reveals that eccentric distortion of a TAVR stent can have a considerable impact on dynamic leaflet deformation, inducing deleterious bending of the leaflet and increasing commissures strains, which might expedite leaflet structural failure compared to leaflets in a circular deployed valve.
Keywords: transcatheter aortic valve replacement, distortion, eccentric, stent, self-expanding, leaflets
1. Introduction
Aortic valve stenosis (AS) is a degenerative disease of the aortic valve that is characterized by progressive thickening and calcification of the leaflets and thus narrowing of the valve orifice [1]. Transcatheter aortic valve replacement (TAVRs) is a percutaneous alternative to surgical aortic valve replacement (SAVR), which is used to treat intermediate and high-risk operable patient cohorts [1–3]. TAVRs consist of pericardial tissue leaflets sutured to a collapsible metallic stent. Unlike traditional SAVR, wherein the leaflets of the stenotic aortic valve are removed prior to device implantation, the procedure relies on the expansion of the TAVR stent to radially displace the calcified aortic valve leaflets against the aortic root wall and thus provides a landing zone for the prosthetic valve in the aortic annulus [1,4].
Calcium deposits present on the aortic valve can vary in size, density and distribution and can inhibit the expansion of TAVR stents. This can lead to distortion of the device from its desired circular geometry, with eccentric stent expansion reported in various self-expanding TAVR designs in vivo [5–10]. In the CoreValve (Medtronic, USA), Schultz et al. [5] reported incomplete and non-uniform expansion at all levels of the stent, which was exacerbated at the inflow section due to conformance with the calcified aortic valve. Furthermore, only 17% of deployed stents were considered circular, thereby indicating the high prevalence of non-circular deployment [5,11]. Binder et al. reported eccentric stent expansion of the self-expanding Centera (Edwards Lifesciences, USA) at the inflow level of the stent with eccentricity values of 18.7 ± 10.9% recorded [7]. Zegdi et al. reported that asymmetric stent expansion occurred in one-third of patients with calcified tricuspid aortic valves [9] and was further exacerbated when deployed in bicuspid valves [10]. Willson et al. reported acute valve dysfunction with an intermittent frozen leaflet occurring in the self-expanding Portico (St Jude Medical, USA) caused by eccentric stent distortion at the inflow and mid-section of the stent [8].
We have previously reported that eccentric distortion can alter the flow characteristics through a TAVR, causing an altered asymmetric systolic jet formation, increased shear stresses and turbulence in flow fields downstream of the valve [12]. It has also been proposed that stent distortion can have a negative impact on the pericardial tissue leaflets of a TAVR specifically that non-circular stent expansion might lead to leaflet distortion, strain concentrations at the commissures of the leaflet and incorrect valve closure [5,9], albeit these changes have yet to be quantified. As strain concentrations have been shown to be a factor in causing structural failure of the leaflet [13,14], increased deformation at the commissure regions of the leaflet might have long-term detrimental effects on leaflet fatigue durability. In fact, distortion of bioprosthetic heart valves (BHVs) during the surgical implantation procedure in animal studies has led to accelerated deterioration and calcification of the pericardial leaflets [15–17]. Leaflets in distorted stents in both self-expanding and balloon expandable TAVRs have been observed to have increased tautness, reduced mobility and inadequate coaptation (due to buckling and coaptation mismatch) at valve closure [6,7,9,18]. While we have previously shown that stent distortion may increase the haemolytic response of the valve [12], the impact of this distorted stent geometry on the dynamic deformation of the leaflets compared to leaflets in an optimal circular expanded stent remains to be fully understood.
Finite-element (FE) simulations have been used to quantify leaflet deformation in models representative of non-circular self-expanding TAVRs in vivo. Sun et al. [19] simulated a trileaflet geometry and showed that eccentric leaflet configurations experienced higher peak stresses in the leaflet commissures compared with circular leaflet configurations. Gunning et al. [20] simulated leaflet closure in a complete TAVR stent/leaflet assembly deployed in a realistic patient-specific aortic root model, and demonstrated that leaflet buckling and coaptation mismatch can occur during leaflet closure in non-circular deployed self-expanding valves. These computational models used a quasi-static approach to simulate valve closure, by applying a static and a uniformly distributed transvalvular pressure directly to the leaflet surface. The ‘water hammer’ effect caused by dynamic blood flow induced loading of the leaflet cannot be reproduced using a quasi-static method and as a result peak stresses may be underestimated compared to dynamic models [13]. Additionally, assuming a uniformly distributed transvalvular pressure boundary condition may underestimate the impact of stent distortion on leaflet closing mechanics. This may be particularly relevant at the leaflet free edge during leaflet coaptation, which has been shown to be critical in simulated mitral valve closure in structural only (FE) and fluid–structure interaction simulations [21]. Therefore, the impact of stent distortion on leaflet deformation, while incorporating the dynamic pulsatile and spatially varying loading conditions on the leaflet due to fluid flow interaction, has yet to be elucidated.
Dual-camera stereophotogrammetry is a non-intrusive optical-based method that has been applied to experimentally quantify leaflet strains in physiological and pathological models of native aortic valves [22]. Previous studies have applied this method and another optical-based method (structured light projection) to quantify leaflet deformation in circular deployed BHVs, correlating regions of elevated surface curvature [23,24] and strain concentrations [25] to the regions that were expectedly and most prone to structural deterioration. Sun et al. [25] used dual-camera stereophotogrammetry to investigate leaflet strains near the leaflet–stent attachment in a BHV under quasi-static loading conditions and demonstrated that peak strains occurred in the vicinity of the leaflet commissures. However, Sun et al. [25] focused on BHVs, whereby surgical implantation allows for optimal circular implantation of the prosthesis. Thus, the effect of a distorted stent geometry on leaflet deformation was not investigated and is not yet known.
In this study, we investigate the impact of non-circular stent deployment on the dynamic deformation of leaflets of a TAVR using dual-camera stereophotogrammetry. The objectives of this study are to: (i) deploy a TAVR in nominal circular and eccentric orifice experimental models and simulate pulsatile flow under pathological and physiological pressure conditions and (ii) experimentally quantify regional leaflet strain distribution in circular and eccentric TAVRs using the dual-camera stereophotogrammetry imaging technique.
2. Material and methods
2.1. Valve and aortic root model
A 23 mm supra-annular TAVR representative of a commercial valve design was studied (n = 3) [12], consisting of bovine pericardial leaflets (thickness = 0.35 mm) sutured to a self-expanding Nitinol valve stent with a dedicated commissure post assembly and inflow segment [12,26]. The TAVR used was representative of supra-annular valve designs whereby the valvular section of the device was located distally to the inflow section that is used to anchor the device in the calcified aortic annulus. A regular array of tissue dye markers with a 1 mm grid spacing was applied using tissue marking dye (Black Shandon Tissue Marking Dye, Thermoelectron Corporation, Pittsburgh, PA, USA) to the aortic surface of the leaflets using a template placed behind the leaflet as reference (figure 1a,b). Valves were deployed into two aortic annulus models: a circular control annulus (22 mm in diameter) and an eccentric geometry (Dmin = 18.7 mm, Dmax = 25.8 mm) with an eccentricity index (EI) of 28% (EI = (1 − Dmin/Dmax)) (figure 1c,d), representative of highly eccentric explanted and in vivo TAVRs from CT imaging [5,6]. Both circular and eccentric orifices were constructed such that the cross-sectional orifice areas were the same. Aortic annulus models were mated with a custom-built idealized acrylic aortic root model based on clinical measurements [27,28] consisting of a straight rigid ascending aorta section developing into an axisymmetric sinus region (figure 2a,b). Valve deployment was carried out as per the instructions of use. Once the supra-annular portion of the valve stent was positioned correctly in the aortic root model, lateral expansion of the inflow segment of the stent into the aortic root annulus was performed such that the radiopaque markers present on the stent were lined up with the aortic annulus plane. Paravalvular leakage was mitigated through the use of a sealant around the valve circumference.
Figure 1.

(a) Schematic of the marker array being applied to the leaflet with a template as reference, (b) TAVR leaflet with a 1 × 1 mm marker array on the aortic side of the leaflet (stent removed for clarity) and inflow morphologies of (c) circular and (d) eccentric deployed TAVRs with a diameter of 22 mm and an EI of 28%, respectively. (Online version in colour.)
Figure 2.

(a) Axial view schematic of the axisymmetric aortic root and aortic annulus models showing the position of cameras 1 and 2 at 22.5° from the central axis of the valve chamber and (b) side view showing the position of cameras 30° to the vertical axis. Note the orientation of the imaged leaflet (highlighted in red), which is perpendicular to the major axis of the eccentric geometry of the deployed valve stent. (Online version in colour.)
2.2. Pulsatile left heart simulator
The aortic root assembly was connected to the Georgia Tech Left Heart Simulator (LHS), which has previously been used to simulate impaired and physiological haemodynamic conditions of aortic, mitral and TAVRs valves in an in vitro test set-up [22,29,30]. The pulsatile flow loop consisted of a fluid reservoir, a mechanical mitral valve, a bladder pump, an acrylic valve chamber, and compliance and resistance elements [22,29]. Ventricular function was simulated using a bladder pump driven by compressed air and solenoid valves. As the aortic root model was rigid, arterial distensibility was reproduced using a lumped systemic compliance chamber, which was used to simulate normotensive (120/80 mmHg) and hypertensive (190/150 mmHg) pressure conditions with a heart rate of 70 beats min−1 and a cardiac output (CO) of 5 l min−1 [22,29]. CO and aortic and ventricular pressures were measured at 500 Hz using a custom Labview program. A blood analogue fluid of 36% water/glycerin solution was used in the experiments to simulate blood at a kinematic viscosity of 3.51 × 10⁻⁶ m2 s−1 (3.5 cSt) and minimize optical distortion during imaging [22,29]. Figure 3a,b shows the resultant normotensive and hypertensive pressure waveforms acquired, which are similar to those observed in previous in vitro studies of native valves and TAVRs [22,29] and are also in accordance with ISO standards for testing of cardiac valve prostheses (ISO 5840—Cardiovascular implants—Cardiac valve prostheses III) [31]. Figure 3c shows the images acquired from the aortic side with time points indicated in figure 3a.
Figure 3.

Haemodynamic waveforms including ventricular pressure (red line), aortic pressure (green line) and flow rate (blue dashed line) at a CO of 5 l min−1 under (a) normotensive (120/80 mmHg) and (b) hypertensive (190/150 mmHg) pressure conditions. (c) Raw images of leaflet deformation at time points A–F as indicated in (a) (stent removed for clarity). (Online version in colour.)
2.3. Dual-camera stereophotogrammetry
Dual-camera stereophotogrammetry was used to acquire high-speed images of the TAVR leaflet and measure dynamic deformation, similar to previous experiments performed for native aortic and mitral valves [22,30] and BHV types [25]. Dynamic motion of the marker dots on the aortic side of the TAVR leaflets was captured at 500 frames per second using an image grabbing system (EPIX CL3SD, Buffalo Grove, IL, USA) with two high-speed cameras (Basler A504 K, Basler) orientated at 22.5° to the horizontal and 30° to the vertical, as shown in figure 2a,b. Marker dots were imaged on the leaflet perpendicular to the major axis of the eccentric orifice as highlighted (figure 2a). The two CCD cameras created two simultaneous images of the deforming aortic leaflet (figure 4a,b). The marker array on the leaflet surface was tracked from the stereo image pairs acquired using a previously developed automatic marker tracking algorithm in Matlab (Mathworks, Natwick, MA, USA) [22,30].
Figure 4.

Marker array on the aortic surface of the leaflets as viewed from camera (a) 2 and (b) 1. The superimposed black-shaded areas illustrate where strains were computed (a) in the leaflet coaptation region (zones 1–6) and (b) in the leaflet commissures. The central axis of the valve is denoted by the dashed line. (c) Three-dimensional reconstruction of the marker array at the reference configuration from raw images (a) and (b) with associated elements and nodal connectivity used for major principal strain computation. (Online version in colour.)
Using direct linear transformation (DLT), two-dimensional pixel coordinates of each marker dot from the stereo image pairs were reconstructed into three-dimensional space. Prior to surface reconstruction, DLT calibration was carried out by traversing a calibration target (10 × 12 mm) through a distance of 12.3 mm from the centre of the valve assembly, which resolved the relative angle between the two cameras, and was then used to compute the three-dimensional spatial coordinates of the leaflet markers. The three-dimensional coordinates of the leaflet markers were determined to have an accuracy of 68 µm based upon the magnification of the high-speed cameras, pixel size and calibration target [32].
2.3.1. Strain computation
Shell-based two-dimensional isoparametric shape functions were used to produce a discretized surface geometry with the reconstructed dots as element vertices, which were used to compute the major principal strain in the leaflet at relevant time points in the cardiac cycle. A 3 × 3 marker array was used to fit each C-0 continuous nine-node Lagrangian shape function, thus generating a surface mesh of the leaflet. Coordinates of a point within the region governed by the element was obtained by interpolating the shape functions terms at the nodes as follows:
| 2.1 |
The shape functions were then used to compute the metric tensor, G [22,30,33]:
| 2.2 |
where the subscript, k, indicates the component of the Cartesian coordinates (x, y, z) and subscripts (α, β) indicate differentiation with respect to the in-surface coordinate component (ξ or η). Components of the metric tensor, G, were then used to compute the Green strain, E [22,30,33]:
| 2.3 |
where  and Gαβ are components of the metric tensor in the deformed configuration and reference configuration, respectively [22,30,33].
Major principal strains were calculated in six zones of the coaptation region (figure 4a) and two zones in the commissure regions of the leaflet (figure 4b). Strains in each zone were computed by fitting the Langrangian shape function to a nine node subset (3 × 3) of the 45 nodes (15 × 3) on the leaflet surface, giving one shape function for each zone. For the commissure regions, nine node subsets at the extremity of the marker array were used as shown in figure 4b.
A surface mesh of the reconstructed leaflet is shown in figure 4c. As the marker spacing was 1 mm, each zone was approximately 4 mm2 in area. The central axis of the valve was located between zones 3 and 4 (figure 4a,b) and bisects the valve into two sides, with the left side of the leaflet represented by zones 1, 2 and 3 and the right side represented by 4, 5 and 6. Images of the leaflet in a coaptated configuration, arising when the aortic and ventricular pressures were allowed to equilibrate giving a small (2–8 mmHg) transvalvular pressure across the valve, were used as the reference configuration for strain computation as shown in figure 4a,b.
2.4. Haemodynamic evaluation
Haemodynamic performance of the valves was evaluated using the mean transvalvular pressure gradient (TVG) and effective orifice area (EOA). The TVG was calculated as the mean pressure gradient (ΔPmean) across the valve for the duration of systole and was calculated as follows:
| 2.4 |
where Pvent and Paortic are the pressures in millimetres of mercury taken immediately upstream and downstream of the valve, respectively. EOA valves were calculated using the following equation:
where QRMS is the root mean square of the measured flow and ΔPmean is calculated as in equation (2.4).
2.5. Statistical analysis
Strain and haemodynamic measurements were computed for three valves (n = 3). For strain measurements, values were recorded at five consecutive cardiac cycles giving a total of 15 readings (5 readings × 3 valves) for strain measurement in each area of interest in the leaflet unless otherwise specified. Results are expressed as mean ± s.d. For haemodynamic measurements, values were acquired over 15 cardiac cycles and then averaged to get representative data for circular and eccentric deployed valves. Data were analysed for normality using the Anderson Darling test in MINITAB (v. 16, Minitab Ltd, Coventry, UK). If data exhibited normality, Student's t-test was used to determine statistical differences between strain and haemodynamic measurements. Otherwise, the non-parametric Mann–Whitney test was used to determine statistical differences between non-normal distributed variables. Statistical significance was defined as p ≤ 0.05.
3. Results
3.1. Haemodynamics
Figure 5a shows the mean TVG during systole for both valve geometries at normotensive and hypertensive pressure conditions. No significant differences in the TVG between each valve geometry at each pressure condition was obtained (normotension: circular = 6.25 ± 0.75 mmHg versus eccentric = 6.87 ± 0.98 mmHg, p = 0.87, hypertension: circular = 4.46 ± 0.97 mmHg versus eccentric = 4.92 ± 1.27 mmHg, p = 0.94). Figure 5b shows the EOA for each valve geometry at both pressure conditions. No significant differences in the EOA between both valve geometries at each pressure condition were observed (normotension: circular = 2.07 ± 0.16 cm2 versus eccentric = 1.97 ± 0.09 cm2, p = 0.86, hypertension: circular = 2.6 cm2 ± 0.25 cm2 versus eccentric = 2.45 ± 0.35 cm2, p = 0.95).
Figure 5.
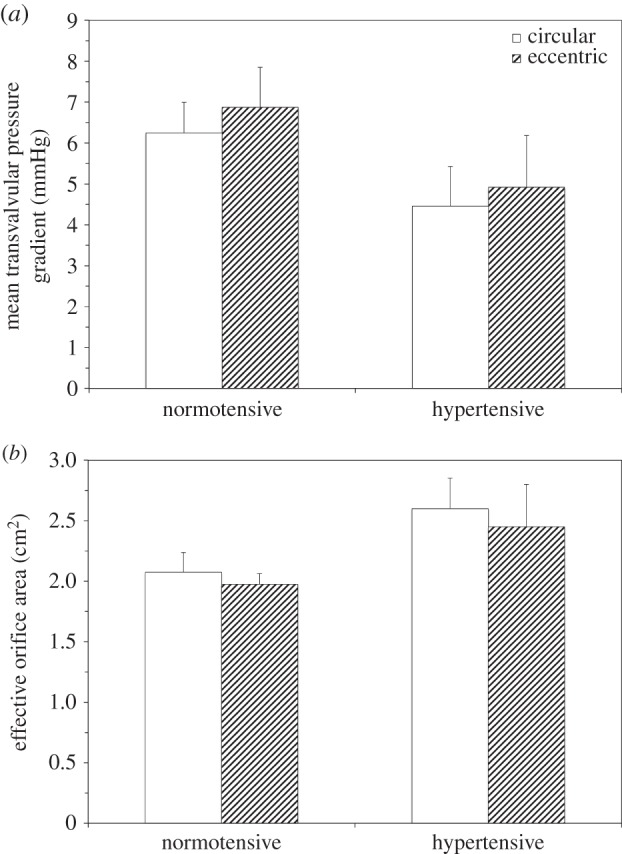
Mean TVG (a) and EOA (b) measurements of circular and eccentric valves under normotensive and hypertensive pressure conditions. Values are mean ± s.d. for n = 3. *p < 0.05 compared at the same pressure condition.
3.2. Overall leaflet deformation characteristics
Figures 6 and 7 show the three-dimensional reconstruction of the imaged leaflet of the circular and eccentric valves at specific time points under normotensive pressure conditions. Leaflet deformation characteristics during valve opening were qualitatively similar for both valve geometries (circular and eccentric), whereby the leaflet undergoes a smooth transition from closed to fully open (0–120 ms in figures 6 and 7). Leaflet opening occurred initially from the basal region leading to the free edge. While opened, minor changes in the leaflet geometry occurred due to fluctuations in the pulsatile flow. Rapid closure of the leaflets starts to occur at the initial transient phase of diastole and ends at peak diastole within a time period of approximately 10 ms for both valves (figures 6 and 7, 390–400 ms). Following peak diastole, the flexible commissure posts of the valve stent acted as a cushioning mechanism allowing the leaflet to be momentarily relieved of strains (figures 6 and 7, 416 ms) prior to reloading and retrograde axial movement of the leaflet, as shown at 440 ms in figures 6 and 7. Similar leaflet deformation characteristics were observed under hypertensive pressure conditions for both valve geometries, with increased leaflet movement in the axial direction at diastole due to an increase in pressure on the leaflet surface (190 versus 120 mmHg).
Figure 6.

Three-dimensional reconstruction of the sequence of leaflet motion in the circular valve from axial (looking into the flow) and isometric viewpoints. Peak systole and peak diastole occur at 300 and 400 ms, respectively.
Figure 7.

Three-dimensional reconstruction of leaflet motion in the eccentric valve from axial (looking into the flow) and isometric viewpoints. Peak systole and peak diastole occur at 300 and 400 ms, respectively.
3.3. Leaflet deformation characteristics at peak diastole
Valve closure characteristics were observed to be associated with stent deployment geometry (figure 8a,b). In the circular valve at peak diastole (400 ms), anticlockwise twisting of the leaflets around the central axis occurred and resulted in pinwheeling of the valve (figure 8a). In the eccentric valve at peak diastole (400 ms), coaptation mismatch of the valve leaflets was observed at valve closure resulting in backwards bending of the leaflet from the belly region in the retrograde direction of flow causing a characteristic ‘peel-back’ leaflet geometry (figure 8b).
Figure 8.

Imaged leaflet at (a) and (b) peak diastole and at (c) and (d) 20 ms after peak diastole for circular and eccentric valves, respectively. Images demonstrate valve closure characteristics at peak diastole, with pinwheeling of the leaflet in the (a) circular valve and retrograde bending causing leaflet ‘peel-back’ in the (b) eccentric valve. (d) Solid and dashed lines represent the relative position of the free edges of the imaged leaflet (solid line) and the underlying leaflet (dashed line) in the eccentric valve demonstrating coaptation mismatch.
Following peak diastole (440 ms), pinwheeled and ‘peeled-back’ geometries were temporarily removed due to flexure of the commissure posts (figure 8c,d). However, a difference was observed in relative coaptation heights between leaflets of the eccentric valve, resulting in mismatch of the leaflet free edges and one leaflet being trapped under the adjacent imaged leaflet (indicated by dashed and solid lines, respectively) that did not occur in the circular valve (figure 8d). Following the momentary relief of strains caused by flexion of the commissure posts, coaptation mismatch occurred between the opposing leaflets in the eccentric valve.
3.4. Effect of stent distortion on leaflet commissure strains
Figure 9 shows the peak major principal strains computed from the commissure regions of the valve leaflets at peak diastole under normotensive and hypertensive pressure conditions. At normotensive pressure conditions, a statistically significant increase in peak commissure strain was observed in the eccentric valve compared with the circular valve (13.76 ± 2.04% versus 11.77 ± 1.61%, p = 0.014). Under hypertensive pressure conditions a similar trend was observed, with a statistically significant increase in commissure strain in the leaflets of the eccentric valve compared with the circular valve (15.07 ± 1.13% versus 13.56 ± 0.87%, p = 0.0042). For the circular valve, the commissure strain was statistically significantly higher in the hypertensive condition compared with the normotensive condition (13.56 ± 0.87% versus 11.77 ± 1.61%, p = 0.0003). Similarly, the commissure strain was also higher in the eccentric valve at hypertension compared with normotension, however this difference was not statistically significant (15.07 ± 1.13% versus 13.76 ± 2.04%, p = 0.146).
Figure 9.
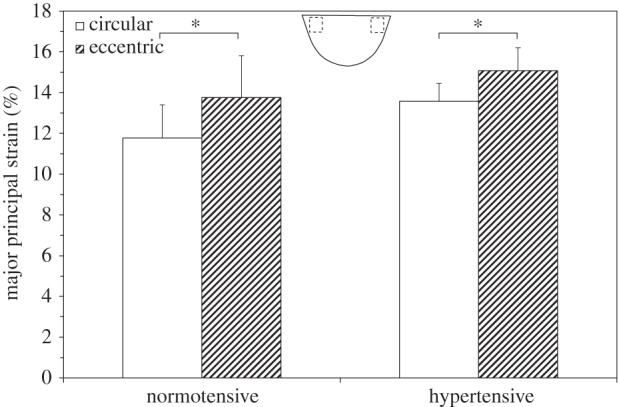
Peak major principal strain recorded in the leaflet commissures in circular and eccentric valves under normotensive and hypertensive pressure conditions. Location of strain measurements is indicated. Values are mean ± s.d. for n = 3. *p < 0.05 compared at the same time point.
3.5. Effect of stent distortion on leaflet strain distribution
Figure 10 is a comparison of the major principal strain distribution in the coaptation region in circular and eccentric valves under normotensive pressure conditions at mid (figure 10a) and late (figure 10b) diastole. Statistically significant differences in strain in circular and eccentric valves were found in zones 1, 3 and 5 at mid diastole under normotensive pressure conditions (figure 10a). In zones 1 and 5, the eccentric valve had a statistically significant higher strain than that of the same zone in the circular valve (zone 1 = 10.92 ± 1.36% versus 9.64 ± 1.10%, p = 0.007, zone 5 = 8.40 ± 2.15% versus 5.06 ± 1.37%, p = 0.0004). By contrast, zone 3 of leaflets in the circular valve had statistically significant higher strain than that of the same zone in leaflets in the eccentric valve (8.11 ± 1.52% versus 4.90 ± 3.04%, p = 0.006). In the remaining zones (2, 4 and 6), statistically significant differences in strain with valve geometry did not occur: zone 2 (7.58 ± 1.54% versus 6.85 ± 1.45%, p = 0.171), zone 4 (3.63 ± 2.76% versus 1.92 ± 1.64%, p = 0.089) and zone 6 (9.37 ± 3.44% versus 8.61 ± 3.1%, p = 0.74). At late diastole under normotensive pressure conditions (figure 10b), a similar trend was observed, however strain magnitudes decreased in each region due to the decrease in the TVG and thus the pressure acting on the surface of the valve. Statistically significant differences in leaflet strain between circular and eccentric valves remained in zone 3 (6.88 ± 2.72% versus 4.54 ± 2.51%, p = 0.0345) and zone 5 (5.92 ± 2.35% versus 3.73 ± 1.11%, p = 0.006). However, the difference in zone 1 was no longer significant (8.71 ± 2.05% versus 8.56 ± 1.25%, p = 0.648).
Figure 10.

Regional major principal strain distribution across the coaptation region of the leaflet at (a) mid and (b) late diastole under normotensive pressure conditions. Values are ±s.d. for n = 3. Statistical significance (p ≤ 0.05) of zones within the same geometry (circular or eccentric) at the same time point (mid or late diastole) is indicated as follows: ‘a’ indicates significance from zone 1, ‘b’ from zone 2, ‘c’ from zone 3, ‘d’ from zone 4, ‘e’ from zone 5. *p ≤ 0.05 circular versus eccentric at the same time point.
For hypertensive conditions at mid diastole, regional major principal strains were increased due to the increased pressure acting on the valve. Under hypertensive pressure conditions at mid diastole (figure 11a), the eccentric valve had statistically significantly higher strains in zones 1 (12.19 ± 2.23% versus 9.39 ± 1.76%, p = 0.0048) and 5 (9.52 ± 3.13% versus 5.61 ± 1.24%, p = 0.007) compared with the same zone in the circular valve. In zone 3, strains were significantly higher in the circular valve compared with the eccentric valve (7.52 ± 0.43% versus 5.39 ± 3.14%, p = 0.0008). In the remaining zones, strains were observed to be higher in the eccentric valve compared with the circular valve although these were not statistically significant: zone 2 (9.18 ± 2.22% versus 8.05 ± 1.04%, p = 0.319), zone 4 (2.97 ± 2.22% versus 2.14 ± 2.89%, p = 0.311) and zone 6 (11.0 ± 3.96% versus 9.8 ± 2.47%, p = 0.198). At late diastole under hypertensive pressure conditions (figure 11b), statistically significantly higher strains were observed in the eccentric valve in zones 1 (10.70 ± 1.19% versus 8.31 ± 1.13%, p = 0.0001), 4 (3.21 ± 2.37% versus 1.59 ± 2.18%, p = 0.0476) and 5 (7.91 ± 2.85% versus 5.10 ± 1.56%, p = 0.018).
Figure 11.

Regional major principal strain distribution across the coaptation region of the leaflet at mid (a) and late (b) diastole under hypertensive pressure conditions. Values are ±s.d. for n = 3. Statistical significance (p ≤ 0.05) of zones within the same geometry (circular or eccentric) at the same time point (mid or late diastole) is indicated as follows: ‘a’ indicates significance from zone 1, ‘b’ from zone 2, ‘c’ from zone 3, ‘d’ from zone 4, ‘e’ from zone 5. *p ≤ 0.05 circular versus eccentric at the same time point. Note: unequal sample sizes for zones 3 and 4 were used (circular 15 strain measurements, eccentric 13 strain measurements).
3.6. Spatial variation in leaflet strain distribution
Statistical differences in major principal strains between each zone of the leaflets within circular and eccentric valve geometries for normotensive and hypertensive pressure conditions are indicated in figures 10 and 11, respectively. Major principal strains can be characterized as heterogeneous across the coaptation surface of the leaflets of both circular and eccentric valves with peak strains occurring closest to the commissures of the leaflet (zones 1 and 6), which decreased towards the central region of the leaflet (zones 2,3,4,5) (figures 10 and 11).
In addition to the heterogeneity in strain distribution observed, a distinct asymmetric strain pattern was also observed around the central axis of the valve chamber in the circular valve that was not present in the eccentric valve. At mid and late diastole, under normotensive pressure conditions, major principal strains were statistically significantly higher in zone 3 (left side of leaflet) than in zone 4 (right side of leaflet; p < 0.05; figure 10a,b). No statistically significant difference was observed between the same zones in the eccentric valve at the same pressure condition. Under hypertensive pressure conditions, this asymmetric strain pattern was observed in both valve geometries.
4. Discussion
This study provides a novel insight into the effect of eccentric stent deployment on the regional dynamic deformation of the pericardial tissue leaflets of a TAVR. The results of this study demonstrated that eccentric stent distortion caused coaptation mismatch of the leaflet free edges during valve closure, which resulted in leaflet ‘peel-back’ at peak diastole. The altered closing characteristics caused significantly higher peak major principal strain in the commissure regions of the leaflet compared with that of the same region in the leaflet in the circular valve. For both valve geometries, a heterogeneous strain distribution was observed across the leaflet. The strains were significantly greater in zones at the extremity of the coaptation region in the vicinity of the leaflet commissures compared with zones located nearer the central region of the leaflet. It was demonstrated that the pinwheeling in the circular valve produced an asymmetric strain pattern around the central axis of the valve, which produced a significant difference in strain magnitudes in zones either side of the centre of the leaflet, which was not observed in the leaflets of the eccentric valve at normotensive pressures. The findings of this study provide an important insight into the dynamic strains in the leaflet of a distorted TAVR at the annular plane in vivo. The increased loading at the leaflet commissures due to distortion of the TAVR stent geometry could potentially accelerate leaflet deterioration and lower the long-term leaflet durability of the leaflets of the prosthesis.
The optical transparency required in order to image the complex leaflet deformation of the prosthesis necessitated the use of a geometrically simplified and rigid material behaviour of the aortic root model. The rigid aortic root does not represent the compliant behaviour of the aortic root tissue or undergo the pulsatile changes in annulus shape that occur in vivo [12,34]. However, calcium deposits [35], age-related reduced arterial compliance [36] in patients requiring TAVRs, and the scaffolding provided by over-sizing of the valve stent may reduce compliance and dimensional changes of the aortic root during TAVR of stenotic valves in vivo and as such a rigid model was deemed a reasonable assumption. Owing to the rigidity of the aortic root model however, a non-physiological and exaggerated dicrotic notch was present in the aortic pressure waveform. Despite this, the relative pressure gradient between the aortic and ventricular pressure waveforms were consistent for normotensive and hypertensive pressures at valve closure [7–9] and thereby represent the in vivo leaflet-loading pressures at each pressure condition.
The aortic root phantoms used did not include native aortic valve leaflets due to the challenges in reproducing a calcified aortic valve and a predefined eccentric expanded stent geometry representative of in vivo TAVR deployment geometries from CT imaging. Exclusion of a calcified valve model allows for more uniform and circular stent expansion at the outflow segment of the valve and thereby may underestimate the degree of stent distortion at the commissural levels of the leaflets, which may further exacerbate strain concentrations in this region. Although the straight ascending aorta is not representative of the curved aorta in three-dimensional space, the valve studied had a short profile and does not interact with the ascending aorta beyond the sinotubular junction where the curved portion arises and thus the straight ascending aorta was deemed appropriate.
Only one orientation of the valve within the eccentric orifice was studied, which was chosen as it has previously been shown to exacerbate the altered leaflet deformations compared to other orientations within eccentric orifices [19]. Only one leaflet (leaflet perpendicular to the major axis of the eccentric orifice) in the tri-leaflet assembly was investigated as visualizing more than one leaflet in a single plane was not possible. This leaflet was chosen as it has previously been shown to undergo altered deformation and lack of coaptation during valve closure under hydrodynamic test conditions and elicited abnormal leaflet tautness in an eccentric deployed explanted prosthesis [6,37]. Despite this, the increased commissure strains reported here could be exacerbated in other leaflets and as such future studies are required to elucidate the impact of stent distortion on other leaflets of the TAVR. Strain measurements were limited to the coaptation region and near the commissures regions of the leaflet due to the presence of the valve stent and leaflet folding during valve closure, which hindered the visualization of markers near the stent attachment and the basal region of the leaflet in both cameras. It is expected that regions of commissure closer to the leaflet–stent attachment line will experience larger localized strains, which are likely to be further exacerbated by stent distortion. It should also be noted that strains could not be computed in the central region of the eccentric leaflet at peak diastole due to leaflet ‘peel-back’. While positioning of the cameras orthogonal to the leaflet surface (instead of at 30°) would allow for imaging of this area, simultaneous marker visualization on the rest of the leaflet surface was not feasible due to the presence of the stent. Three TAVR samples were used to provide a comparative analysis between stent geometry and pressure conditions. While more TAVR samples would have improved the statistical robustness of our findings, the inherent difficulty and expense associated with obtaining valves manufactured to a clinical standard did not make this possible.
The TAVR used in this study is a supra-annular design, wherein the valvular portion is distal to the inflow segment of the valve. In such designs non-circular expansion at the inflow portion of the valve stent, owing to contact with the calcified aortic valve, is minimized at the valvular portion [12]. In intra-annular balloon-expandable (e.g. Sapien) and self-expanding (e.g. Portico, Centera) TAVRs, the valvular portion of the device is in the same plane as that of the anchoring region in contact with the calcified valve. In such designs, distortion to the stent is directly translated to the leaflets and thus leaflet distortion would be expected to be exacerbated in intra-annular balloon-expandable and self-expanding TAVRs compared to the results of the supra-annular design reported here [12].
Previous studies have shown that calcific- and non-calcific-related structural deteriorations of BHV leaflets (circular implanted) are caused by high tensile strains in the commissure region of the leaflet, which can cause tearing, laceration and calcification [38–40]. As expected, the findings of our experimental study are similar to existing knowledge from computational models of BHVs and have shown that strains are the highest in the commissure regions of the TAVR leaflets also [25]. The major principal strains in the commissures of the circular TAVR studied here were in close agreement to both experimentally measured and FE simulated major principal strains using FE analysis by Sun et al. [25] in the same region of a BHV (11.77 ± 1.61% versus approx. 11%) sutured to a circular annulus model under quasi-static loading conditions. Similar to the simulated leaflet closure in eccentric and asymmetric geometries by Sun et al. [19] and Gunning et al. [20], this study showed that peak leaflet strains increased in the eccentric geometry. However, the relative increase in peak strains experimentally reported here were lower than that observed in simulated leaflet models (17 versus 143%). In the FE simulations, peak strains were recorded directly at the valve commissures. Owing to the presence of the valve stent and leaflet folding, visualization of the leaflet markers and strain characterization was not possible in this study and was carried out further away from the commissure edges where the effect of stent distortion on leaflet strain concentrations is less pronounced. Furthermore, the stent model used in this study had flexible commissure posts compared to the rigid static commissure posts used in these simulations. The flexible commissure post acts as a cushioning mechanism during valve closure promoting dissipation of the mechanical pressure acting at the leaflet surface and as such reduces the peak strain concentrations in the commissures of the valve [41].
The results of this study demonstrated that coaptation of the valve leaflets was dependent on deployed stent geometry, with the circular valve producing a pinwheeled leaflet geometry. In contrast, the eccentric valve experienced incorrect leaflet coaptation resulting in a ‘peel-back’ leaflet geometry. Pinwheeling in the circular valve was characterized as a anticlockwise twisting of the leaflet at coaptation. In the eccentric valve, retrograde bending of the leaflet free edge occurred as it interacted with the diastolic closing pressure in the aorta resulting in the characteristic ‘peel-back’ geometry at peak diastole [37]. This ‘peel-back’ leaflet geometry has previously been observed in high-speed imaging of distorted TAVR leaflets during haemodynamic testing [37]. We propose that this ‘peel-back’ effect may play a role in the higher peak commissure strains in the leaflet of the eccentric valve observed here. However, it must be stated that positioning of the cameras orthogonal to the leaflet surface and computation of the direction of the principal strains in this region is required in order to further evaluate this. With the exception of zone 3, located next to the central axis of the valve, differences in leaflet strain were significantly greater in the leaflet of the eccentric valves compared with the circular valves. The elevated strains in this region (zone 3) in the circular valve were caused by the pinwheeling produced around the central axis at leaflet coaptation. A similar trend was observed moving radially outwards from the central axis, however, the difference between corresponding zones on the left and right sides of the leaflet was not significant.
Pinwheeling has previously been stated as one of the major mechanisms of failure in circular BHVs, causing early fatigue failure in the Ionescu–Shiley valve compared with the Perimount valve (Edwards), which has demonstrated 18 year durability with no pinwheeling [42]. Pinwheeling is inherently a size factor issue of self-expanding TAVRs, arising from the limited range of valve sizes (21–29 mm) available for treatment of the wide ranging aortic annuli sizes. The leaflet free edges must be designed to be sufficiently long to seal the valve during closure without a central gap forming. However, when the valve is oversized for the patient-specific orifice the excessively long free edges of the leaflet must pinwheel in order to complete coaptation. In this study, a 23 mm valve was modelled in a 22 mm nominal orifice causing pinwheeling to be produced resulting in a asymmetric strain distribution on the leaflet. FE fatigue simulations of BHVs have predicted that pinwheeling might induce early fatigue damage at the leaflet free edges [41]. The experimentally quantified strains in the circular valve corroborate knowledge from existing visual inspections and fatigue computational simulations of pinwheeled BHVs and further elucidate the impact of pinwheeling on the regional leaflet strain distribution under dynamic loading conditions.
The results reported here reveal that eccentric deployment can cause approximately a 2% increase in peak commissure strains in the leaflets of a TAVR stent. This change in strain is sufficient to produce a large increase in leaflet stress, as pericardium is a nonlinear and hyperelastic material composed of collagenous fibres, which undergoes significant stiffening following fibre uncrimping and orientation to the axis of stretch. Based on the stress–strain relationship derived from previous equibiaxial testing results of thin pericardial tissue [2], an approximate increase in peak stress from 390 to 700 kPa would be expected in the leaflet in the eccentric valve at normotension due to a 2% increase in strain at the leaflet commissures.
Previous studies have used uniaxial testing to investigate the impact of moderate cyclic loading on the fatigue response of pericardial tissue [43,44]. It has been reported that the tissue compliancy of pericardial tissue reduced with increasing cycle number (up to 65 × 106 cycles) when subjected to cyclic uniaxial stress of 0.5 ± 0.05 MPa (approx. 12% strain) caused by reduction in collagen fibre crimp and reorientation of fibres towards to the direction of loading [44]. It has also been shown that cyclic loading (up to 65 × 106 cycles) at a higher uniaxial strain of 16% (approx. 1 MPa peak stress) [43] increased the extensibility of pericardial tissue at moderate cyclic numbers in the parallel and perpendicular axes of the tissue with respect to the direction of loading [43]. In our study, the peak commissure strains observed in leaflets of both circular and eccentric geometries under both normotensive (11.77 ± 1.61% versus 13.76 ± 2.04%) and hypertensive (13.76 ± 2.04% versus 15.07 ± 1.13%) pressure conditions were within the range of cyclic loads applied in these fatigue studies [43,44]. We propose that the increased commissure strains in the eccentric valve may accelerate structural deterioration caused by reduction in collagen fibre crimp and fibre reorientation [43,44]. However, it must be stated that these strains were computed under multiaxial loading conditions and as such may be different to the uniaxial tensile fatigue conditions tested by Sun et al. [17] and Sellaro et al. [18]. Furthermore, the increased peak strains in the commissure regions of the eccentric leaflets may accelerate calcification in this region. This has been seen in previous studies of distorted implantation of BHVs, whereby distortion of the prosthesis during implantation led to incidences of premature leaflet tearing and accelerated fibrosis and calcification in the distorted valve leaflets due to increased loading conditions [16,17]. We propose that similar processes could be triggered following the eccentric deployment of a TAVR and as such premature leaflet failure may be more likely compared with that of a circular deployed valve.
TAVR manufacturers are required to perform standardized hydrodynamic testing to assess the haemodynamic, structural performance and device durability of TAVR stents using experimental models that represent deployed valves in calcified annuli in vivo (ISO 5840). These standards require qualitative visual inspection to assess the occurrence of incorrect coaptation, folding and pinwheeling, structural deterioration and delamination, which are evaluated on a pass/fail basis. The quantitative assessment of the changes in tissue extensibility due to stent distortion provided in this study could be incorporated to improve standardized test methods so that they can account for the effect of eccentric stent deployment on the regional dynamic deformation of bioprosthetic tissue leaflets.
5. Conclusion
The effect of eccentric stent deployment on dynamic leaflet deformation of the pericardial tissue leaflets of a TAVR was investigated for the first time. Dual-camera stereophotogrammetry was used to compute strains in the coaptation and commissure regions of select TAVR leaflets indicating that: (i) pinwheeling of the circular valve plays a role in producing an asymmetric leaflet strain pattern that was not observed in the eccentric valve at normotension and (ii) adverse bending of the leaflet (‘peel-back’) at peak diastole led to statistically higher commissure strains in the eccentric valve compared with the circular valve. These results indicate that eccentric stent deployment impacts pericardial leaflet deformation that may cause deleterious bending of the leaflet in the belly region. This produced increased leaflet commissure strains that may lead to accelerated leaflet deterioration compared with leaflets of nominally circular deployed valves.
Acknowledgements
The authors would like to acknowledge Andrew W. Siefert for his insight into manuscript generation, Fiona E. Freeman and Conleth A. Mullen for their assistance with statistical analysis and the Georgia Tech Research Institute (GTRI) machine shop for manufacturing the acrylic models used in this study.
Authors' contribution
All the authors participated in research design, acquisition, analysis and interpretation of data, critical revision, approval of the submitted and final versions; and read and approved the final manuscript.
Competing interests
We declare we have no competing interests.
Funding
This study was funded by the Science Foundation Ireland Short Term Travel Fellowship Award, a National University of Ireland Galway (NUI Galway) College of Engineering and Informatics Fellowship and the Wallace H. Coulter endowment fund to A.P.Y.
References
- 1.Padala M, Sarin EL, Willis P, Babaliaros V, Block P, Guyton RA, Thourani VH. 2010. An engineering review of transcatheter aortic valve technologies. Cardiovasc. Eng. Technol. 1, 77–87. ( 10.1007/s13239-010-0008-4 [DOI] [Google Scholar]
- 2.Li K, Sun W. 2010. Simulated thin pericardial bioprosthetic valve leaflet deformation under static pressure-only loading conditions: implications for percutaneous valves. Ann. Biomed. Eng. 38, 2690–2701. ( 10.1007/s10439-010-0009-3) [DOI] [PubMed] [Google Scholar]
- 3.Smuts AN, Blaine DC, Scheffer C, Weich H, Doubell AF, Dellimore KH. 2010. Application of finite element analysis to the design of tissue leaflets for a percutaneous aortic valve. J. Mech. Behav. Biomed. Mater. 4, 85–98. ( 10.1016/j.jmbbm.2010.09.009) [DOI] [PubMed] [Google Scholar]
- 4.Clavel MA, et al. 2009. Comparison of the hemodynamic performance of percutaneous and surgical bioprostheses for the treatment of severe aortic stenosis. J. Amer. College Cardiol, 53, 1883–1891. ( 10.1016/j.jacc.2009.01.060) [DOI] [PubMed] [Google Scholar]
- 5.Schultz CJ, et al. 2009. Geometry and degree of apposition of the CoreValve ReValving system with multislice computed tomography after implantation in patients with aortic stenosis. J. Amer. College Cardiol. 54, 911–918. ( 10.1016/j.jacc.2009.04.075) [DOI] [PubMed] [Google Scholar]
- 6.Cavero MA, et al. 2012. Prognostic implications of asymmetric morphology in transcatheter aortic valve implantation: a case report. Revista Española de Cardiología (english version) 65, 104–105. [DOI] [PubMed] [Google Scholar]
- 7.Binder RK, et al. 2013. Transcatheter aortic valve replacement with a new self-expanding transcatheter heart valve and motorized delivery system. JACC: Cardiovasc. Interv. 6, 301–307. ( 10.1016/j.jcin.2013.01.129) [DOI] [PubMed] [Google Scholar]
- 8.Willson AB, et al. 2012. Transcatheter aortic valve replacement with the St. Jude medical portico valve: first-in-human experience. J. Amer. College Cardiol. 60, 581–586. ( 10.1016/j.jacc.2012.02.045) [DOI] [PubMed] [Google Scholar]
- 9.Zegdi R, Ciobotaru V, Noghin M, Sleilaty G, Lafont A, Latrémouille C, Deloche A, Fabiani J-N. 2008. Is it reasonable to treat all calcified stenotic aortic valves with a valved stent? Results from a human anatomic study in adults. J. Amer. College Cardiol. 51, 579–584. ( 10.1016/j.jacc.2007.10.023) [DOI] [PubMed] [Google Scholar]
- 10.Zegdi R, Lecuyer L, Achouh P, Didier B, Lafont A, Latrémouille C, Fabiani J-N. 2010. Increased radial force improves stent deployment in tricuspid but not in bicuspid stenotic native aortic valves. Ann. Thoracic Surg. 89, 768–772. ( 10.1016/j.athoracsur.2009.12.022) [DOI] [PubMed] [Google Scholar]
- 11.Tseng EE, Wisneski A, Azadani AN, Ge L. 2013. Engineering perspective on transcatheter aortic valve implantation. Interv. Cardiol. 5, 53–70. ( 10.2217/ica.12.73) [DOI] [Google Scholar]
- 12.Gunning PS, Saikrishnan N, McNamara LM, Yoganathan AP. 2014. An in vitro evaluation of the impact of eccentric deployment on transcatheter aortic valve hemodynamics. Ann. Biomed. Eng. 42, 1195–1206. ( 10.1007/s10439-014-1008-6) [DOI] [PubMed] [Google Scholar]
- 13.Sun W, Martin C, Pham T. 2014. Computational modeling of cardiac valve function and intervention. Annu. Rev. Biomed. Eng. 16, 53–76. ( 10.1146/annurev-bioeng-071813-104517) [DOI] [PMC free article] [PubMed] [Google Scholar]
- 14.Chandran KB. 2010. Role of computational simulations in heart valve dynamics and design of valvular prostheses. Cardiovasc. Eng. Technol. 1, 18–38. ( 10.1007/s13239-010-0002-x) [DOI] [PMC free article] [PubMed] [Google Scholar]
- 15.Willson AB, et al. 2012. Structural integrity of balloon-expandable stents after transcatheter aortic valve replacement: assessment by multidetector computed tomography. JACC: Cardiovasc. Interv. 5, 525–532. ( 10.1016/j.jcin.2012.03.007) [DOI] [PubMed] [Google Scholar]
- 16.Mohammadi S, Baillot R, Voisine P, Mathieu P, Dagenais F. 2006. Structural deterioration of the Freestyle aortic valve: mode of presentation and mechanisms. J. Thoracic Cardiovasc. Surg. 132, 401–406. ( 10.1016/j.jtcvs.2006.03.056) [DOI] [PubMed] [Google Scholar]
- 17.Van Nooten G, Ozaki S, Herijgers P, Segers P, Verdonck P, Flameng W. 1999. Distortion of the stentless porcine valve induces accelerated leaflet fibrosis and calcification in juvenile sheep. J. Heart Valve Dis. 8, 34–41. [PubMed] [Google Scholar]
- 18.Kuetting M, Sedaghat A, Utzenrath M, Sinning J-M, Schmitz C, Roggenkamp J, Werner N, Schmitz-Rode T, Steinseifer U. 2014. In vitro assessment of the influence of aortic annulus ovality on the hydrodynamic performance of self-expanding transcatheter heart valve prostheses. J. Biomech. 47, 957–965. ( 10.1016/j.jbiomech.2014.01.024) [DOI] [PubMed] [Google Scholar]
- 19.Sun W, Li K, Sirois E. 2010. Simulated elliptical bioprosthetic valve deformation: implications for asymmetric transcatheter valve deployment. J. Biomech. 43, 3085–3090. ( 10.1016/j.jbiomech.2010.08.010) [DOI] [PubMed] [Google Scholar]
- 20.Gunning PS, Vaughan TJ, McNamara LM. 2014. Simulation of self expanding transcatheter aortic valve in a realistic aortic root: implications of deployment geometry on leaflet deformation. Ann. Biomed. Eng. 42, 1989–2001. ( 10.1007/s10439-014-1051-3) [DOI] [PubMed] [Google Scholar]
- 21.Lau KD, Diaz V, Scambler P, Burriesci G. 2010. Mitral valve dynamics in structural and fluid–structure interaction models. Med. Eng. Phys. 32, 1057–1064. ( 10.1016/j.medengphy.2010.07.008) [DOI] [PMC free article] [PubMed] [Google Scholar]
- 22.Yap CH, Kim H-S, Balachandran K, Weiler M, Haj-Ali R, Yoganathan AP. 2010. Dynamic deformation characteristics of porcine aortic valve leaflet under normal and hypertensive conditions. Amer. J. Physiol. Heart Circ. Physiol. 298, H395–H405. ( 10.1152/ajpheart.00040.2009) [DOI] [PubMed] [Google Scholar]
- 23.Iyengar AS, Sugimoto H, Smith DB, Sacks MS. 2001. Dynamic in vitro quantification of bioprosthetic heart valve leaflet motion using structured light projection. Ann. Biomed. Eng. 29, 963–973. ( 10.1114/1.1415523) [DOI] [PubMed] [Google Scholar]
- 24.Smith D, Sacks MS, Pattany PM. 1999. Fatigue-induced changes in bioprosthetic heart valve three-dimensional geometry and the relation to tissue damage. J. Heart Valve Dis. 8, 25–33. [PubMed] [Google Scholar]
- 25.Sun W, Abad A, Sacks MS. 2005. Simulated bioprosthetic heart valve deformation under quasi-static loading. J. Biomech. Eng. 127, 905–914. ( 10.1115/1.2049337) [DOI] [PubMed] [Google Scholar]
- 26.Rodes-Cabau J. 2012. Transcatheter aortic valve implantation: current and future approaches. Nat. Rev. Cardiol. 9, 15–29. ( 10.1038/nrcardio.2011.164) [DOI] [PubMed] [Google Scholar]
- 27.Knight J, Kurtcuoglu V, Muffly K, Marshall W, Stolzmann P, Desbiolles L, Seifert B, Poulikakos D, Alkadhi H. 2009. Ex vivo and in vivo coronary ostial locations in humans. Surg. Radiol. Anat. 31, 597–604. ( 10.1007/s00276-009-0488-9) [DOI] [PubMed] [Google Scholar]
- 28.Reul H, Vahlbruch A, Giersiepen M, Schmitz-Rode Th, Hirtz V, Effert S. 1990. The geometry of the aortic root in health, at valve disease and after valve replacement. J. Biomech. 23, 181–191. ( 10.1016/0021-9290(90)90351-3) [DOI] [PubMed] [Google Scholar]
- 29.Saikrishnan N, Gupta S, Yoganathan AP. 2013. Hemodynamics of the Boston Scientific Lotus™ valve: an in vitro study. Cardiovasc. Eng. Technol. 4, 427–439. ( 10.1007/s13239-013-0163-5) [DOI] [Google Scholar]
- 30.Spinner EM, Buice D, Yap CH, Yoganathan AP. 2012. The effects of a three-dimensional, saddle-shaped annulus on anterior and posterior leaflet stretch and regurgitation of the tricuspid valve. Ann. Biomed. Eng. 40, 996–1005. ( 10.1007/s10439-011-0471-6) [DOI] [PubMed] [Google Scholar]
- 31.ISO. 2013. Cardiovascular implants—cardiac valve prostheses—part 3: heart valve substitutes implanted by transcatheter technique. ISO 5840-3:2013 Geneva, Switzerland: ISO. [Google Scholar]
- 32.Siefert AW, Rabbah J-PM, Saikrishnan N, Kunzelman KS, Yoganathan AP. 2013. Isolated effect of geometry on mitral valve function for in silico model development. Comput. Methods Biomech. Biomed. Eng. 18, 618–627. ( 10.1080/10255842.2013.822490) [DOI] [PMC free article] [PubMed] [Google Scholar]
- 33.Smith D, Sacks MS, Vorp DA, Thornton M. 2000. Surface geometric analysis of anatomic structures using biquintic finite element interpolation. Ann. Biomed. Eng. 28, 598–611. ( 10.1114/1.1306342) [DOI] [PubMed] [Google Scholar]
- 34.Blanke P, et al. 2012. Conformational pulsatile changes of the aortic annulus: impact on prosthesis sizing by computed tomography for transcatheter aortic valve replacement. JACC Cardiovasc. Interv. 5, 984–994. ( 10.1016/j.jcin.2012.05.014) [DOI] [PubMed] [Google Scholar]
- 35.Hamdan A, et al. 2012. Deformation dynamics and mechanical properties of the aortic annulus by 4-dimensional computed tomographyinsights into the functional anatomy of the aortic valve complex and implications for transcatheter aortic valve therapy. J. Amer. College Cardiol. 59, 119–127. ( 10.1016/j.jacc.2011.09.045) [DOI] [PubMed] [Google Scholar]
- 36.Cecelja M, Chowienczyk P. 2012. Role of arterial stiffness in cardiovascular disease. JRSM Cardiovasc. Dis. 1, cvd.2012.012016. ( 10.1258/cvd.2012.012016) [DOI] [PMC free article] [PubMed] [Google Scholar]
- 37.Young E, Chen J-F, Dong O, Gao S, Massiello A, Fukamachi K. 2011. Transcatheter heart valve with variable geometric configuration: in vitro evaluation. Artif. Organs 35, 1151–1159. ( 10.1111/j.1525-1594.2011.01331.x) [DOI] [PubMed] [Google Scholar]
- 38.Trowbridge EA, Crofts CE. 1987. Pericardial heterograft valves: an assessment of leaflet stresses and their implications for heart valve design. J. Biomed. Eng. 9, 345–355. ( 10.1016/0141-5425(87)90084-7) [DOI] [PubMed] [Google Scholar]
- 39.Gabbay S, Bortolotti U, Wasserman F, Tindel N, Factor SM, Frater RW. 1984. Long-term follow-up of the Ionescu–Shiley mitral pericardial xenograft. J. Thorac. Cardiovasc. Surg. 88, 758–763. [PubMed] [Google Scholar]
- 40.Schoen FJ, Fernandez J, Gonzalez-Lavin L, Cernaianu A. 1987. Causes of failure and pathologic findings in surgically removed Ionescu–Shiley standard bovine pericardial heart valve bioprostheses: emphasis on progressive structural deterioration. Circulation 76, 618–627. ( 10.1161/01.CIR.76.3.618) [DOI] [PubMed] [Google Scholar]
- 41.Martin C, Sun W. 2013. Simulation of long-term fatigue damage in bioprosthetic heart valves: effects of leaflet and stent elastic properties. Biomech. Model Mechanobiol. 13, 759–770. ( 10.1007/s10237-013-0532-x) [DOI] [PMC free article] [PubMed] [Google Scholar]
- 42.Vesely I. 2008–2011 Features of a long-lived tissue valve. http://www.valvexchange.com/patients/index.html (accessed 16 April 2013).
- 43.Sun W, Sacks M, Fulchiero G, Lovekamp J, Vyavahare N, Scott M. 2004. Response of heterograft heart valve biomaterials to moderate cyclic loading. J. Biomed. Mater. Res. A 69A, 658–669. ( 10.1002/jbm.a.30031) [DOI] [PubMed] [Google Scholar]
- 44.Sellaro TL, Hildebrand D, Lu Q, Vyavahare N, Scott M, Sacks MS. 2007. Effects of collagen fiber orientation on the response of biologically derived soft tissue biomaterials to cyclic loading. J. Biomed. Mater. Res. A 80A, 194–205. ( 10.1002/jbm.a.30871) [DOI] [PubMed] [Google Scholar]