

Abstract
Objective
Examine the effects of two office ergonomics interventions in reducing visual symptoms at a private sector worksite.
Methods
A quasi-experimental study design evaluated the effects of a highly adjustable chair with office ergonomics training intervention (CWT group) and the training only (TO group) compared with no intervention (CO group). Data collection occurred 2 and 1 month(s) pre-intervention and 2, 6 and 12 months post-intervention. During each data collection period, a work environment and health questionnaire (covariates) and daily health diary (outcomes) were completed. Multilevel statistical models tested hypotheses.
Results
Both the training only intervention (p < 0.001) and the chair with training intervention (p = 0.01) reduced visual symptoms after 12 months.
Conclusion
The office ergonomics training alone and coupled with a highly adjustable chair reduced visual symptoms. In replicating results from a public sector worksite at a private sector worksite the external validity of the interventions is strengthened, thus broadening its generalizability.
Keywords: Office ergonomics intervention, Chair, Training, Visual symptoms, Replication, Multi-level modeling
1. Introduction
According to a 1992 national survey of optometrists, computer-related visual symptoms occurred in at least 14% of patients (Sheedy, 1996). Furthermore, computer user surveys conducted at work consistently reported that vision and eye problems were the most frequently self-identified health problem (Collins et al., 1991; Smith et al., 1981; Dain et al., 1988). It has been demonstrated that the health effects associated with computer use impact productivity (Daum et al., 2004; DeRango et al., 2003). The use of computers has grown exponentially in the last 25 years. Office ergonomics intervention research suggests interventions designed to improve upper extremity musculoskeletal symptoms likely share their effectiveness with visual symptoms (Aaras et al., 1998, 2001, 2005; Dainoff et al., 2005a,2005b; Horgen et al., 2004, 2005; Konarska et al., 2005). A comprehensive office ergonomics intervention designed to improve both musculoskeletal and visual health, work performance, and productivity would be an invaluable tool as half of the American workforce is estimated to regularly use computers at work (US BLS, 2002). To date the office ergonomics literature remains sparse (Brewer et al., 2006) with no replication of successful interventions suggesting it works in more than one unique employer willing to participate. The research reported in this paper replicates an intervention designed to improve both visual and musculoskeletal health in a public sector organization (Amick et al., 2003). The intervention targeted improving upper extremity musculoskeletal health. The theory of change (Fig. 1) conceptualized the interventions as affecting visual health and, ultimately, productivity through office ergonomics knowledge and behavioral changes. Specifically, the highly adjustable chair allows the office worker to make the postural and behavioral changes already desired to reduce visual symptoms related to office computer use. Additionally, the office ergonomics training by itself is hypothesized to increase ergonomics knowledge, facilitating adoption of postures and behaviors in the unchanged workstation amenable to improved visual health. A combination of the highly adjustable chair and office ergonomics training is thought to maximize the ability of the office worker through learning about correct postures and behaviors and how to accomplish them using the chair as they relate to improved visual health. Furthermore, improved visual health is expected to indirectly improve productivity at work through increased functional health. The end product of improved productivity is also a direct result of correct computer use postures and behaviors as well as satisfaction from having a highly adjustable chair. The highly adjustable chair combined with the office ergonomics training has already demonstrated improved worker musculoskeletal and visual health with a 17% increase in productivity in a public sector workplace (Amick et al., 2003; Amick et al., submitted for publication; DeRango et al., 2003).
Fig. 1.
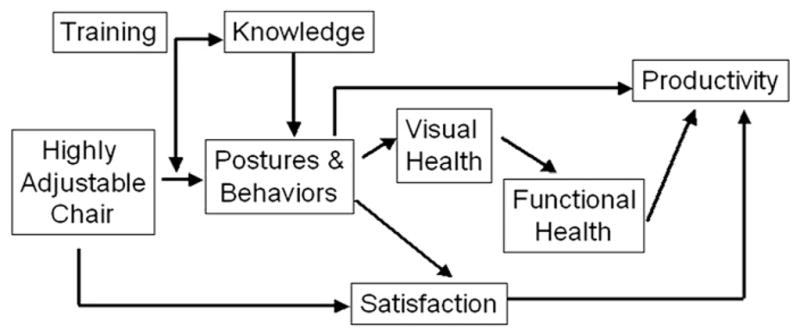
Theory of change.
In this replication in a private sector workplace, we hypothesize receiving a new highly adjustable chair and office ergonomics training reduces worker visual symptoms at the end of the workday compared to workers receiving only training and workers in a control group. Furthermore, we hypothesize workers only receiving training will have reduced visual symptoms at the end of the workday compared to workers in a control group. Similarly, we hypothesize the interventions reduce visual symptoms growth over the workweek.
2. Methods
2.1. Study participants
Full-time office workers at an insurance company spending at least 4 h a day computing and at least 6 h a day sitting in an office and had not filed a workers’ compensation claim within the past six months were invited to participate. Participants had internet access at work and worked in sedentary, computer-intensive office jobs. All participants worked in one U-shaped building characterized by two short arms and a long base.
2.2. Study design
A non-randomized quasi-experimental field study was used to evaluate the effect of two office ergonomics interventions on visual health. Participants were divided into three study groups: those receiving a highly-adjustable chair with office ergonomics training (CWT), those receiving the office ergonomics training only (TO), and a control group receiving training upon completion (CO). Participants located at both ends (short arms) of the building were assigned to the control group to best minimize office ergonomics knowledge contamination through workplace interactions from the study groups receiving the interventions. Supervisory groups in the long arm were randomized to either the training only group or the chair with training group. Information on daily visual health symptoms, demographics, overall health status, and computing-related habits and office conditions were collected at two months and one month before interventions and took place again at two months, six months, and twelve months post-intervention. The study protocol was approved by the Liberty Mutual Research Institute for Safety Human Subjects Internal Review Board.
2.3. Study interventions
The highly adjustable chair (see Fig. 2) was designed to give the office worker control in improving how he or she fits in the office workspace (Bush and Hubbard, 1999; Faiks and Allie, 1999). Specifically, fully-adjustable arm rests, seat pan, and back support afford the office worker some leeway in movement while still maintaining optimal gaze angle and distance crucial for visual health related to computer use. The office ergonomics training was developed for this workplace while applying instructional systems design principles and adult learning theories to the training design (Robertson et al., 2002, 2009). The training goals involved understanding office ergonomic principles, performing ergonomic self-evaluation of workspace, and adjusting and rearranging one’s own workspace. From these goals nine training instructional objectives were specified: recognizing work-related musculoskeletal disorders and risk factors, understanding the importance of varying work postures, knowing how to rearrange the workstation to maximize the “comfort zone”, recognizing and understanding visual issues in the office environment and reducing visual discomfort, understanding computing habits (rest breaks) and knowing how to change work-rest patterns, being aware of the company’s existing health and ergonomic programs, and knowing how to obtain ergonomic accessories through the company’s programs. Two co-facilitators delivered the hour and 45-min long training.
Fig. 2.
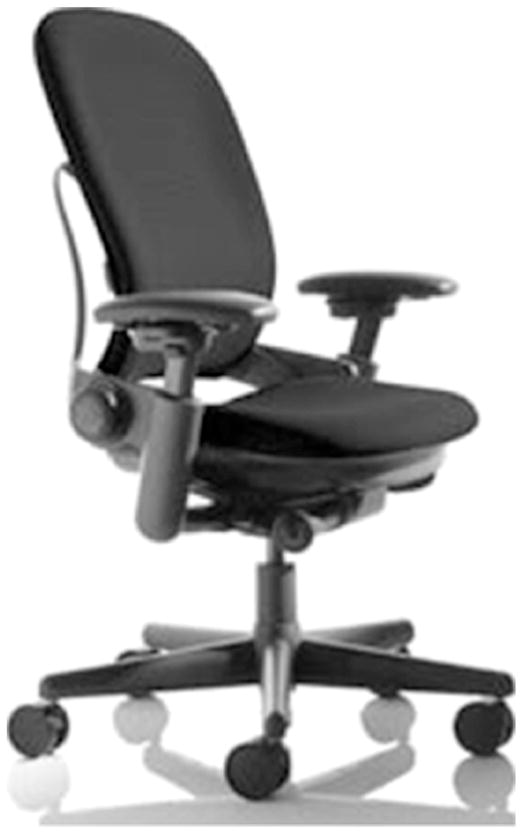
Highly adjustable chair.
2.4. Data collection
The Work Environment and Health questionnaire was administered a week following the web-based symptoms survey at each administration period and consisted of questions on over thirty covariates and potential confounders (a complete list is available from the second author). Visual symptoms data administered by daily symptoms diaries were collected at the end of the workday over a one-week period. Participants completing less than four days’ worth of questions were asked to complete it again the following week. Respondents answered yes or no to having any of the following 11 symptoms: stinging, itching, feeling gritty, becoming red, tearing, feeling dry, burning, aching, feeling sensitive to light, blurry vision, and difficulty focusing. A visual symptoms scale was constructed out of a count of number of symptoms present (ranging from 0 meaning no symptoms present to 11 meaning all symptoms present). If information was missing on any one question the scale was set to missing. The scale had an average Cronbach’s alpha of 0.98 across the five survey rounds (range: 0.96–0.99).
2.5. Covariate selection
Covariate selection occurred through a pre-defined process. Covariates meeting any of the following criteria were considered for inclusion: (1) demonstrating an association with the outcome variable, (2) not being highly correlated with other covariates, (3) not being evenly distributed among study groups either pre- or post-intervention, and (4) having substantively meaningful differences within the study groups across intervention periods. A p-value less than or equal to 0.05 was used as a cutoff to assess the significance of the Pearson’s correlation in meeting criterion 1, and a correlation coefficient of <0.65 for criterion 2. Potential confounders more significantly associated with the outcome variable were chosen among the variables highly correlated with each other. A two-level variance components model with a potential time-varying continuous covariate outcome was used to determine if criterion 3 was met. In this model, the independent variables were the study groups, intervention period, and their two-way interactions. The joint chi-square statistic was used to determine if there was a significant difference between the study groups pre-or post-intervention (p = 0.10). A one-way ANOVA with a time-invariant continuous variable was used to assess study group differences (p = 0.10). Cross-sectional time series logistic regression models were used to assess study group differences of dichotomous potential confounders (p = 0.10). Before proceeding to criterion 4, potential covariates meeting any of the first three criteria were placed into a multilevel linear model and a stepwise backwards selection procedure was conducted where a non-significant model log likelihood reduction of p >0.20 signaled removal from the model. Evaluating whether or not criterion 4 was met required the research team to examine mean differences for each potential confounder by study group and intervention periods. The goal was to obtain the most reasonably parsimonious and meaningful model still correctly specified. Thus, each potential covariate was examined individually to establish meaningful differences appropriate to that variable. Each candidate variable not demonstrating meaningful differences was not included in the final model.
2.6. Statistical analyses
A multilevel linear model was used to test the fixed effect of each study group, compared to the control group, in the context of intervention period on visual health. Additional terms included in the model were three potential confounders and a random error term. The multilevel statistical model was formed by including the selected covariates, an indicator variable for each of the two intervention groups (with the control group as referent), a variable representing study phase (0 = pre-intervention, 1 = post-intervention), and two two-way interaction terms for study phase and group. The following indexed variance components model was used to explain the effect of study phase, intervention group, and selected covariates on visual symptoms.
where yij = visual symptom measurement on the ith occasion for the jth subject; β0 = overall mean for the control group; β1 = differential effect of membership in CWT group; β2 = differential effect of membership in TO group; β3 = differential effect of intervention; β4 = effect of receiving the CWT intervention; β5 = effect of receiving the TO intervention (covariates) denotes terms correcting for selected covariates; uj = variation due to subjects; εij = variation due to occasions of measurement within subjects.
It was assumed (subject to verification) that the random variables μj and eij are independently and normally distributed, each with mean 0 and constant variances and , respectively. More specifically, the level 2 random variable, μj, has a multivariate normal distribution with a constant covariance matrix. It was also assumed that the dependent variable, yij, is normally distributed with a mean equal to the fixed part of the model with variance at level 1 and at level 2 of the model (y ~ N(XB, Ω)). Finally, a distribution assumption for unbalanced data in longitudinal analysis is the probability of being missing was independent of any of the random variables in the model.
The Wald Z statistic of two-way interaction term ‘chair * intervention’ was used to test the hypothesis that the CWT group experienced a reduction in visual symptoms compared to the control group; similarly, the Wald Z statistic for the two-way interaction term ‘training * intervention’ tested the hypothesis that the TO group experienced a reduction in visual symptoms compared to the control group. A joint chi-squared with two degrees of freedom tested the hypothesis that the CWT group experienced a reduction in visual symptoms significantly different from that of the TO group.
A residuals analysis was performed at level 1 and level 2 to determine if model assumptions were violated or if systematic variation was present among the residuals. Upon examination of the residuals, it was determined there were no unwanted patterns (no systematic variation) and no appreciable deviation from normality (no violation of distributional assumptions).
Also tested was the hypothesis that visual symptoms increased over the workweek: mean pre-intervention visual symptoms scores were plotted by day of week to determine if there was a trend. No clear trend was discernible, but introducing a day of week variable into the model with just the intervention groups (study phase = 0 for pre-intervention) suggested, on average, a reduction in symptoms over the workweek (βdayofweek = −0.06, z = 2.03, p = 0.04). However, there was no pattern of symptoms across the workweek to suggest a specific trend that the interventions could affect and, therefore, no hypothesis testing was conducted.
The statistical modeling and residual analysis were conducted using MLwiN 1.1, summary statistics were carried out with Stata 8, and the covariate selection process was conducted using both software packages (MLwiN, 2001; StataCorp, 2003). All analyses are available from the first author.
3. Results
3.1. Study population
A workforce of 309 eligible persons was invited to participate and 250 completed electronic informed consent (81% participation rate). For the visual symptoms analysis, 181 workers provided sufficient baseline data to conduct the analyses (66 workers in the CWT group, 51 in the TO group, and 64 in the C group). At 12-months post-intervention, 154 participants completed the questionnaire (85% retention, Table 1). A participant responding every day of the workweek for all five intervention periods completed 25 symptoms surveys; the minimum considered as completing the study was 15 (3 symptoms surveys a week). Participants were nearly all white or Caucasian, the average age was 38 years, 90% were female, and the average time spent in an office chair and computing was over 5–6 h/day.
Table 1.
Number of participants/number of completed visual symptom surveys by intervention group and measurement period.a
| Intervention group | Measurement period±
|
||||
|---|---|---|---|---|---|
| 1 | 2 | 3 | 4 | 5 | |
| Chair and training (n = 66) | 62/234 | 58/238 | 61/261 | 62/259 | 56/246 |
| Training-only (n = 51) | 48/178 | 45/198 | 45/190 | 49/219 | 47/213 |
| Control (n = 64) | 61/236 | 61/244 | 53/212 | 61/251 | 51/238 |
Periods 1 and 2 are pre-intervention and 3–5 are post-intervention.
One participant responding every day for every period has 25 completed surveys.
Out of 59 non-responders,16 (representing 10–15% sample of non-responders) were chosen to contact: seven did not answer the phone after three attempts and one declined to participate. The eight who agreed were on average seven years younger, average a year less of education, rated their health and chair comfort better, had less bodily pain relative to those who participated in the main study and spent more time in the office chair and at the office computer but less time using home computers on the weekday and weekend.
3.2. Covariates selected
After undergoing the same pre-defined and structured covariate selection process designed in the original intervention study at a previous worksite, six covariates met criteria at all three levels of the process: social support at work, decision latitude, distracted at work, chair comfort, medication strength, and exercise during the workday to relieve pain and discomfort. In the interest of model parsimony, only those that demonstrated meaningful changes pre- versus post-intervention and across groups were considered for inclusion as covariates. The final covariate set was selected based on model robustness, ease of interpretation, and comparability to the model used in the public sector study (Amick et al., 2003). The final covariates were: chair comfort (1 = strongly disagree chair is comfortable to 4 = strongly agree), medication strength (0 = no pain medication taken at all to 3 = very strong prescription pain medications taken), and proportion exercising during the workday to relieve pain or discomfort. Table 2 shows the means or proportions for each covariate by study group and intervention period, in addition to the outcome variable. Appendix 1 lists all of the potential study covariates.
Table 2.
Distribution of covariates and outcome by intervention period and intervention group.a
| Intervention period
|
|||||
|---|---|---|---|---|---|
| Pre
|
Post
|
||||
| 1 | 2 | 3 | 4 | 5 | |
| Chair comfortb | |||||
| CWT | 2.45 | 2.53 | 3.26 | 3.21 | 3.19 |
| TO | 2.48 | 2.60 | 2.73 | 2.72 | 2.80 |
| Control | 2.47 | 2.44 | 2.50 | 2.52 | 2.52 |
| Medication strengthc | |||||
| CWT | 0.83 | 0.76 | 0.76 | 0.65 | 0.88 |
| TO | 1.11 | 0.77 | 0.72 | 0.79 | 0.83 |
| Control | 0.74 | 0.63 | 0.70 | 0.65 | 0.76 |
| Exercised to ease pain or discomfortd (%) | |||||
| CWT | 36 | 34 | 47 | 52 | 47 |
| TO | 44 | 51 | 54 | 51 | 55 |
| Control | 42 | 47 | 37 | 44 | 39 |
| Visual symptoms scoree | |||||
| CWT | 2.58 | 2.45 | 1.98 | 1.29 | 1.52 |
| TO | 2.90 | 2.62 | 2.06 | 1.78 | 2.00 |
| Control | 2.56 | 2.32 | 2.52 | 1.84 | 2.64 |
CWT refers to the chair-with-training group and TO refers to the training only group.
Chair is comfortable ranges from 1 indicating strongly disagree to 4 indicating strongly agree.
Medication strength ranges from 0 indicating taken no medicine at all for pain to 3 indicating taken very strong prescription pain medications such as Darvocet, Lortab, Percocet, or Darvon.
Proportion who exercise during the workday to relieve pain or discomfort.
Visual symptoms ranges from 0 representing no visual symptoms to 11 representing having all visual symptoms listed.
3.3. Analytic results
Table 3 displays the multilevel model results. Two models were constructed to demonstrate the contribution of the intervention groups in reducing visual symptoms. Model 1 and Model 2 differ only in that Model 2 includes the two-way interaction terms that test the main study hypotheses: the “chair * intervention” term tests the effect of the chair and training intervention on visual symptoms and the “training * intervention” term tests the effect of the training only intervention on visual symptoms. The log likelihood difference between the two models is statistically significant (X2(2) = 12.22, p<0.005), suggesting the two interventions (chair with training and training only) improve model fit. Specifically, Model 2 illustrates both the CWT and the TO group experienced an improvement in visual health through a statistically significant reduction in visual symptoms (βchair*intervention = −0.40, z = 2.50, p = 0.01; βtraining*intervention = −0.53, z = 3.35, p< 0.001). There was a statistically significant difference in effect between the CWT group and the TO group (X2(2) = 12.25, p<0.01). Fig. 3 is a graphical representation of the significant effects of both intervention groups and further illustrates the lack of meaningful difference in effect between the two groups.
Table 3.
Multi-level model including and excluding main effect parameters.
| Variable | Model 1 (std. error) | Model 2 (std. error) |
|---|---|---|
| Chair comfort | −0.41 (0.09)* | −0.34 (0.10)* |
| Exercise due to pain | −0.31 (0.09)* | −0.29 (0.09)* |
| Strength of medications | 0.20 (0.06)* | 0.19 (0.06)* |
| β1: Chair-and-training group | −0.26 (0.36)ns | −0.05 (0.37)ns |
| β2: Training-only group | −0.03 (0.38)ns | 0.28 (0.40)ns |
| β3: Intervention phase | −0.44 (0.07)* | −0.17 (0.11) ns |
| β4: Chair-intervention | – | −0.40 (0.16)* |
| β5: Training-intervention | – | −0.53 (0.16)* |
| β0: Intercept term | 3.68 (0.33) | 3.36 (0.36) |
| εij: Level 1 variance | 2.95 (0.08) | 2.94 (0.08) |
| μj: Level 2 variance | 3.95 (0.43) | 3.97 (0.43) |
| Model −2 ln (likelihood) | 13526.02 | 13513.80 |
| Difference in −2 ln (likelihoods) = 12.22* | ||
= p<0.05;
= p> 0.05.
Fig. 3.

Absolute change in visual symptoms score by study group.
Each time period (2, 6, and 12 months) was considered separately to determine if the interventions’ effect was time-dependent (see Fig. 4). At 2 months post-intervention the TO group experienced a statistically significant reduction in visual symptoms compared to the control group (βtraining*intervention = −0.51; z = 2.43; p = 0.02), while the CWT group was not significantly different from the control group (βchair*intervention = −0.24; z = 1.12; p = 0.26). Additionally, the CWT and TO groups do differ significantly from each other (X2(2) = 5.84, p = 0.05). At 6 months post-intervention neither the CWT nor the TO group differed significantly from the control group (βchair*intervention = −0.18, z = 0.89, p = 0.36; βtraining*intervention = −0.23, z = 1.21, p = 0.22). In addition, the CWT and TO groups did not differ significantly from each other (X2(2) =1.62; p = 0.45). However, at 12 months post-intervention both the CWT and TO groups demonstrated a statistically significant reduction in visual symptoms compared to the control group (βchair*intervention = −0.52, z = 2.46, p = 0.01; βtraining*intervention = −0.71, z = 3.45, p< 0.001). Consistent with the overall study findings, there was a statistically significant difference between the two intervention groups (X2(2) = 12.67; p<0.01).
Fig. 4.

Effect parameters by study group and time period.
Due to sample size restrictions independent analyses for each visual symptom could not be conducted.
4. Discussion
The findings presented here are based on two office ergonomics interventions originally conducted in a public sector (PU) worksite (Amick et al., 2003) now replicated at a private sector (PR) worksite. At both sites, the CWT group reported significantly reduced visual symptoms compared to the control group. However, at the PR site, but not the PU site, the TO group experienced a significant reduction in visual symptoms as well. At both sites the secondary hypothesis for a workweek effect was tested and no workweek trend in symptoms was found to exist.
The CWT group at the PU site experienced a greater reduction in visual symptoms overall: the PU site effect was larger than the replication (PR) site effect (bPU = −0.49, SE = 0.15; bPR = −0.40, SE = 0.16). Similarly in both groups the effect of the chair with training was insignificant at 6 months post-intervention (bPU = −0.20, p = 0.32; bPR = −0.18, p = 0.36) and then had its largest effect at 12 months (bPU = −0.67, p = 0.001; bPR = −0.52, p = 0.01). Overall, both sites experienced a statistically significant reduction in visual symptoms in the CWT group [bPU = −0.49, p<0.001; bPR = −0.40, p = 0.01).
There were differences in findings between the private sector and public sector worksites for the TO group. Although the effect was in the same direction for both sites, the effect at the PR site was larger than that for the PU site (bPR = −0.53, SE = 0.16; bPU = −0.13, SE = 0.17). For the PU site, the training-only effect never resulted in a significant visual symptoms reduction although the effect grew larger throughout follow-up. At 2 months, there was no change in visual symptoms (bPU =0.08; p = 0.72), at six months the effect started to grow but was in the wrong direction (bPU =0.13; p = 0.57), while at 12 months there was a larger reduction in visual symptoms, though insignificant (bPU = −0.30; p =0.20). However, in the PR site the training-only intervention led to a significant reduction in visual symptoms both at 2months post-intervention (bPR = −0.51; p = 0.01) and at 12 months (bPR = −0.71; p = 0.001). At 6 months there was no significant reduction in visual symptoms reported by the training-only group at the private sector worksite (bPR = −0.23; p = 0.22).
The hypotheses stated the effect of the CWT group would be larger than the TO and control groups, and that of the TO group would be larger than the control group. The PU sector data supported the hypothesis that the effect of the CWT group was larger than the TO and control groups but there were no differences between the TO and control groups. However, at the PR site, both the CWT and TO groups experienced significant visual symptoms reduction compared to the control groups, but there was no difference in visual symptom reduction between the CWT and the TO groups. Data on workstations during the training are being analyzed to better describe how the proposed framework impacted visual health. Potential differences in workstation adjustability between the two sites may account for the lack of a difference in visual symptoms reduction between the two study groups.
There was a time-dependent effect for both intervention groups at both worksites in that the largest effect size was seen at 12 months. Interestingly, at 6 months both worksites and study groups experienced a drop in effect size accompanied by an insignificant visual symptoms reduction. It is not clear why the intervention effect experienced this dip at 6 months, then regained its significant effect at 12 months. Changes in daylight and seasonal allergies are not likely as both worksites had very limited natural lighting and seasons did not really coincide with the timing of the study to produce these changes. One reason for this time-dependent effect could be a honeymoon effect that ended after the early post-intervention time period where the novelty of the training and chair diminished and a personal commitment to workstation behaviors had yet to be made. Continuing in this logic, somewhere between 6 and 12 months the behavior changes were adopted and a significant reduction in visual symptoms was seen.
Replication studies make crucial contributions in evaluating the generalizability of an intervention. Each worksite offered its own unique challenges with respect to pre-existing workstations, office layout, and expectations from management as to how the study would be conducted. External validity represents the extent to which a causal relationship holds over variations in persons, setting, interventions, and outcomes (Shadish et al., 2002). Observing the reduction in visual symptoms occur for the chair with training group and training only group at office worksites that are completely different from each other serves only to raise the external validity of the causal relationship between the interventions and the visual symptoms. Successful interventions such as these are easier and more practical to implement in other office environments because of the demonstrated generalizability.
Acknowledgments
This research was funded by grants from Steelcase, Inc. to the University of Texas, The Upjohn Research Institute, York University and Health and Work Outcomes and through the support of the Liberty Mutual Research Institute for Safety. At the time of the study Cammie Chaumont Menéndez was a doctoral student at the University of Texas supported by NIOSH Occupational Injury Prevention Training Grant T42 0H008421.
Appendix 1
Comprehensive list of potential study covariates.
Hours spent sitting in office chair in typical week
Hours spent working at office computer in typical week
Total computer use
Number of breaks taken in the past week
Repetitive hand and wrist activity
How much force used with hand and wrists in office
Using skills at work
Authority at work
Decision latitude at work
Psychological demands at work
Social support
Workstation layout
Level of glare produced by lighting
Level of distraction by noise at work
Satisfaction level of workplace privacy
Chair comfort
Chair satisfaction
Body mass index
General (Poor) Health
Taken any medicine at all for pain
Frequency of prescription pain medications taken in past month
Medication strength
Exercise to relieve pain
Type of eyeglasses lenses worn
Education level
Level
Age
Job tenure
Gender
Disability status
Marital status
Number of persons living in household
Racial/ethnic background
Did job demands prevent rest breaks from computer
Footnotes
The findings and conclusions in this report are those of the authors and do not necessarily represent the views of the Centers for Disease Control and Prevention, National Institute for Occupational Safety and Health.
References
- Aaras A, Horgen G, Bjorset H, et al. Musculoskeletal, visual and psychosocial stress in VDU operators before and after multidisciplinary ergonomic interventions. Appl Ergon. 1998;29:335–354. doi: 10.1016/s0003-6870(97)00079-3. [DOI] [PubMed] [Google Scholar]
- Aaras A, Horgen G, Bjorset H, et al. Musculoskeletal, visual and psychosocial stress in VDU operators before and after multidisciplinary ergonomic interventions. A 6 years prospective study—Part II. Appl Ergon. 2001;32:549–557. doi: 10.1016/s0003-6870(01)00030-8. [DOI] [PubMed] [Google Scholar]
- Aaras A, Horgen G, Ro O, Loken E, Mathiasen G, Bjorset HH, Larsen S, Thoresen M. The effect of an ergonomic intervention on musculoskeletal, psychosocial and visual strain of VDT data entry work: the Norwegian part of the international study. Int J Occup Saf Ergon. 2005;11:25–47. doi: 10.1080/10803548.2005.11076627. [DOI] [PubMed] [Google Scholar]
- Amick BC, III, Roberston MM, DeRango K, et al. Effect of office ergonomics intervention on reducing musculoskeletal symptoms. Spine. 2003;28:2706–2711. doi: 10.1097/01.BRS.0000099740.87791.F7. [DOI] [PubMed] [Google Scholar]
- Amick BC, III, Chaumont Menéndez C, Bazanni L, et al. A field intervention examining the impact of an office ergonomics training and a highly adjustable chair on visual symptoms. Appl Ergon. doi: 10.1016/j.apergo.2011.09.006. submitted for publication. [DOI] [PMC free article] [PubMed] [Google Scholar]
- Brewer S, Van Eerd D, Amick BC, III, et al. Workplace interventions to prevent musculoskeletal and visual symptoms and disorders among computer users, a systematic review. J Occup Rehabil. 2006;16:325–358. doi: 10.1007/s10926-006-9031-6. [DOI] [PubMed] [Google Scholar]
- Bush T, Hubbard R. An evaluation of postural motions, chair motions and contact in four office seats. Proceedings of the Human Factors and Ergonomics Society 43rd Annual Meeting; Houston, Texas. 1999. pp. 589–593. [Google Scholar]
- Collins MJ, Brown B, Bowman KJ, et al. Task variables and visual discomfort associated with the use of VDTs. Optom Vis Sci. 1991;68:27–33. doi: 10.1097/00006324-199101000-00005. [DOI] [PubMed] [Google Scholar]
- Dain SJ, McCarthy AK, Chan-Ling T. Symptoms in VDU operators. Am J Optom Physiol Opt. 1988;65:162–167. doi: 10.1097/00006324-198803000-00004. [DOI] [PubMed] [Google Scholar]
- Dainoff MJ, Aaras A, Horgen G, Konarska M, Larsen S, Thoresen M, Cohen BG MEPS Study Group. The effect of an ergonomic intervention on musculoskeletal, psychosocial and visual strain of VDT entry work: organization and methodology of the international study. Int J Occup Saf Ergon. 2005a;11:9–23. doi: 10.1080/10803548.2005.11076629. [DOI] [PubMed] [Google Scholar]
- Dainoff MJ, Cohen BG, Dainoff MH. The effect of an ergonomic intervention on musculoskeletal, psychosocial, and visual strain of VDT data entry work: the United States part of the international study. Int J Occup Saf Ergon. 2005b;11:49–63. doi: 10.1080/10803548.2005.11076630. [DOI] [PubMed] [Google Scholar]
- Daum KM, Clore KA, Simms SS, et al. Productivity associated with visual staring among computer users. Optometry. 2004;75:33–47. doi: 10.1016/s1529-1839(04)70009-3. [DOI] [PubMed] [Google Scholar]
- DeRango K, Amick BC, III, Robertson MM, et al. The productivity consequences of two ergonomic interventions. Institute for Work and Health; Toronto, Ontario: 2003. Working Paper Series, #222. [Google Scholar]
- Faiks F, Allie P. Supporting the torso through seated articulation. Proceedings of the Human Factors and Ergonomics Society 43rd Annual Meeting; Houston, Texas. 1999. pp. 574–578. [Google Scholar]
- Horgen G, Aaras A, Thoresen M. Will visual discomfort among visual display unit (VDU) users change in development when moving from single vision lenses to specially designed VDU progressive lenses? Optom Vis Sci. 2004;81:341–349. doi: 10.1097/01.opx.0000134908.44145.49. [DOI] [PubMed] [Google Scholar]
- Horgen G, Aaras A, Dainoff MJ, Konarska M, Thoresen M, Cohen B MEPS Study Group. A cross-country comparison of short- and long-term effects of an ergonomic intervention on musculoskeletal discomfort, eyestrain and psychosocial stress in VDT operators: selected aspects of the international project. Int J Occup Saf Ergon. 2005;11:77–92. doi: 10.1080/10803548.2005.11076632. [DOI] [PubMed] [Google Scholar]
- Konarska M, Wolska A, Widerszal-Bazyl M, Bugajska J, Roman-Liu D, Aaras A. The effect of an ergonomic intervention on musculoskeletal, psychosocial, and visual strain of VDT data entry work: the Polish part of the international study. Int J Occup Saf Ergon. 2005;11:65–76. doi: 10.1080/10803548.2005.11076631. [DOI] [PubMed] [Google Scholar]
- MLwiN [software]. Version 1.10. Multilevel Models Project Institute of Education; London: 2001. [Google Scholar]
- Robertson MM, Amick BC, III, DeRango K, et al. The impact of an office ergonomics training on worker knowledge, behavior and musculoskeletal risk. Proceedings of the 6th International Scientific Conference on Work with Display Units. ERGONOMIC Institut für Arbeit-und Sozialforschung Forschungsgesellschaft mbH; Berchtesgaden, Germany. 2002. pp. 376–378. [Google Scholar]
- Robertson MM, Amick BC, III, DeRango K, Rooney T, Bazzani L, Harrist RH, Moore A. The effects of an office ergonomics training and chair intervention on worker knowledge, behavior and musculoskeletal risk. Appl Ergon. 2009;40:124–135. doi: 10.1016/j.apergo.2007.12.009. [DOI] [PubMed] [Google Scholar]
- Shadish WR, Cook TD, Campbell DT. Experimental and Quasi-Experimental Designs for Generalized Causal Inference. Houghton Mifflin Company; Boston: 2002. [Google Scholar]
- Sheedy JE. The bottom line on fixing computer-related vision and eye problems. J Am Optom Assoc. 1996;67:512–516. [PubMed] [Google Scholar]
- Smith MJ, Cohen BGF, Stammerjohn LW., Jr An investigation of health complaints and job stress in video display operations. Hum Factors. 1981;23:387–400. doi: 10.1177/001872088102300402. [DOI] [PubMed] [Google Scholar]
- Stata [software]. Release 8.0. Stata Corporation; College Station, Texas: 2003. [Google Scholar]
- US Bureau of Labor Statistics. Computer and internet use at work in 2001, USDL 02-601. 2002 News Release retrieved December 12, 2004. Available from: http://www.bls.gov/news.release/ciuaw.toc.html.