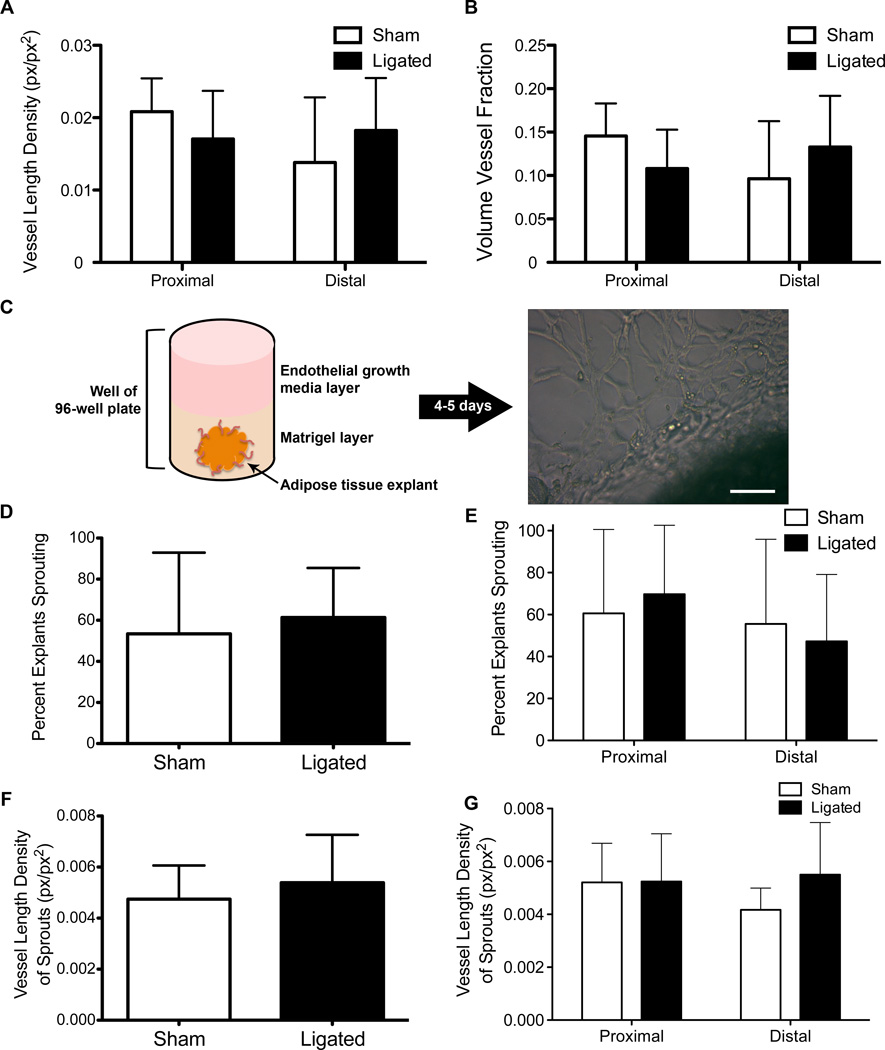
Figure 3.
No difference in angiogenic capability between sham and ligated tissue. En face visualization of adipose tissue and quantification using RAVE reveals no difference in VLD (A) or VVF (B). Three mice with four FOVs were used for calculation of VLD and VVF. Schematic of angiogenic capability assay (C) to assess sprouting prevalence (D,E) and vessel length density of sprouting events (F,G) in sham and ligated tissue by region of interest. Six mice were used and six samples were taken from each for use in the angiogenic capability assay. Scale bar = 100 µm. p-value < 0.05, Two-way ANOVA. Data presented are mean + standard deviation for all graphs.

