

Abstract
Blood ammonia is routinely used in clinical settings to assess systemic ammonia in hepatic encephalopathy and urea cycle disorders. Despite its drawbacks, blood measurement is often used as a comparator in breath studies because it is a standard clinical test. We sought to evaluate sources of measurement error and potential clinical utility of breath ammonia compared to blood ammonia.
We measured breath ammonia in real time by quartz enhanced photoacoustic spectrometry and blood ammonia in 10 healthy and 10 cirrhotic participants. Each participant contributed 5 breath samples and blood for ammonia measurement within 1 h. We calculated the coefficient of variation (CV) for 5 breath ammonia values, reported medians of healthy and cirrhotic participants, and used scatterplots to display breath and blood ammonia.
For healthy participants, mean age was 22 years (±4), 70% were men, and body mass index (BMI) was 27 (±5). For cirrhotic participants, mean age was 61 years (±8), 60% were men, and BMI was 31 (±7). Median blood ammonia for healthy participants was within normal range, 10 μmol L−1 (interquartile range (IQR), 3–18) versus 46 μmol L−1 (IQR, 23–66) for cirrhotic participants. Median breath ammonia was 379 pmol mL−1 CO2 (IQR, 265–765) for healthy versus 350 pmol mL−1 CO2 (IQR, 180–1013) for cirrhotic participants. CV was 17 ± 6%.
There remains an important unmet need in the evaluation of systemic ammonia, and breath measurement continues to demonstrate promise to fulfill this need. Given the many differences between breath and blood ammonia measurement, we examined biological explanations for our findings in healthy and cirrhotic participants. We conclude that based upon these preliminary data breath may offer clinically important information this is not provided by blood ammonia.
Keywords: breath ammonia, blood ammonia, cirrhosis, hepatic encephalopathy, healthy normal
Introduction
Ammonia, a product of protein metabolism, is relevant to a number of disease states and to normal human physiology. Ammonia physiology is dynamic and systemic levels may change from day to day or even hour to hour, according to the time of day and composition of recent food intake, bowel movements, exercise, and medications. From generation to excretion, ammonia physiology is complex and includes multiple organ systems [1]. The liver plays a central role in ammonia homeostasis by removing ammonia from the circulation via the urea cycle as well as glutamine synthesis and hydrolysis of glutamine [2].
The standard method to evaluate systemic ammonia is the measurement of blood ammonia. However, blood ammonia assays are subject to several potential errors in collection and processing. Moreover, blood samples cannot be preserved at room temperature and must be analyzed immediately to avoid unpredictable elevation due to gamma-glutamyl transferase (GGT) activity, particularly in cirrhotic patients [3]. Traces of sweat, hemolysis, and prolonged tourniquet time can also unpredictably and profoundly affect results [4, 5].
Elevated ammonia is considered central to the pathophysiology of hepatic encephalopathy (HE) amongst cirrhotic individuals. However, because of the many problems associated with the measurement of blood ammonia, venous ammonia is not considered a valid biomarker and correlates poorly with grades of encephalopathy. The current American Association for the Study of Liver Disease Practice (AASLD) guideline states, `High blood-ammonia levels alone do not add any diagnostic, staging, or prognostic value in HE patients with CLD (chronic liver disease)' [6].
Accurate quantification of systemic ammonia based upon exhaled breath may be an alternative way to investigate the role of ammonia in patients with CLD. Breath measurement is an ideal method, since it is non-invasive and has the potential to be fast and inexpensive. Despite the fact that breath ammonia has been in various stages of development since at least 1979, it has not matured into widespread use. However, newer monitors and collection techniques are increasingly more accurate, and therefore provide reason for ongoing optimism. A unique strength of our approach is that we have developed a breath monitor and methodology specifically designed for ammonia [7, 8] and have used this system in multiple subsequent human subject studies [9, 10].
Like blood ammonia, breath ammonia measurements are also challenging, and there are multiple possibilities for error specific to breath measurements involving the monitor and interface (i.e. tuning of the laser, an appropriate reference gas, sample pressure, sorption of ammonia on tubing and filters, undesirable contamination with background air, temperature influences) and the participant (i.e. poor dentition or periodontal disease, lung disease, erratic breathing). It remains unclear what proportion of exhaled breath represents systemic ammonia, with some research suggesting major contamination from oral cavity [11].
Perhaps because blood assays have been commonly used in clinical medicine for many decades and breath assays are relatively new, some researchers believe that the latter must correlate with the former to have validity. For example, Mochalski et al, recently asserted that `[a] major prerequisite for the successful application of breath tests is the assumption that a robust correlation between the blood and breath analytes of interest can be established' [12].
Given the many differences between breath and blood measurements, robust correlation seems neither likely nor prerequisite. Yet, blood ammonia is an established test with a standardized measurement method and result. By reporting blood versus breath one should be able to obtain the same result, in side-by-side blood assay monitors anywhere in the world, and easily make comparisons to historical data. Therefore, within the context of these limitations, blood ammonia can serve as a benchmark. We hypothesize that it is important, especially for a volatile and highly reactive compound such as ammonia, to understand the sources of measurement error and the potential clinical utilities of each method (table 1). We now report our experience contrasting breath versus blood ammonia in normal and cirrhotic study participants.
Table 1.
Breath and blood ammonia measurement comparisons. For both measurements, careful attention to measurement technique reduces, but does not eliminate errors.
| Breath | Blood | |
|---|---|---|
| Ammonia measurement | Pulmonary venous NH3 | Peripheral venous |
| Immediate proximal blood source | Renal and hepatic veins via vena cava and pulmonary circulation | Systemic tissue capillary bed |
| Major sources of measurement error: subject influences | Oral/Nasal factors including bacterial artifact, salivary urea, pH | Blood ALT and GGT |
| Major sources of measurement error: technical aspects related to sample acquisition and handling | Temperature | Temperature |
| Humidity | Tourniquet time | |
| Breath quality | Skin sweat | |
| Stickiness of interface | Hemolysis | |
| Monitor capability: speed/accuracy | Sample processing delay | |
| Sample processing time | ||
| Main advantages | Easily enables repeated measures. Quick results | Phlebotomy is routinely performed for many other medical applications |
| Logistics and costs | Monitor prototypes can be difficult to operate, but are very safe. ~$1 disposable mouthpiece for unlimited samples | Phlebotomy requires universal precautions. ~$33 per sample |
| Present clinical role | None | Limited |
| Recent research effort | Modest | Minimal |
| Standardized measurement Technology and result reporting | No | Yes |
Methods
Study design
The St. Luke's University Hospital Institutional Review Board in Bethlehem, Pennsylvania approved this study and all participants provided informed written consent. Healthy individuals were recruited using flyers and those with cirrhosis were recruited from Solga Gastroenterology. The diagnosis of cirrhosis was made by standard medical criteria. As routine management of HE, 7 of 10 participants with cirrhosis were prescribed either lactulose and/or rifaximin. Cirrhotic individuals were sufficiently clinically stable to participate in clinical research. Patients with significant periodontal disease, kidney disease or tobacco use were excluded.
Determination of breath ammonia
The participants were required to exhale for at least 10 s in a defined manner via a restrictor, and each exhalation constituted one sample. A specially designed breath sampler (Loccioni, Angeli di Rosora, Italy) was used to monitor breath exhalation in a manner similar to the American Thoracic Society/European Respiratory Society recommended breath sampling protocol for analyzing breath nitric oxide (FeNO) [13]. This breath sampler prompts, monitors, displays and archives real-time measurements of mouth pressure and the concentration of carbon dioxide (CO2) for each breath sample.
Ideal mouth pressure for a sample is 10 cm of water maintained at least 10 s. This mouth pressure, coupled with the flow restrictor, corresponds to a flow rate of 50 mL s−1. For all breath sampling, a disposable oneway in-line valve was used on the mouth port of the breath sampler. Latex gloves were worn when inserting this valve into the breath sampler in order to prevent contamination with ammonia from the skin.
Each breath was sampled continuously via a 50 cm long inlet line (Teflon) heated to 55 °C and the concentration of ammonia was determined with quartz enhanced photoacoustic spectrometry [7] as previously described [8, 14]. Plateau breath ammonia concentrations measured during the phase III portion of the exhalation profile were reported in parts per billion (ppb). Real-time ammonia concentrations determined by the ammonia sensor were displayed on the breath sampler and archived.
Normalization by correction CO2 factor
The ammonia values were standardized by the concentration of exhaled CO2 in order to reduce inter-individual variability [15]. This method has been shown to allow comparisons when there are large differences in body mass [16]. The standardized breath ammonia in pmol/mL CO2 was calculated by the following equation: corrected value = (sample breath value in ppb/24.45) * (760/ sample CO2 pressure in Torr).
Sample collection
All breath data were collected in a well-ventilated research office dedicated to breath collection and analysis. Room air concentrations were measured before sampling the breath of each participant and shown to be minimal. Each participant fasted (nothing to eat or drink) for 3 h prior to presentation for study and presented in the morning or early afternoon. No mouth rinse was performed. Five sequential breath samples were obtained.
Blood ammonia determination
Phlebotomy was performed at the CLIA-certified outpatient laboratory of the St. Luke's University Hospital. Blood samples for ammonia assays were placed on ice and run immediately, these precautions are consistent with standard medical practice. Seventeen of 20 participants had blood drawn less than 1 h prior to breath collection, and 3 participants had blood drawn immediately after. The reported reference range was 11–35 μmol L−1.
Statistical methods
Each participant contributed five breath samples, and the coefficient of variation (CV) was calculated. Because of the sample size (N = 20), we reported medians with interquartile range (IQR) of blood and breath ammonia for cirrhotic and healthy participants. Data were found to violate the assumption of a normal distribution by the Kolmogorov–Smirnov test, and non-parametric Spearman correlation coefficients were calculated. Scatterplots illustrated data points for blood and breath ammonia. All statistics were performed using SAS software (SAS, v9.3, Cary, NC, USA).
Results
Table 2 illustrates differences between healthy (N = 10) and cirrhotic (N = 10) participants. For healthy participants, mean age was 22 years (SD, 4), 70% were men, and body mass index (BMI) was 27 (SD, 5). For cirrhotic participants, mean age was 61 years (SD, 8), 60% were men, and BMI was 31 (SD, 7). Median blood ammonia for healthy participants was within normal range, 10 μmol L−1 (IQR, 3–18) versus 46 μmol L−1 (IQR, 23–66) for cirrhotic participants.
Table 2.
Characteristics of participants, N = 20.
| All | Healthy (N = 10) | Cirrhotic (N = 10) | |
|---|---|---|---|
| Age (years ± SD) | 42 ± 21 | 22 ± 4 | 61 ± 8 |
| Gender (male) | 13 (65%) | 7 (70%) | 6 (60%) |
| BMI (±SD) | 29 ± 6 | 27 ± 5 | 31 ± 7 |
| Blood ammonia (μmol L−1) Median (IQR) | 18 (8, 46) | 10 (3, 18) | 46 (23, 66) |
| Breath ammonia (pmol mL−1CO2) Median (IQR) | 379 (195, 879) | 379 (265, 765) | 350 (180, 1012) |
The mean CV for each participant's 5 breath samples was 17 ± 6%. Median breath ammonia was 379 pmol mL−1 CO2 (IQR, 265–765) for healthy versus 350 pmol mL−1 CO2 (IQR, 180–1013) for cirrhotic participants. Non-parametric Spearman correlation coefficients did not suggest a correlation between blood and breath ammonia for healthy (p = 0.1) or cirrhotic (p = 0.3) participants.
Figure 1 illustrates the scatterplot of blood versus breath ammonia in healthy (figure 1(a)) and cirrhotic participants (figure 1(b)). Blood ammonia for all healthy participants was ⩽20 μmol L−1, and mean breath ammonia for all but one healthy participant was <1000 pmol mL−1 CO2. The single healthy participant with mean breath ammonia of 1434 pmol/mLCO2 had normal blood ammonia. Seven of 10 cirrhotic participants recorded mean breath ammonia of <1000 pmol mL−1 CO2, and 1 cirrhotic participant had mean breath ammonia of 1013 pmol mL−1 CO2. Two cirrhotic participants recorded exceptionally high mean breath ammonia values of 2942 and 3553 pmol mL−1 CO2.
Figure 1.
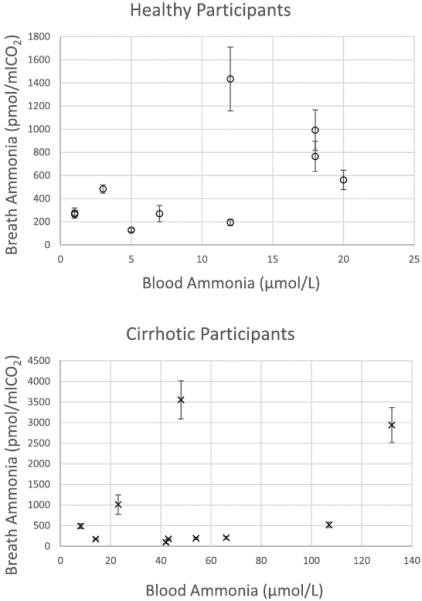
Scatterplots of blood ammonia (μmol L−1) and breath ammonia (pmol mL−1 CO2) in healthy (a) and cirrhotic (b) participants. Healthy participants are represented by `o', N = 10. Participants with cirrhosis are indicated by `x', N = 10. Breath values are mean breath ammonia of 5 measurements and error bars are standard deviations. The reported reference range for blood ammonia was 11–35 μmol L−1.
Inspection of outliers, with attention to whether cirrhotic participants were prescribed ammonia-lowering medications, did not suggest that prescribed medications influenced either breath or blood ammonia. Three participants who were prescribed medications had the highest level of mean breath ammonia (3553 pmol mL−1 CO2), blood ammonia (107 μmol L−1), and both mean breath and blood ammonia, 2942 pmol mL−1 CO2 and 132 μmol L−1, respectively. Mean breath ammonia of 4 cirrhotics, 2 who were prescribed ammonia-lowering medications and 2 not on medications, was low (100 to 209 pmol mL−1 CO2) although blood ammonia was >40 μmol L−1. We cannot confirm the adherence of participants to ammonia- lowering medications.
Discussion
Although our data showed that breath ammonia had no explanatory power for blood ammonia, this study provides valuable information about measuring ammonia in breath. As noted above, we have used a constant sampling and measurement protocol through multiple clinical studies. Therefore, we believe our comparison is unique and informative.
Discordance in healthy participants may be due to factors such as: oral ammonia-producing bacteria, gamma-glutamyl transferase (GGT) and alanine aminotransferase activity (ALT), sample hemolysis, and storage time and temperature. In the single healthy participant with breath ammonia of 1434 pmol mL−1 CO2 and normal blood ammonia, we expect that the elevated ammonia level was attributable to bacteria in dental plaque and tongue coating [17]. As described by Nikolac et al, the presence of ALT and GGT may significantly increase blood ammonia [18]. This increase occurs within the normal range of ALT and GGT in healthy subjects, and this may provide an explanation for the breath ammonia level ranging from 700–1000 pmol mL−1 CO2 in healthy participants with normal blood ammonia levels. As well, blood ALT and GGT is increased in viral hepatitis and alcohol liver disease [19].
To our knowledge, this issue has not been investigated in cirrhotic individuals who can have significantly elevated ALT and GGT compared to healthy subjects. Although we did not measure ALT and GGT in our study, other groups have reported that the median ALT and GGT in healthy subjects are 17 and 19, respectively (N = 200) versus 50 and 61 in cirrhotics, respectively (N = 264) [20]. Indeed, blood ammonia measurement in cirrhotic participants may over-estimate true blood ammonia, since the levels of ALT and GGT are generally, but unpredictably increased in liver disease, and are elevated about 3-fold in cirrhotics compared to healthy counterparts.
Thus, even if sample acquisition and handling are error-free, blood ammonia results may still be falsely and unpredictably increased. Importantly, this false increase may disproportionately affect individuals with cirrhosis, in whom accurate ammonia measurements are most clinically relevant. Therefore, it is biologically plausible that blood ammonia is over-estimated in cirrhotics, even beyond the `usual' criticisms of tourniquet time, storage temperature, and processing time. This may explain the 5 cirrhotic participants with blood ammonia >35 μmol L−1 who have mean breath ammonia levels <600 pmol mL−1 CO2.
The severity and clinical consequences of a cirrhotic individual's portal hypertension are also important. Portal hypertension can variably result in varices, ascites, hepato-renal syndrome, and encephalopathy, but these do not always occur in a stepwise or predictable manner [21]. Hyperammonemia can occur due to impaired hepatocyte function and/or shunting, and, together with acid/base disturbances, may demand that renal function plays a greater role in ammonia homeostasis.
Interestingly, encephalopathy researchers have employed speculative mathematical modeling to help determine the relative contribution of these events, in part because of the inadequacy of blood ammonia research to date [22]. The increased role of the kidneys in cirrhosis may contribute to breath versus blood discordance because, as we have previously speculated, the pulmonary circulation receives blood directly from the kidneys via the inferior vena cava. Therefore, breath measurement may reflect an enhanced contribution of ammonia metabolism and clearance in the kidneys as opposed to peripheral venous blood ammonia measurement.
Case study discussion
Although this study was not designed to evaluate ammonia measurements in a complete clinical context, some observations are possible (table 3). For example, one participant was a 62 year-old man with hepatitis C viral infection and alcohol cirrhosis. At the time of his breath collection, his renal function was normal, and he had no varices or encephalopathy. Therefore, his blood ammonia was elevated at 107 μmol L−1 and likely due to elevations in ALT and GGT, whereas his breath ammonia was 522 pmol mL−1 CO2. In contrast, another participant was a 54 year-old man with alcohol cirrhosis, normal renal function and no encephalopathy, but large varices. His blood ammonia was elevated at 66 μmol L−1, whereas his breath ammonia of 208 pmol mL−1 CO2 was relatively low. This may be because his liver ammonia clearance was reduced due to shunting while his renal ammonia clearance was intact.
Table 3.
Speculative cirrhosis subtypes affecting ammonia metabolism. See text for clinical examples. Shunting reduces hepatic ammonia clearance. Based on blood flow, we postulate that breath ammonia measurement reflects a greater proportion of renal ammonia metabolism.
| Cirrhosis subtypes germane to ammonia metabolism | Predicted blood ammonia | Predicted breath ammonia | Encephalopathy risk |
|---|---|---|---|
| No porto-systemic shunting, normal kidney function | Normal | Normal | Absent |
| ↑ porto-systemic shunting, normal kidney function | ↑ | Normal | Absent |
| ↑ porto-systemic shunting, impaired kidney function | ↑ | ↑ | Present |
A third example is provided by a 70 year-old woman with impaired renal function who had an trans-jugular intrahepatic portosystemic shunt (TIPS) placed 6 months prior to breath collection to manage refractory ascites. Because TIPS are intended to therapeutically increase portosystemic shunting (in this case to treat the ascites), they commonly worsen hyperammonemia and encephalopathy [23]. Thus, her blood ammonia was 132 μmol L−1 (the greatest in our cohort), and her breath ammonia was 2942 pmol mL−1 CO2, likely due to her renal insufficiency. And, in contrast to the first two subject examples, she required multiple hospitalizations due to encephalopathy.
Therefore, even if blood ammonia more accurately reflects systemic ammonia, breath measurements may prove more useful for encephalopathy monitoring. This is not only due to its logistic advantages including safety, non-invasiveness, and quick results, but also due to biological plausibility. Despite over 100 years of research, it remains somewhat unsettled as to whether venous measurement is an acceptable surrogate for arterial and whether measurement is an acceptable surrogate for NH3 measurement [24–27]. Less controversial, however, is the contention that NH3 is more clinically relevant, at least in the pathophysiology of HE among cirrhotic patients, since it more readily crosses the blood-brain barrier [28]. Breath-based assays may therefore provide an advantage because NH3 is measured. Indeed, some data suggest that breath ammonia correlates with HE [29].
Limitations
Our study has many important limitations, including single-center experience, time delay between breath and blood sample acquisition (approximately 30 min), and small sample size. Further, because our study recruitment required clinically stable participants, our ability to enroll individuals with high blood ammonia was limited. In order to participate, subjects were required to visit our testing facilities and repeatedly breathe for at least 10 s. Therefore, while formal encephalopathy testing was not included in our protocol, encephalopathy was unlikely because participants were required to successfully complete our breathing protocol. However, we note that several cirrhotic participants had blood ammonia elevated 3 to 5 times the upper limit of normal. This experience is at least consistent, therefore, with the possibility that the relatively lower breath ammonia measured in these same individuals may correlate better with systemic ammonia and encephalopathy. Finally, and perhaps most importantly, we did not measure other potentially important compounds (e.g. ALT and GGT).
We compared breath ammonia to venous blood ammonia as determined by a clinical laboratory. Prior studies have also attempted to correlate breath with blood ammonia. Not surprisingly, these efforts have not been uniformly successful [30, 31]. Significant differences in breath measurement technique, however, limit the usefulness of comparisons. For example, DuBois et al compared breath versus arterial ammonia `on the same day.' Further, their breath collection technique utilized 5 continuous minutes of breath sampling, and did not specify factors known to influence results such as mouth rinses [31].
These deficiencies are common in the development of breath assays. To our knowledge, there are no reports of multi-center or even multi-monitor breath ammonia trials. Rather, breath ammonia research is performed with unique prototype monitors in single-center studies on small numbers of subjects. Even within the same research group, follow-up studies are uncommon with the same monitor and measurement protocol. Furthermore, breath prototype monitors frequently use different measurement technologies such as methods based upon the use of quantum cascade lasers versus electronic sensors [29] without known comparability. Thus, breath ammonia research has failed to meet the rigor required for clinical development.
Although this lack of standardization and coordination is a shortcoming of breath compared to blood measurement, as reviewed extensively [32] blood assays are also subject to technical factors related to phlebotomy and blood specimen handling influence blood ammonia results, which may result in unpredictably elevated levels. These concerns have led, in part, to efforts to improve accuracy and reliability by various measurement strategies, including arterial sampling and partial pressure measurements, as opposed to standard venous sampling. However, this research has not led to meaningful changes in clinical practice and these random errors are likely magnified by the reality that best sample quality practices are frequently not followed [33].
In summary, there are multiple biologic explanations whereby individuals with cirrhosis may have a relative increase in blood versus breath ammonia. Future studies comparing breath to blood ammonia especially in patients with cirrhosis should prospectively evaluate these factors.
Future directions
Ammonia measurement research is challenging due to the lack of a gold standard and to the complexity of ammonia physiology, as it changes rapidly and involves multiple organ systems. Given the AASLD's non-endorsement of blood ammonia measurement in CLD, breath ammonia measurement may be a viable candidate. Topics to be addressed include the diagnostic accuracy of any measurement of systemic ammonia; the clinical utility of breath ammonia assays in the setting of CLD; and the potential application of breath ammonia as a more useful tool than blood ammonia measurement in the evaluation of other conditions, such as protein malnutrition or urea cycle disorders.
We believe that there is no a priori reason to assume that blood ammonia measurements are inherently more accurate or more useful than breath ammonia measurements. Rather, we hypothesize that breath and blood ammonia measurements are different and that, due to the inherent differences between breath and blood ammonia measurements, correlations are unlikely. Given the deficiencies in breath research to date, breath research protocols should strive to anchor endpoints to as many physiologic parameters as possible. This may require the use of blood assays, not only for ammonia, but also metabolites germane to ammonia physiology, such as glutamine, ALT, GGT, and urea. An improved understanding of the comparison of breath versus blood ammonia, including sources of each, requires more physiologic context. Furthermore, for breath ammonia measurement to mature into more widespread use, multi-center studies using identical monitors with standardized result reporting are needed. Collaborative efforts are essential [34]. The increased intensity of research effort of non-blood trace metabolite measurement techniques provides reasons for optimism [12, 35].
Acknowledgments
We wish to acknowledge Jill Stoltzfus, PhD, for ongoing statistical advice.
Funding This material is based upon work supported by the National Science Foundation under Grant No. EEC-0540832 and National Institute of Health under Grant No. R21AT1305.
References
- [1].Mpabanzi L, Olde Damink SWM, van de Poll MCG, Soeters PB, Jalan R, Dejong CHC. To pee or not to pee: ammonia hypothesis of hepatic encephalopathy revisited. Eur. J. Gastroenterol. Hepatol. 2011;23:449–54. doi: 10.1097/MEG.0b013e328346a7bd. [DOI] [PubMed] [Google Scholar]
- [2].Adeva MM, Souto G, Blanco N, Donapetry C. Ammonium metabolism in humans. Metabolism. 2012;61:1495–511. doi: 10.1016/j.metabol.2012.07.007. [DOI] [PubMed] [Google Scholar]
- [3].Yurdaydin C. Blood ammonia determination in cirrhosis: Still confusing after all these years? Hepatology. 2003;38:1307–10. [Google Scholar]
- [4].Brusilow S, Gordes E. Ammonia secretion in sweat. Am. J. Physiol. Leg. Content. 1968;214:513–7. doi: 10.1152/ajplegacy.1968.214.3.513. [DOI] [PubMed] [Google Scholar]
- [5].Huizenga JR, Tangerman A, Gips CH. Determination of ammonia in biological fluids. Ann. Clin. Biochem. 1994;31:529–43. doi: 10.1177/000456329403100602. [DOI] [PubMed] [Google Scholar]
- [6].Vilstrup H, Amodio P, Bajaj J, Cordoba J, Ferenci P, Mullen KD, Weissenborn K, Wong P. Hepatic encephalopathy in chronic liver disease: 2014 practice guideline by the American Association for the Study Of Liver Diseases and the European Association for the Study of the Liver. Hepatology. 2014;60:715–35. doi: 10.1002/hep.27210. [DOI] [PubMed] [Google Scholar]
- [7].Lewicki R, et al. Real time ammonia detection in exhaled human breath using a distributed feedback quantum cascade laser based sensor. Proc. SPIE. 2009;4945:K1–7. [Google Scholar]
- [8].Solga SF, Mudalel M, Spacek LA, Lewicki R, Tittel F, Loccioni C, Russo A, Risby TH. Factors influencing breath ammonia determination. J. Breath Res. 2013;7:037101. doi: 10.1088/1752-7155/7/3/037101. [DOI] [PubMed] [Google Scholar]
- [9].Spacek LA, Mudalel ML, Lewicki R, Tittel FK, Risby TH, Stoltzfus J, Munier JJ, Solga SF. Breath ammonia and ethanol increase in response to a high protein challenge. Biomarkers. 2015;20:149–56. doi: 10.3109/1354750X.2015.1040840. [DOI] [PubMed] [Google Scholar]
- [10].Solga SF, Mudalel M, Spacek LA, Lewicki R, Tittel FK, Loccioni C, Russo A, Ragnoni A, Risby TH. Changes in the concentration of breath ammonia in response to exercise: a preliminary investigation. J. Breath Res. 2014;8:037103. doi: 10.1088/1752-7155/8/3/037103. [DOI] [PubMed] [Google Scholar]
- [11].Chen W, Metsälä M, Vaittinen O, Halonen L. The origin of mouth-exhaled ammonia. J. Breath Res. 2014;8:036003. doi: 10.1088/1752-7155/8/3/036003. [DOI] [PubMed] [Google Scholar]
- [12].Mochalski P, King J, Klieber M, Unterkofler K, Hinterhuber H, Baumann M, Amann A. Blood and breath levels of selected volatile organic compounds in healthy volunteers. Analyst. 2013;138:2134–45. doi: 10.1039/c3an36756h. [DOI] [PMC free article] [PubMed] [Google Scholar]
- [13].ATS/ERS recommendations for standardized procedures for the online and offline measurement of exhaled lower respiratory nitric oxide and nasal nitric oxide, 2005. Am. J. Respir. Crit. Care Med. 2005;171:912–30. doi: 10.1164/rccm.200406-710ST. Anon. [DOI] [PubMed] [Google Scholar]
- [14].Solga SF, Mudalel M, Spacek LA, Risby TM. Fast and accurate exhaled breath ammonia measurement. J. Vis. Exp. 2014 Jun 11;(88) doi: 10.3791/51658. [DOI] [PMC free article] [PubMed] [Google Scholar]
- [15].Cope KA, Watson MT, Foster WM, Sehnert SS, Risby TH. Effects of ventilation on the collection of exhaled breath in humans. J. Appl. Physiol. 2004;96:1371–9. doi: 10.1152/japplphysiol.01034.2003. [DOI] [PubMed] [Google Scholar]
- [16].Cope K, Risby T, Diehl AM. Increased gastrointestinal ethanol production in obese mice: implications for fatty liver disease pathogenesis. Gastroenterology. 2000;119:1340–7. doi: 10.1053/gast.2000.19267. [DOI] [PubMed] [Google Scholar]
- [17].Amano A, Yoshida Y, Oho T, Koga T. Monitoring ammonia to assess halitosis. Oral Surg. Oral Med. Oral Pathol. Oral Radiol. Endodontol. 2002;94:692–6. doi: 10.1067/moe.2002.126911. [DOI] [PubMed] [Google Scholar]
- [18].Nikolac N, Omazic J, Simundic A-M. The evidence based practice for optimal sample quality for ammonia measurement. Clin. Biochem. 2014;47:991–5. doi: 10.1016/j.clinbiochem.2014.05.068. [DOI] [PubMed] [Google Scholar]
- [19].Conigrave KM, Davies P, Haber P, Whitfield JB. Traditional markers of excessive alcohol use. Addiction. 2003;98:31–43. doi: 10.1046/j.1359-6357.2003.00581.x. [DOI] [PubMed] [Google Scholar]
- [20].Elawdi HA, Franzini M, Paolicchi A, Emdin M, Fornaciari I, Fierabracci V, De Simone P, Carrai P, Filipponi F. Circulating gamma-glutamyltransferase fractions in cirrhosis. Liver Int. 2014;34:e191–9. doi: 10.1111/liv.12455. [DOI] [PubMed] [Google Scholar]
- [21].Vorobioff JD, Groszmann RJ. Prevention of portal hypertension: from variceal development to clinical decompensation. Hepatology. 2015;61:375–81. doi: 10.1002/hep.27249. [DOI] [PMC free article] [PubMed] [Google Scholar]
- [22].Noiret L, Baigent S, Jalan R. Arterial ammonia levels in cirrhosis are determined by systemic and hepatic hemodynamics, and by organ function: a quantitative modelling study. Liver Int. 2014;34:e45–55. doi: 10.1111/liv.12361. [DOI] [PubMed] [Google Scholar]
- [23].Boyer TD, Haskal ZJ. The role of transjugular intrahepatic portosystemic shunt (TIPS) in the management of portal hypertension: update 2009. Hepatology. 2010;51:306. doi: 10.1002/hep.23383. [DOI] [PubMed] [Google Scholar]
- [24].Kramer L, Tribl B, Gendo A, Zauner C, Schneider B, Ferenci P, Madl C. Partial pressure of ammonia versus ammonia in hepatic encephalopathy. Hepatology. 2000;31:30–4. doi: 10.1002/hep.510310107. [DOI] [PubMed] [Google Scholar]
- [25].Nicolao F, Efrati C, Masini A, Merli M, Attili AF, Riggio O. Role of determination of partial pressure of ammonia in cirrhotic patients with and without hepatic encephalopathy. J. Hepatol. 2003;38:441–6. doi: 10.1016/s0168-8278(02)00436-1. [DOI] [PubMed] [Google Scholar]
- [26].Ong JP, Aggarwal A, Krieger D, Easley KA, Karafa MT, Van Lente F, Arroliga AC, Mullen KD. Correlation between ammonia levels and the severity of hepatic encephalopathy. Am. J. Med. 2003;114:188–93. doi: 10.1016/s0002-9343(02)01477-8. [DOI] [PubMed] [Google Scholar]
- [27].Warren KS. Ammonia toxicity and pH. Nature. 1962;195:47–9. doi: 10.1038/195047a0. [DOI] [PubMed] [Google Scholar]
- [28].Bismuth M, Funakoshi N, Cadranel J-F, Blanc P. Hepatic encephalopathy: from pathophysiology to therapeutic management. Eur. J. Gastroenterol. Hepatol. 2011;23:8–22. doi: 10.1097/MEG.0b013e3283417567. [DOI] [PubMed] [Google Scholar]
- [29].Adrover R, Cocozzella D, Ridruejo E, García A, Rome J, Podestá JJ. Breath-ammonia testing of healthy subjects and patients with cirrhosis. Dig. Dis. Sci. 2012;57:189–95. doi: 10.1007/s10620-011-1858-9. [DOI] [PubMed] [Google Scholar]
- [30].Shimamoto C, Hirata I, Katsu K. Breath and blood ammonia in liver cirrhosis. Hepatogastroenterology. 2000;47:443–5. [PubMed] [Google Scholar]
- [31].DuBois S, Eng S, Bhattacharya R, Rulyak S, Hubbard T, Putnam D, Kearney DJ. Breath ammonia testing for diagnosis of hepatic encephalopathy. Dig. Dis. Sci. 2005;50:1780–4. doi: 10.1007/s10620-005-2937-6. [DOI] [PubMed] [Google Scholar]
- [32].Blanco Vela CI, Bosques Padilla FJ. Determination of ammonia concentrations in cirrhosis patients-still confusing after all these years? Ann. Hepatol. 2011;10:S60–5. [PubMed] [Google Scholar]
- [33].Simundic A-M, et al. Compliance of blood sampling procedures with the CLSI H3-A6 guidelines: an observational study by the European Federation of Clinical Chemistry and Laboratory Medicine (EFLM) working group for the preanalytical phase (WG-PRE) Clin. Chem. Lab. Med. 2014 doi: 10.1515/cclm-2014-1053. [DOI] [PubMed] [Google Scholar]
- [34].Dweik RA. The great challenge for exhaled breath analysis: embracing complexity, delivering simplicity. J. Breath Res. 2011;5:030201. doi: 10.1088/1752-7155/5/3/030201. [DOI] [PMC free article] [PubMed] [Google Scholar]
- [35].De Lacy Costello B, Amann A, Al-Kateb H, Flynn C, Filipiak W, Khalid T, Osborne D, Ratcliffe NM. A review of the volatiles from the healthy human body. J. Breath Res. 2014;8:014001. doi: 10.1088/1752-7155/8/1/014001. [DOI] [PubMed] [Google Scholar]