Abstract
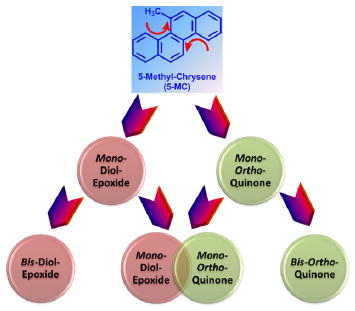
Exposure to polycyclic aromatic hydrocarbons (PAHs) in the food chain is the major human health hazard associated with the Deepwater Horizon oil spill. C1-chrysenes are representative PAHs present in the crude oil and have been detected in contaminated sea food in amounts that exceed their permissible safety thresholds. We describe the metabolism of the most carcinogenic C1-chrysene regioisomer, 5-methylchrysene (5-MC), in human HepG2 cells. The structures of the metabolites were identified by HPLC-UV-fluorescence detection and LC-MS/MS. 5-MC-tetraol, a signature metabolite of the diol-epoxide pathway, was identified as reported previously. Novel O-monosulfonated-5-MC-catechol isomers and O-monomethyl-O-monosulfonated-5-MC-catechol were discovered, and evidence for their precursor ortho-quinones was obtained. The identities of O-monosulfonated-5-MC-1,2-catechol, O-monomethyl-O-monosulfonated-5-MC-1,2-catechol, and 5-MC-1,2-dione were validated by comparison to authentic synthesized standards. Dual metabolic activation of 5-MC involving the formation of bis-electrophiles, i.e., a mono-diol-epoxide and a mono-ortho-quinone within the same structure, bis-diol-epoxides, and bis-ortho-quinones is reported for the first time. Evidence was also obtained for minor metabolic conversion of 5-MC to form monohydroxylated-quinones and bis-phenols. The identification of 5-MC-tetraol, O-monosulfonated-5-MC-1,2-catechol, O-monomethyl-O-monosulfonated-5-MC-1,2-catechol, and 5-MC-1,2-dione supports metabolic activation of 5-MC by P450 and AKR isozymes followed by metabolic detoxification of the ortho-quinone through interception of redox cycling by COMT and SULT isozymes. The major metabolites, O-monosulfonated-catechols and tetraols, could be used as biomarkers of human exposure to 5-MC resulting from oil spills.
INTRODUCTION
The Deepwater Horizon oil spill in the Gulf of Mexico in 2010 was the largest release of crude oil in U.S. history.1,2 Polycyclic aromatic hydrocarbons (PAHs) are among the most toxic and persistent components of crude oil.3 Compositional analysis of the crude oil released identified C1-chrysenes (methyl-chrysenes) as an abundant group of petrogenic PAHs.4 Contamination of the food chain with petrogenic PAHs is a great concern related to human health.5 A recent study demonstrated that the concentrations of C1-chrysenes measured from contaminated sea food were 3800-fold higher than the permissible threshold for human consumption recommended by U.S. Environmental Protection Agency (EPA).6 Among the six regioisomers of C1-chrysenes, 5-methylchrysene (5-MC) was recognized as the most potent carcinogen and tumor initiator in mice.7
The toxicity of 5-MC has been associated with metabolic activation mainly via a traditional diol-epoxide pathway in rat and mouse liver S9 fractions, rat liver microsomes, and mouse epidermis as well as in human liver and lung microsomes.8-12 In this pathway, 5-MC is activated by P450 1A1 to yield the major proximate carcinogen, 5-MC-1R,2R-diol, which is further converted to the major ultimate carcinogen, 5-MC-1R,2S-diol-3S,4R-epoxide.8-12 This diol-epoxide forms stable N2-2′-deoxyguanosine (dGuo) adducts in vitro and in vivo,13-18 which leads to G to T transversions and other mutations.19 Another pathway of metabolic activation for 5-MC in mouse skin, whereby hydroxylation on the methyl group catalyzed by P450 3A4 to produce 5-hydroxy-5-MC followed by formation of the activated sulfate ester leads to deoxyadenosine DNA adducts, was proposed.20-22 However, the formation of 5-hydroxy-5-MC was minimal in most human liver microsomes and was not detected in human lung microsomes.11
Human liver is the major target organ for exposure to 5-MC following ingestion. Nevertheless, the metabolism of 5-MC in a human liver cell-based system has not been reported so far. The goal of the present study was to explore the metabolism of 5-MC in human hepatoma (HepG2) cells as a model for primary human hepatocytes.
It was found that the metabolism of 5-MC involved the formation of a diol-epoxide and the formation of an ortho-quinone, and we detected the formation of bis-electrophiles for the first time. Bis-electrophiles involved the formation of a diol-epoxide and an ortho-quinone on different terminal rings within the same structure, the formation of bis-diol-epoxides, and the formation of bis-ortho-quinones. Minor pathways included the formation of a monohydroxylated quinone and the formation of a bis-phenol. We conclude that the diol-epoxide pathway, the ortho-quinone pathway, and their combination likely lead to the metabolic activation of 5-MC following ingestion. O-Monosulfonated-5-MC-catechol conjugates and tetraols were the major metabolites and thus represent human exposure biomarkers for 5-MC and alkylated-PAHs in general that may result from consuming sea food contaminated by crude oil spills.
MATERIALS AND METHODS
Caution: All PAHs are potentially hazardous and should be handled in accordance with the National Institutes of Health Guidelines for the Laboratory Use of Chemical Carcinogens.
Chemicals and Reagents
Cell culture media and reagents were purchased from Invitrogen Co. (Carlsbad, CA). Fetal bovine serum (FBS) was purchased from Hyclone (Logan, UT). Human recombinant uridine 5′-diphospho-glucuronosyltransferases (UGT) 2B7 Supersomes (microsomes from baculovirus-infected insect cells expressing UGTs) were purchased from BD Biosciences (San Jose, CA). Human recombinant sulfotransferases (SULT) 1A1 and human recombinant catechol-O-methyltransferase (COMT) were expressed and purified as described by us.23,24 5-MC, dithiothreitol, uridine-5′-diphosphoglucuronic acid (UDPGA), adenosine 3′-phosphate 5′-phosphosulfate (PAPS), and S-(5′-adenosyl)-l-methionine (AdoMet) chloride were purchased from Sigma-Aldrich Co. (St. Louis, MO). 5-MC-1,2-dione was purchased from MRIGlobal Chemical Carcinogen Repository (Kansas City, MO). 5-Hydroxy-5-MC and 7-hydroxy-5-MC were synthesized as described in the Supporting Information. All solvents were HPLC grade, and all other chemicals used were of the highest grade available.
Enzymatic Synthesis of 5-MC-1,2-Catechol Conjugates
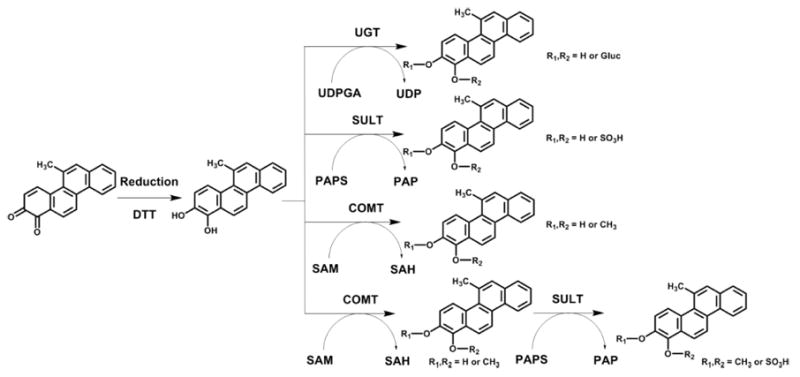
Synthetic routes to four 5-MC-1,2-catechol conjugates are shown in Scheme 1. Experiments were conducted anaerobically in a glovebox purged with argon as described so that 5-MC-1,2-dione could be reduced with dithiothreitol to the catechol.23-25 We chose human recombinant UGT2B7 and SULT1A1 as the conjugating enzymes because they were the preferred isoforms to form conjugates with benzo[a]pyrene-7,8-catechol in our previous studies.24,25 The reaction conditions for monoglucuronidation, monosulfonation, monomethylation, and bis-conjugation (i.e., monomethylation followed by monosulfonation) of 5-MC-1,2-catechol were the same as described previously,26 except that the substrate was replaced by 5-MC-1,2-dione. The negative controls of the four conjugations were prepared without the addition of the respective cofactors. The reaction mixtures were quenched and extracted as described previously26 and subsequently analyzed by HPLC-UV-Fluorescence (FLR) detection and LC-MS/MS as described below.
Scheme 1. Synthetic Routes of Four 5-MC-1,2-Catechol Conjugates.
Cell Culture
HepG2 (human hepatocellular carcinoma) cells were obtained from American Type Culture Collection and maintained in minimum essential medium (MEM) with 10% heat-inactivated FBS, 2 mM l-glutamine, 100 units/mL penicillin, and 100 μg/mL streptomycin. Cells were incubated at 37 °C in a humidified atmosphere containing 5% CO2 and were passaged every week at a dilution of 1:7. Cultured cells with a passage number of 10–20 were used in the experiments to reduce variability due to long-term culture conditions. Cultured cells were authenticated by short-terminal repeat DNA analysis and were mycoplasma-free (DNA Diagnostics Center Medical, Fairfield, OH).
Detection and Identification of 5-MC Metabolites in HepG2 Cells
Confluent HepG2 cells were plated in a 6-well plate (~5 × 10⁶). The cells were washed twice and then treated with MEM (without phenol red) containing 10 mM glucose and 1 μM 5-MC (DMSO, 0.2% v/v). The culture media were collected at 0 and 24 h and subsequently acidified with 0.1% formic acid (v/v) before extraction twice with a 1.5-fold volume of cold H2O-saturated ethyl acetate. The combined organic phases were dried under vacuum, and the residue was reconstituted in methanol (150 μL) and subjected to the following analysis. The resultant aqueous phases were not processed further.
For HPLC-UV-FLR analysis, an aliquot (10 μL) of the reconstituted solution was injected on a tandem Waters Alliance 2695 chromatographic system with a Waters 2996 photodiode array (PDA) detector and a Waters 2475 multi λ FLR detector (Waters Corporation, Milford, MA). Chromatographic separation was achieved on a Zorbax-ODS C18 analytical column (5 μm, 4.6 mm × 250 mm) with a Zorbax-ODS analytical guard column (5 μm, 4.6 mm × 12.5 mm) (DuPont Co., Wilmington, DE) at a room temperature. Mobile phase A was H2O with 5 mM ammonium acetate and 0.1% trifluoroacetic acid (TFA) (v/v), and mobile phase B was acetonitrile with 5 mM ammonium acetate and 0.1% TFA (v/v). The flow rate was set at 0.5 mL/min. Analytes were eluted with a linear gradient from 5% B to 95% B (v/v) in 30 min, followed by an isocratic hold at 95% B (v/v) for 10 min. At 40 min, B was returned to 5% (v/v) in 1 min and the column was equilibrated for 19 min before the next injection. The total run time for each analysis was 60 min. Eluants from the column were introduced sequentially into the PDA detector and the FLR detector. Excitation (λex) and emission (λem) wavelengths for the FLR detector were set at 273 and 391 nm, respectively, based on the spectral properties of 5-MC.
For ion trap LC-MS/MS analysis, an aliquot (10 μL) of the reconstituted solution was injected on a Waters Alliance 2690 HPLC system (Waters Corporation, Milford, MA) interfaced with a Finnigan LTQ linear ion trap mass spectrometer (Thermo Fisher Scientific, San Jose, CA). The column, mobile phase, flow rate, and linear gradient elution were the same as described above. To prevent extraneous material from entering the mass spectrometer, the first 10 min of the column eluant was diverted to waste. After that time, the eluants were monitored by the mass spectrometer operated in both positive and negative ion modes with an electrospray ionization (ESI) source. The combination of product ion scan (MS2), MS/MS/MS (MS3), and pseudo selected reaction monitoring (SRM) were utilized to analyze the eluants. The mass spectrometry parameters, including spray voltage (3 kV in positive ion mode; 5 kV in negative ion mode), sheath gas flow rate (40 arbitrary units in both ion modes), auxiliary gas flow rate (15 arbitrary units in both ion modes), capillary temperature (275 °C in both ion modes), capillary voltage (38 V in positive ion mode; −19 V in negative ion mode), and tube lens (20 V in positive ion mode; −22.05 V in negative ion mode), were automatically optimized with a 5-MC standard solution in methanol. An isolation width of three bracketed around the m/z of interest, activation Q of 0.25, and activation time of 30 ms were used for data acquisition. Xcalibur software, version 2.0 (Thermo Fisher Scientific, San Jose, CA), was used to control the ion-trap LC-MS/MS system and to process data.
In some instances, another aliquot (5 μL) of the reconstituted solution was injected on a nano-Acquity ultra-performance liquid chromatography (UPLC) system (Waters Corporation, Milford, MA) equipped with a LTQ Orbitrap XL mass spectrometer (Thermo Fisher Scientific, San Jose, CA). Chromatographic separation was achieved on a nano-UPLC C18 column (1.7 μm BEH130, 150 μm × 100 mm) (Waters Corporation, Milford, MA) at 50 °C. Mobile phase A was H2O with 0.1% formic acid (v/v), and mobile phase B was acetonitrile with 0.1% formic acid (v/v). The flow rate was set at 1.6 μL/min. Following an isocratic hold at 5% B (v/v) for 5 min, a linear gradient of 5% to 95% B (v/v) was run over 30 min, followed by an isocratic hold at 95% B (v/v) for another 10 min. At 46 min, B was returned to 5% (v/v) in 2 min and the column was equilibrated for 12 min before the next injection. The total run time for each analysis was 60 min. The mass spectrometer was operated in positive and negative ion modes with a nano-electrospray ionization (nano-ESI) source after accurate calibration with the manufacturer’s calibration mixture. The ionization voltage was set to 1.5 kV, and the capillary temperature was set to 200 °C. Full scan spectra were acquired with a resolving power of 60 000 full width at half-maximum in a mass range from m/z 100 to 800. Xcalibur software, version 2.0 (Thermo Fisher Scientific, San Jose, CA), was used to control the Orbitrap mass spectrometer and to process data.
RESULTS
Rationale
The metabolism of 1 μM 5-MC in HepG2 cells was selected for the following reasons. One micromolar 5-MC is a reasonable concentration based on estimates of levels of C1-chrsyenes that may be consumed in contaminated sea food.6 In addition, 1 μM 5-MC was chosen since this is much lower than the reported Km values for P450 1A1 and 1B1, which have been implicated in its metabolic activation, to ensure that these enzymes are not saturated.27 We also chose HepG2 cells over human hepatocytes since the latter are limited due to scarce availability, shorter life span, phenotypic instability, and higher individual variability. The metabolites of 5-MC in human HepG2 cells were detected and identified by HPLC-UV-FLR and ion-trap LC-MS/MS. The relative quantitation of the 5-MC metabolites of interest were obtained from the peak areas on the UV and FLR chromatograms. Preliminary information on 5-MC metabolite structures was obtained by interpreting the corresponding MS2 and MS3 spectra of 5-MC metabolites from ion-trap LC-MS/MS. Subsequently, we validated the identities of 5-MC metabolites through a comparison to authentic standards synthesized either chemically or enzymatically.
The optimal pair of λex and λem of 5-MC (Figure S1) was employed to detect its metabolites based on the assumption that most 5-MC metabolites show fluorescence signals under these wavelengths. In our pilot studies of 5-MC metabolism in human HepG2 cells, it was found that most 5-MC metabolites were observed in the organic phase of the extracted media rather than the organic phase of extracted cell pellets and that the most comprehensive metabolite profile from the extracted media was obtained at 24 h (data not shown). Therefore, human HepG2 cells treated with 5-MC at 24 h were selected to identify metabolites.
Four possible routes for 5-MC metabolism were considered to detect and identify metabolites. First, we predicted the diol-epoxide pathway, involving conversion of 5-MC to trans-dihydrodiols followed by formation of diol-epoxides, which can be hydrolyzed to the corresponding tetraols. Second, we predicted the ortho-quinone pathway, involving conversion of trans-dihydrodiols to catechols followed by either formation of phase II conjugates or their oxidation to ortho-quinones, which could be reduced back to the catechols to establish redox cycling. Third, as 5-MC contains two bay regions within its structure, a combination of these two metabolic pathways was also predicted. Lists of the potential metabolites of 5-MC were used to detect bis-electrophiles containing both a diol-epoxide and an ortho-quinone within the same structure in Table 1, the formation of bis-diol-epoxides in Table 2, and the formation of bis-ortho-quinones in Table 3. Fourth, we also predicted that hydroxylation on either the chrysene ring or 5-methyl group side chain followed by formation of phase II conjugates could be another metabolic pathway. On the basis of these predictions, the metabolites of 5-MC were identified.
Table 1.
Accurate Masses of Potential 5-MC Metabolites in HepG2 Cells That Result from the Formation of Bis-Electrophiles Containing both a Diol-Epoxide and an Ortho-Quinone
| 5-MC metabolites | molecular formula | positive mode | negative mode |
|---|---|---|---|
| Tetraol + O-quinone | C19H16O6 | 341.1025 | 339.0869 |
| Monodehydrated tetraol + O-quinone | C19H14O5 | 323.0919 | 321.0763 |
| Bis-dehydrated tetraol + O-quinone | C19H12O4 | 305.0814 | 303.0657 |
| Tetraol + O-methyl catechol | C20H20O6 | 357.1338 | 355.1182 |
| Monodehydrated tetraol + O-methyl catechol | C20H18O5 | 339.1232 | 337.1076 |
| Bis-dehydrated tetraol + O-methyl catechol | C20H16O4 | 321.1127 | 319.0970 |
| Tetraol + O-sulfonated catechol | C19H18O9S | 423.0750 | 421.0593 |
| Monodehydrated tetraol + O-sulfonated catechol | C19H16O8S | 405.0644 | 403.0488 |
| Bis-dehydrated tetraol + O-sulfonated catechol | C19H14O7S | 387.0538 | 385.0382 |
| Tetraol + O-glucuronosyl catechol | C25H26O12 | 519.1503 | 517.1346 |
| Monodehydrated tetraol + O-glucuronosyl catechol | C25H24O11 | 501.1397 | 499.1240 |
| Bis-dehydrated tetraol + O-glucuronosyl catechol | C25H22O10 | 483.1291 | 481.1135 |
| Tetraol + O-methyl-O-sulfonated catechol | C20H20O9S | 437.0906 | 435.0750 |
| Monodehydrated tetraol + O-methyl-O-sulfonated catechol | C20H18O8S | 419.0801 | 417.0644 |
| Bis-dehydrated tetraol + O-methyl-O-sulfonated catechol | C20H16O7S | 401.0695 | 399.0538 |
Table 2.
Accurate Masses of Potential 5-MC Metabolites in HepG2 Cells That Result from the Formation of Bis-Diol-Epoxides
| 5-MC metabolites | molecular formula | positive mode | negative mode |
|---|---|---|---|
| Tetraol + Tetraol | C19H22O8 | 379.1393 | 377.1236 |
| Monodehydrated tetraol + Tetraol | C19H20O7 | 361.1287 | 359.1131 |
| Monodehydrated tetraol + Monodehydrated tetraol | C19H18O6 | 343.1182 | 341.1025 |
| (or Bis-dehydrated tetraol + Tetraol) | |||
| Monodehydrated tetraol + Bis-dehydrated tetraol | C19H16O5 | 325.1076 | 323.0919 |
| Bis-dehydrated tetraol + Bis-dehydrated tetraol | C19H14O4 | 307.0970 | 305.0814 |
| Tetraol + O-sulfonated tetraol | C19H22O11S | 459.0961 | 457.0805 |
| Monodehydrated tetraol + O-sulfonated tetraol | C19H20O10S | 441.0855 | 439.0699 |
| Monodehydrated tetraol + Monodehydrated O-sulfonated tetraol | C19H18O9S | 423.0750 | 421.0593 |
| (or Bis-dehydrated tetraol + O-sulfonated tetraol) | |||
| Monodehydrated tetraol + Bis-dehydrated O-sulfonated tetraol | C19H16O8S | 405.0644 | 403.0488 |
| Bis-dehydrated tetraol + Bis-dehydrated O-sulfonated tetraol | C19H14O7S | 387.0538 | 385.0382 |
| Tetraol + O-glucuronosyl tetraol | C25H30O14 | 555.1714 | 553.1557 |
| Monodehydrated tetraol + O-glucuronosyl tetraol | C25H28O13 | 537.1608 | 535.1452 |
| Monodehydrated tetraol + Monodehydrated O-glucuronosyl tetraol | C25H26O12 | 519.1503 | 517.1346 |
| (or Bis-dehydrated tetraol + O-glucuronosyl tetraol) | |||
| Monodehydrated tetraol + Bis-dehydrated O-glucuronosyl tetraol | C25H24O11 | 501.1397 | 499.1240 |
| Bis-dehydrated tetraol + Bis-dehydrated O-glucuronosyl tetraol | C25H22O10 | 483.1291 | 481.1135 |
Table 3.
Accurate Masses of Potential 5-MC Metabolites in HepG2 Cells That Result from the Formation of Bis-Ortho-Quinones
| 5-MC metabolites | molecular formula | positive mode | negative mode |
|---|---|---|---|
| O-quinone + O-quinone | C19H10O4 | 303.0657 | 301.0501 |
| O-quinone + O-methyl catechol | C20H14O4 | 319.0970 | 317.0814 |
| O-quinone + O-sulfonated catechol | C19H12O7S | 385.0382 | 383.0225 |
| O-quinone + O-glucuronosyl catechol | C25H20O10 | 481.1135 | 479.0978 |
| O-quinone + O-methyl-O-sulfonated catechol | C20H14O7S | 399.0538 | 397.0382 |
| O-methyl catechol + O-methyl catechol | C21H18O4 | 335.1283 | 333.1127 |
| O-methyl catechol + O-sulfonated catechol | C20H16O7S | 401.0695 | 399.0538 |
| O-methyl catechol + O-glucuronosyl catechol | C26H24O10 | 497.1448 | 495.1291 |
| O-sulfonated catechol + O-sulfonated catechol | C19H14O10S2 | 467.0107 | 464.9950 |
| O-sulfonated catechol + O-glucuronosyl catechol | C25H22O13S | 563.0859 | 561.0703 |
| O-glucuronosyl catechol + O-glucuronosyl catechol | C31H30O16 | 659.1612 | 657.1456 |
Detection of 5-MC Metabolites in HepG2 Cells by HPLC-UV-FLR
Comparison of UV chromatograms at λmax 268 nm of the 0 h (Figure 1A) and 24 h (Figure 1B) chromatographic runs showed that ten metabolites of 5-MC were detected in the organic phase of the ethyl acetate-extracted, acidified media from HepG2 cells. The corresponding UV spectra of these ten metabolites were extracted from the PDA detector and are shown in Figure S2. The peak with a retention time of 40.48 min at 0 h was attributed to 5-MC, but it was almost absent at 24 h, suggesting that 5-MC was rapidly metabolized by HepG2 cells over this time course.
Figure 1.
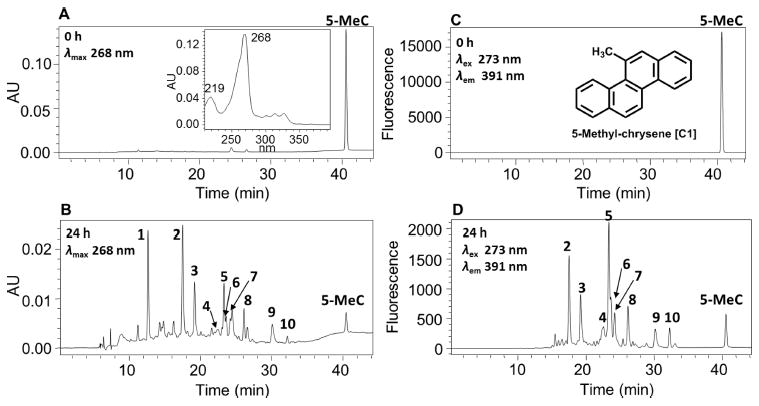
HPLC detection of 5-MC metabolites in human HepG2 cells. (A) UV chromatogram at λmax 268 nm at 0 h. (B) UV chromatogram at λmax 268 nm at 24 h. (C) FLR chromatogram at λex 273 nm and λem 391 nm at 0 h. (D) FLR chromatogram at λex 273 nm and λem 391 nm at 24 h. Human HepG2 cells (~5 × 10⁶) were treated with 5-MC (1 μM, 0.2% (v/v) DMSO) in MEM (without phenol red) containing 10 mM glucose. The cell media were collected at 0 and 24 h and subsequently acidified with 0.1% formic acid before extraction with ethyl acetate. The extracts were analyzed on a HPLC-UV-FLR. 5-MeC = 5-methylchrysene.
Comparison of FLR chromatograms at λex 273 nm and λem 391 nm of the 0 h (Figure 1C) and 24 h (Figure 1D) chromatographic runs showed that there were nine fluorescence peaks in Figure 1D corresponding to metabolites 2–10 in Figure 1B, thus validating that these peaks were derived from 5-MC. The peak corresponding to metabolite 1 with a retention time of 12.62 min was detected only in the UV chromatogram (Figure 1B) but not in the FLR chromatogram (Figure 1D), suggesting the loss of the 5-MC ring fluorophore.
Identification of 5-MC-Tetraol
Monodehydrated 5-MC-tetraol was detected in the culture media from HepG2 cells following treatment with 1 μM 5-MC for 24 h. One peak with a retention time of 17.39 min was detected by monitoring the MS2 chromatograms (m/z 293) at 0 and 24 h in positive ion mode (Table 4). The corresponding MS2 spectrum (m/z 293) of this metabolite showed the sequential loss of H2O (18 amu) and CO (28 amu) from the protonated molecular ion (Table 4). Comparison of the retention time of monodehydrated 5-MC-tetraol with metabolite 2 on HPLC-UV-FLR in Figure 1 showed excellent agreement.
Table 4.
Mass Transitions for 5-Methylchrysene Metabolites in HepG2 Cells
| metabolite No. | 5-MC metabolites | retention time (min) | mode | m/z |
|---|---|---|---|---|
| 2 | Monodehydrated tetraol | 17.39 | positive | 293 [M + H]+, |
| 275 [M + H − H2O]+, | ||||
| 247 [M + H − H2O − CO]+, | ||||
| 257 [M + H − 2H2O]+, | ||||
| 229 [M + H − 2H2O − CO]+ | ||||
| 3, 5, 6 | O-sulfonated catechol | 18.94, 19.46, 22.52, 22.88, 23.18 | negative | 353 [M − H]−, |
| 273 [M − H − SO3]−, | ||||
| 245 [M − H − SO3 − CO]−, | ||||
| 229 [M − 2H − SO3 − CO − CH3]− | ||||
| 4 | O-methyl-O-sulfonated catechol | 22.54 | negative | 367 [M − H]−, |
| 287 [M − H − SO3]−, | ||||
| 272 [M − H − SO3 − CH3]− | ||||
| − | Ortho-quinone | 31.98 | positive | 273 [M + H]+, |
| 245 [M + H − CO]+, | ||||
| 227 [M + H − CO − H2O]+, | ||||
| 217 [M + H − 2CO]+, | ||||
| 202 [M + H − 2CO − CH3]+ | ||||
| 10 | Monohydroxy-quinone | 31.38 | positive | 289 [M + H]+, |
| 271 [M + H − H2O]+, | ||||
| 260 [M + H − CO − •H]+, | ||||
| 232 [M + H − 2CO − •H]+, | ||||
| 219 [M + H − CO − •CH═C═O − •H]+ | ||||
| − | Dehydrated O-sulfonated dihydrodiol | 22.01 | negative | 337 [M − H]−, |
| 257 [M − H − SO3]−, | ||||
| 242 [M − H − SO3 − CH3]− | ||||
| 8, 9 | Bis-phenol | 26.96, 29.93 | positive | 275 [M + H]+, |
| 257 [M + H − H2O]+, | ||||
| 246 [M + H − CO − •H]+, | ||||
| 229 [M + H − H2O − CO]+ |
A single isomer of a monodehydrated 5-MC-tetraol and a single isomer of a bis-dehydrated 5-MC-tetraol were both detected in HepG2 cells with identical retention times by monitoring the extracted ion chromatograms of the Orbitrap full scan at 0 and 24 h in the positive ion mode (Figure S3). A single isomer of an intact 5-MC-tetraol was detected in HepG2 cells that had the same retention time as these two dehydrated products by monitoring the extracted ion chromatograms of the Orbitrap full scan at 0 and 24 h in negative ion mode (Figure S3). Because 5-MC is asymmetric, there are two possible regioisomeric 5-MC-tetraols: those that come from 5-MC-trans-1,2-dihydrodiol and those that come from 5-MC-trans-7,8-dihydrodiol. However, on the basis of literature precedent,8-12 we assume that 5-MC-trans-1,2-dihydrodiol is formed to yield the corresponding diol-epoxide and tetraol. The resulting tetraol and its absolute configuration cannot be assigned using mass spectrometry. Identification of tetraol indicated the occurrence of the diol-epoxide pathway for the metabolic activation of 5-MC in HepG2 cells.
Identification of O-Monosulfonated-5-MC-1,2-Catechol
O-Monosulfonated-5-MC-catechol isomers were detected in the culture media from HepG2 cells following treatment with 1 μM 5-MC for 24 h. Five isomer peaks at 18.94, 19.46, 22.52, 22.88, 23.18 min were detected by monitoring the MS3 chromatograms (m/z 353 → 273 →) at 0 h (Figure 2A) and 24 h (Figure 2B) in the negative ion mode. The corresponding MS2 spectra (m/z 353) of these five metabolites showed the characteristic loss of sulfate (80 amu) from the deprotonated molecular ion and a representative MS2 spectrum of the metabolite with a retention time of 22.88 min is shown in Figure 2C. The MS3 spectrum (m/z 353 → 273 →) of this metabolite showed the subsequent loss of one CO group followed by loss of one CH3 group and one hydrogen (Figure 2D). Comparing the retention times of O-monosulfonated-5-MC-catechol isomers at 18.94, 22.88, 23.18 min with metabolites 3, 5, and 6 on HPLC-UV-FLR in Figure 1 showed that they were in agreement. The specific position of catechol conjugation could not be assigned using mass spectrometry and thus we enzymatically synthesized the 5-MC-catechol-O-sulfate conjugate standards as follows.
Figure 2.
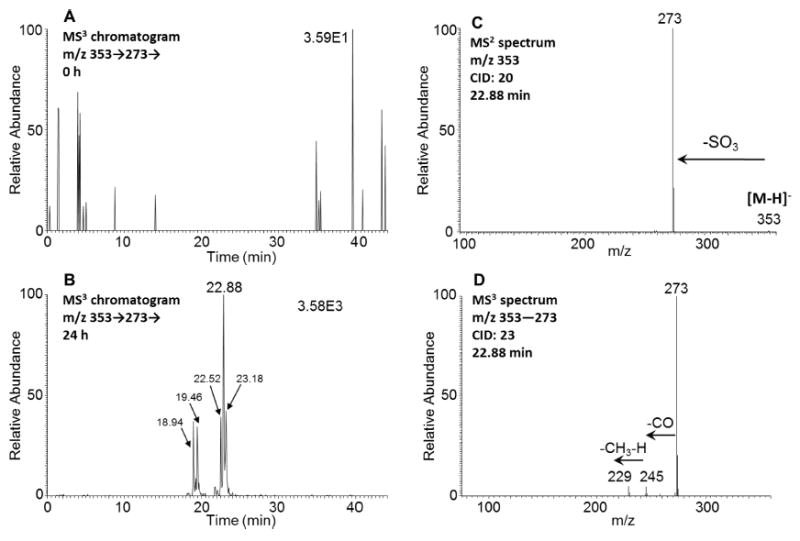
Detection of O-monosulfonated-5-MC-catechol isomers in human HepG2 cells. (A) MS3 chromatogram at 0 h. (B) MS3 chromatogram at 24 h. (C) MS2 spectrum of the peak at 22.88 min. (D) MS3 spectrum of the peak at 22.88 min. The samples were prepared as described in the caption to Figure 1 and were subsequently analyzed on an ion-trap LC-MS/MS.
In order to generate the O-monosulfonated-5-MC-1,2-catechol standards, 5-MC-1,2-dione was reduced by dithio-threitol followed by phase II conjugation catalyzed by SULT1A1 in the presence of PAPS. After extraction and solvent evaporation, the reaction generated a light yellow solid. HPLC-UV-FLR analysis showed that 5-MC-1,2-dione was completely consumed in the reaction, and two peaks that were absent in the negative control were observed that eluted earlier than 5-MC-1,2-dione (retention time, 31.98 min) (Figure 3A,B). The major peak had a retention time and UV spectrum identical to those of metabolite 5 in Figure 1. This synthetic product showed a deprotonated molecule [M − H]− at m/z 353 under Q1 full scan in negative ion mode, corresponding to the molecular weight of a deprotonated O-monosulfonated catechol. The fragmentation pattern of this major synthetic product obtained from the MS2 and MS3 spectra (Figure 3D,E) was identical to that of metabolite 5 and confirmed its identity as the deprotonated O-monosulfonated-5-MC-1,2-catechol (m/z 353). Because 5-MC-1,2-catechol is asymmetric, there are two possible structures of O-monosulfonated-5-MC-1,2-catechol and the specific position of the sulfate group cannot be assigned without characterization by 1H NMR. The other four O-monosulfonated-5-MC-catechol isomers could be derived from the reduction of 5-MC-7,8-dione, 9,10-dione, or 3,4-dione. Identification of O-monosulfonated-catechol isomers showed that 5-MC was activated by the ortho-quinone pathway.
Figure 3.
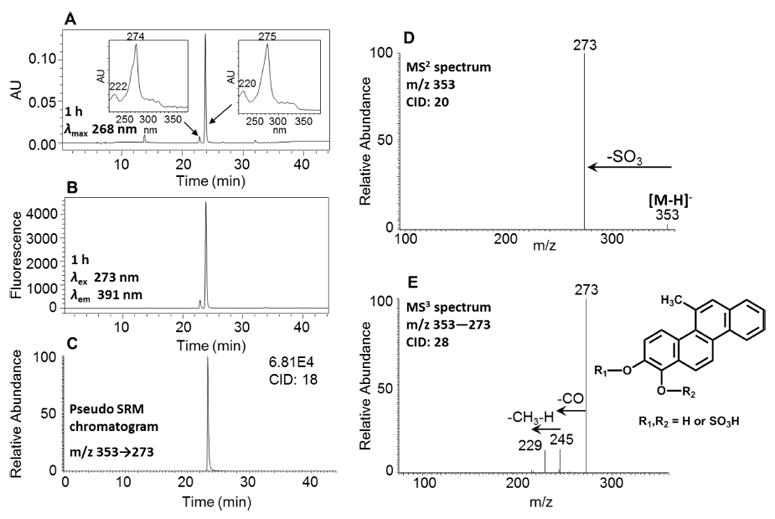
Characterization of synthetic O-monosulfonated-5-MC-1,2-catechol. (A) UV chromatogram at λmax 268 nm. (B) FLR chromatogram at λex 273 nm and λem 391 nm. (C) Extracted ion chromatogram of pseudo SRM transition. (D) MS2 spectrum. (E) MS3 spectrum. The product profiles were obtained after 1 h incubation of 5-MC-1,2-catechol with SULT1A1 and PAPS.
Identification of O-Monomethyl-O-Monosulfonated-5-MC-1,2-Catechol
O-Monomethyl-O-monosulfonated-5-MC-catechol was detected in the culture media from HepG2 cells following treatment with 1 μM 5-MC for 24 h. One peak with the retention time of 22.54 min was detected by monitoring the pseudo SRM chromatograms (m/z 367 → 287) at 0 h (Figure 4A) and 24 h (Figure 4B) in negative ion mode, which showed the loss of sulfate (80 amu) from the deprotonated molecular ion. The MS3 spectrum (m/z 367 → 287 →) of this metabolite showed the loss of CH3 (Figure 4C). This fragmentation pattern is consistent with that observed for O-monomethyl-O-monosulfonated-phenanthrene-9,10-catechol, which was generated in HepG2 cells following incubation with phenanthrene-9,10-quinone.26 Comparison of the retention time of O-monomethyl-O-monosulfonated-5-MC-catechol with metabolite 4 on HPLC-UV-FLR in Figure 1 showed a good concordance. The specific position of the O-methyl and O-sulfonated groups on 5-MC-catechols could not be assigned using mass spectrometry and thus we enzymatically synthesized bis-catechol conjugate standards as follows.
Figure 4.
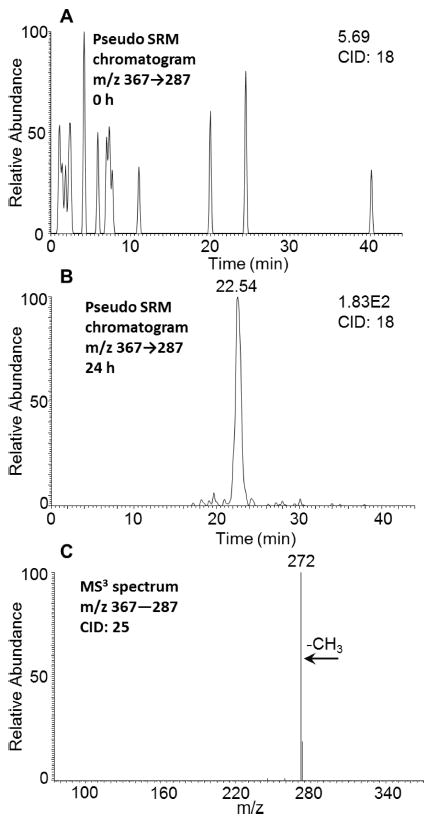
Detection of O-monomethyl-O-monosulfonated-5-MC-1,2-catechol in human HepG2 cells. (A) Extracted ion chromatogram of pseudo SRM transition at 0 h. (B) Extracted ion chromatogram of pseudo SRM transition at 24 h. (C) MS3 spectrum of the peak at 22.54 min. The samples were prepared as described in the caption to Figure 1 and were subsequently analyzed on an ion-trap LC-MS/MS.
In order to generate the O-monomethyl-O-monosulfonated-5-MC-1,2-catechol standard, 5-MC-1,2-dione was reduced by dithiothreitol followed by sequential phase II conjugation with COMT plus AdoMet followed by SULT1A1 plus PAPS. After extraction and solvent evaporation, the reaction generated a light yellow solid. HPLC-UV-FLR analysis showed that 5-MC-1,2-dione was completely consumed in the reaction, and a significant peak was observed that eluted slightly later than 5-MC-1,2-dione at 33.11 min (Figure 5A,B), corresponding to O-monomethyl-5-MC catechol. Another two significant peaks with retention times of 22.54 and 23.40 min that were absent in the negative control were also observed that eluted earlier than 5-MC-1,2-dione (Figure 5A–C). The minor peak had the same retention time and UV spectrum as those of metabolite 4 in Figure 1. This polar synthetic product showed a deprotonated molecule [M − H]− at m/z 367 under Q1 full scan in negative ion mode, corresponding to the molecular weight of a deprotonated O-monomethyl-O-monosulfonated catechol. The fragmentation pattern of this synthetic product obtained from the MS2 and MS3 spectra (Figure 5D,E) was essentially identical to that of metabolite 4 and confirmed its identity as the deprotonated O-monomethyl-O-monosulfonated-5-MC-1,2-catechol (m/z 367). Because 5-MC-1,2-catechol is asymmetric, there are two possible structures of O-monomethyl-O-monosulfonated-5-MC-1,2-catechol and the specific positions of the methyl and sulfate groups cannot be assigned without characterization by 1H NMR. Identification of O-monomethyl-O-monosulfonated-1,2-catechol indicated the occurrence of the ortho-quinone pathway of 5-MC and also provided evidence for the formation of the intermediate 5-MC-trans-1,2-dihydrodiol.
Figure 5.
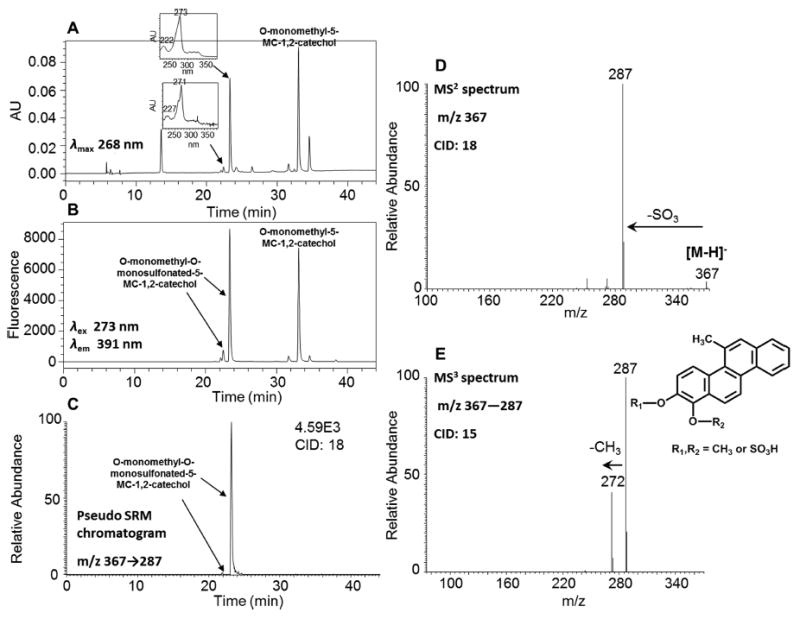
Characterization of synthetic O-monomethyl-O-monosulfonated-5-MC-1,2-catechol. (A) UV chromatogram at λmax 268 nm. (B) FLR chromatogram at λex 273 nm and λem 391 nm. (C) Extracted ion chromatogram of pseudo SRM transition. (D) MS2 spectrum. (E) MS3 spectrum. The product profiles were obtained after 1 h incubation of 5-MC-1,2-catechol with COMT and AdoMet followed by an additional 1 h incubation with SULT1A1 and PAPS.
Identification of 5-MC-1,2-Dione and Monohydroxy-5-MC-Dione
Two peaks with retention times of 23.05 and 31.98 min were detected by comparing the pseudo SRM chromatograms (m/z 273 → 245) at 0 h (Figure 6A) and 24 h (Figure 6B) in positive ion mode. The respective MS2 spectra (m/z 273) of these two metabolites showed the characteristic loss of CO (28 amu) from the protonated molecular ion, and a representative MS2 spectrum of the metabolite with a retention time of 31.98 min is shown in Figure 6C. The MS3 spectrum (m/z 273 → 245 →) of this metabolite showed a characteristic loss of a second CO followed by the loss of CH3 (Figure 6D). The sequential loss of two CO groups supported the presence of an ortho-quinone. When this metabolite was compared to an authentic standard, it had the same retention time and fragmentation pattern as those of 5-MC-1,2-dione, strongly indicating the presence of the ortho-quinone pathway in 5-MC activation.
Figure 6.
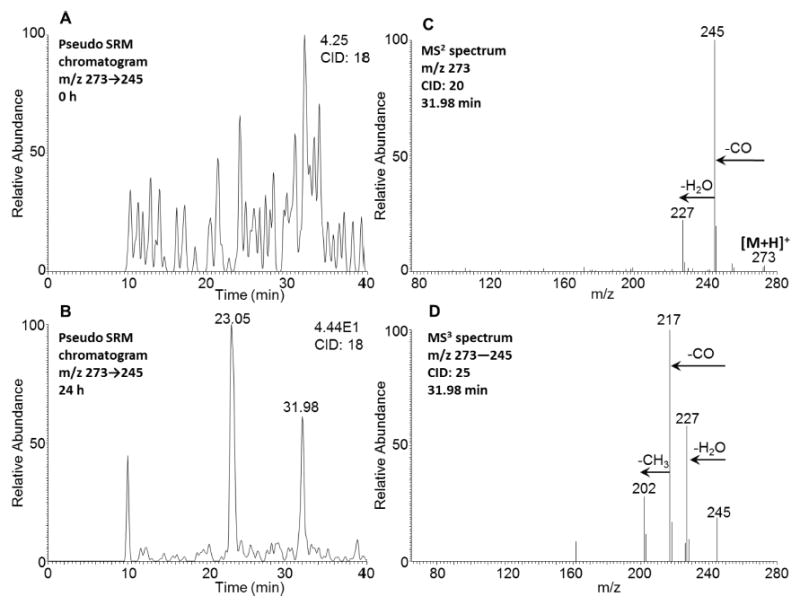
Detection of 5-MC-1,2-dione in human HepG2 cells. (A) Extracted ion chromatogram of pseudo SRM transition at 0 h. (B) Extracted ion chromatogram of pseudo SRM transition at 24 h. (C) MS2 spectrum of the peak at 31.98 min. (D) MS3 spectrum of the peak at 31.98 min. The samples were prepared as described in the caption to Figure 1 and were subsequently analyzed on an ion-trap LC-MS/MS. Another peak with a retention time of 23.05 min and with relatively high polarity could be an isomer of O-monosulfonated-5-MC-catechol, which could undergo cleavage of the sulfate conjugate in the mass spectrometer followed by auto-oxidation and thus result in the detection of quinone instead.
One peak with a retention time of 31.38 min was detected by comparing the pseudo SRM chromatograms (m/z 289 → 260) at 0 h (Figure 7A) and 24 h (Figure 7B) in the positive ion mode. The corresponding MS2 spectrum (m/z 289) of this metabolite (Figure 7C) showed the characteristic loss of CO (28 amu) plus one hydrogen from the protonated molecular ion. The MS3 spectrum (m/z 289 → 260 →) of this metabolite (Figure 7D) showed either another characteristic loss of CO or the loss of •CH═C═O. This fragmentation pattern is consistent with that observed for mono-hydroxy-benzo[a]-pyrene-7,8-dione, which was detected in three human lung cells after incubation with benzo[a]pyrene-7,8-dione (B[a]P-7,8-dione).28 Comparison of the retention time of mono-hydroxy-5-MC-dione with metabolite 10 on HPLC-UV-FLR in Figure 1 showed a good concordance. Mono-hydroxy-5-MC-dione could be derived from either 5-MC-1,2-dione or a remote quinone, and these alternatives cannot be distinguished based on mass spectrometry.
Figure 7.
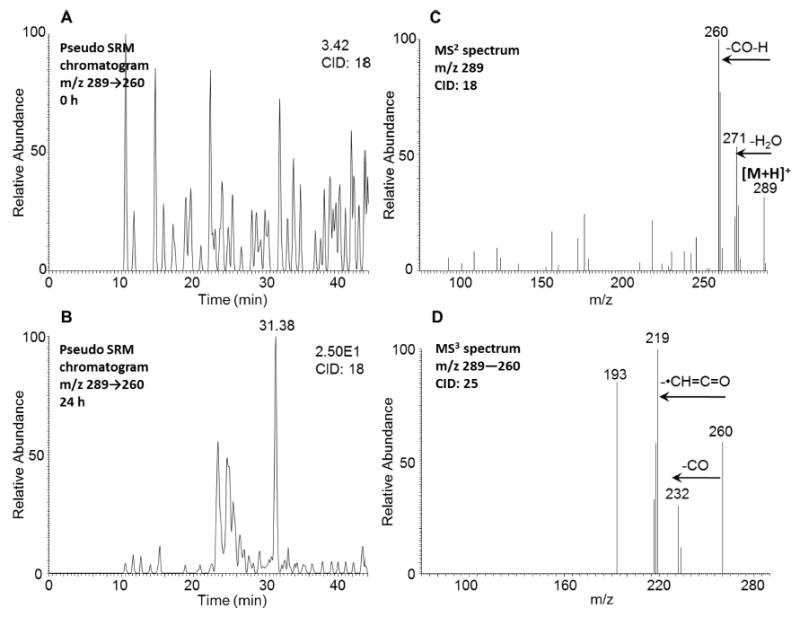
Detection of mono-hydroxy-5-MC-dione in human HepG2 cells. (A) Extracted ion chromatogram of pseudo SRM transition at 0 h. (B) Extracted ion chromatogram of pseudo SRM transition at 24 h. (C) MS2 spectrum of the peak at 31.38 min. (D) MS3 spectrum of the peak at 31.38 min. The samples were prepared as described in the caption to Figure 1 and were subsequently analyzed on an ion-trap LC-MS/MS.
Evidence for the Formation of Bis-Electrophiles
Evidence for dual metabolic activation of 5-MC to form bis-electrophiles (the combination of the diol-epoxide and ortho-quinone pathways) in HepG2 cells was obtained. Two peaks with retention times of 14.66 and 15.65 min were detected by comparing the extracted ion chromatograms of the Orbitrap full scan at 0 h (Figure 8A) and 24 h (Figure 8B) in negative ion mode. MS spectra of these two metabolites both provided the accurate masses and molecular formula of tetrahydroxy-O-monomethyl-5-MC-catechol with acceptable ppm values (Figure 8C,D). In particular, the unique biotransformation of O-methylation strongly indicated the formation of the catechol, thus confirming the occurrence of ortho-quinone pathway. The specific positions of the hydroxy groups of the tetraol and O-monomethyl-catechol could not be assigned using mass spectrometry. Further evidence for the formation of a bis-electrophile containing a diol-epoxide and an ortho-quinone within the same structure came from the detection of two isomers of monodehydrated tetrahydroxy-5-MC-dione in HepG2 cells when the extracted ion chromatograms of the Orbitrap full scan at 0 and 24 h in positive ion mode were compared (Figure S4).
Figure 8.
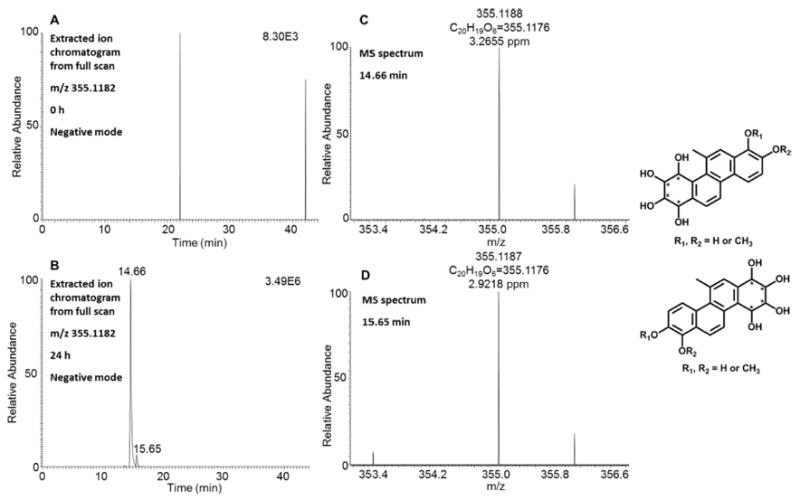
Detection of tetrahydroxy-O-monomethyl-5-MC-catechols in human HepG2 cells. (A) Extracted ion chromatogram of the Orbitrap full scan at 0 h. (B) Extracted ion chromatogram of the Orbitrap full scan at 24 h. (C, D) MS spectra of the peaks eluting at 14.66 and 15.65 min. The samples were prepared as described in the caption to Figure 1 and were subsequently analyzed on an Orbitrap LC-MS/MS.
Bis-dehydrated-tetraol plus O-monosulfonated-bis-dehydrated-tetraol and monodehydrated-tetraol plus O-monoglucuronosyl-bis-dehydrated-tetraol were also detected in HepG2 cells by comparing the extracted ion chromatograms of the Orbitrap full scan at 0 and 24 h in positive ion mode (Figures S5 and S6), indicating the occurrence of activation on the two terminal benzo rings to give a bis-diol-epoxide.
O-Monomethyl-catechol-5-MC-ortho-quinone was also detected in HepG2 cells by comparing the extracted ion chromatograms of the Orbitrap full scan at 0 and 24 h in positive ion mode (Figure S7), indicating the occurrence of the formation of a bis-ortho-quinone. In particular, the unique biotransformation involving O-methylation strongly indicated the formation of the catechol, thus confirming the occurrence of the ortho-quinone pathway.
Identification of Other 5-MC Metabolites
A single isomer of monodehydrated O-monosulfonated-5-MC-dihydro-diol with a retention time of 22.01 min was detected by comparing the pseudo SRM chromatograms (m/z 337 → 257) at 0 h (Figure 9A) and 24 h (Figure 9B) in negative ion mode. The corresponding MS2 spectrum (m/z 337) of this metabolite showed the characteristic loss of sulfate (80 amu) from the deprotonated molecular ion (Figure 9C), and the MS3 spectrum (m/z 337 → 257 →) of this metabolite showed the subsequent loss of one CH3 group (Figure 9D). The specific position of the O-monosulfonated-dihydrodiol could not be assigned using mass spectrometry.
Figure 9.
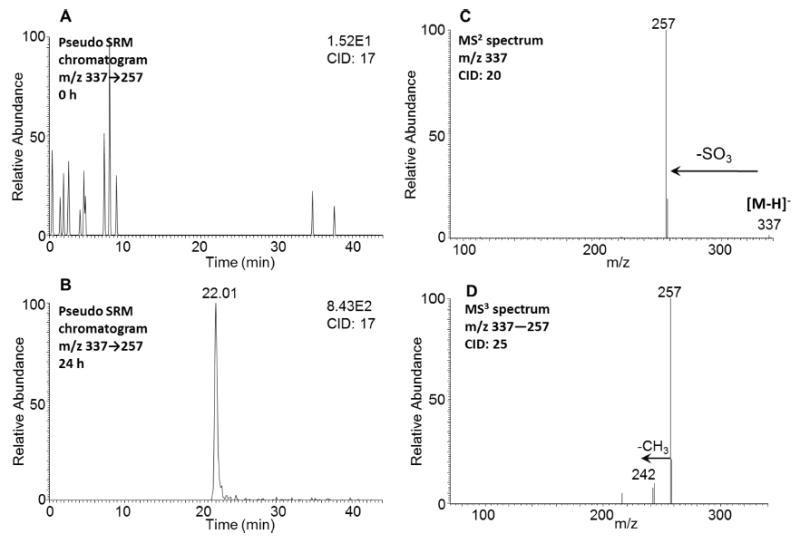
Detection of monodehydrated O-monosulfonated-5-MC-dihydrodiol in human HepG2 cells. (A) Extracted ion chromatogram of pseudo SRM transition at 0 h. (B) Extracted ion chromatogram of pseudo SRM transition at 24 h. (C) MS2 spectrum of the peak at 22.01 min. (D) MS3 spectrum of the peak at 22.01 min. The samples were prepared as described in the caption to Figure 1 and were subsequently analyzed on an ion-trap LC-MS/MS.
Two isomers of 5-MC-bis-phenols with retention times of 26.96 and 29.93 min were detected by comparing the MS2 chromatograms (m/z 275) at 0 and 24 h in positive ion mode (Table 4). The corresponding MS2 spectra (m/z 275) of these metabolites showed the sequential loss of H2O (18 amu) and CO (28 amu) from the protonated molecular ion (Table 4). Comparison of the retention time of 5-MC-bis-phenols with metabolites 8 and 9 on HPLC-UV-FLR in Figure 1 showed good agreement. The specific positions of the bis-phenols could not be assigned using mass spectrometry.
5-Hydroxy-5-MC was synthesized as an authentic standard (Figure S8 and Supporting Information) to determine whether any of the metabolites detected in human HepG2 cells supported hydroxylation on the methyl side chain. No metabolite was detected that had a retention time corresponding to the synthetic standard. Negative data were also obtained with 7-hydroxy-5-MC, ruling out formation of this phenol.
DISCUSSION
We describe a comprehensive account of the metabolism of 5-MC in a human liver cell line, HepG2, as a model for human hepatocytes. 5-MC is the most carcinogenic regioisomer of C1-chrysenes present in crude oil, but information about its cellular metabolism in liver is lacking. 5-MC may enter the food chain after oil spills, and elucidating its metabolism in liver cells is critical in characterizing its potential human toxicity. 5-MC metabolites were detected and identified in HepG2 cell culture media by HPLC-UV-FLR and LC-MS/MS (Table 4). Metabolite 2 in Figure 1 was identified as a tetraol. Metabolites 3, 5, and 6 in Figure 1 were identified as isomers of a O-monosulfonated-catechol. Metabolite 4 in Figure 1 was identified as a O-monomethyl-O-monosulfonated-catechol. Metabolites 8 and 9 in Figure 1 were identified as isomers of a bis-phenol. Metabolite 10 in Figure 1 was identified as a mono-hydroxy-quinone. Metabolites 1 and 7 in Figure 1 remain unassigned. The peak areas on UV and FLR chromatograms provided an estimate of the relative abundance of the metabolites. The major metabolic pathways for the activation of 5-MC in human HepG2 cells involved formation of diol-epoxides and ortho-quinones (Scheme 2). We also observed monohydroxylation of the quinone, as well as bis-hydroxylation to form a bis-phenol (Scheme 2). For the first time, we report evidence for the bioactivation of 5-MC in both bay regions to form bis-electrophiles containing a mono-diol-epoxide and a mono-ortho-quinone within the same structure, bis-diol-epoxides, and bis-ortho-quinones. While the detection of these metabolites was minor, they are inherently reactive since bis-electrophiles have the potential to form protein and DNA cross-links. It is likely that sequestration of these bis-electrophiles by macromolecules contributes to their under detection. The detection of tetraols derived from diol-epoxides and ortho-quinones supports metabolic activation by cytochrome P450 and aldo-keto reductases (AKRs)29,30 and suggests the presence of phase I enzymes, whereas the detection of catechol conjugates suggests the presence of phase II enzymes. Thus, HepG2 cells contain a battery of enzymes for 5-MC metabolism.
Scheme 2. Proposed Metabolic Pathway of 5-MC in Human HepG2 Cellsa.
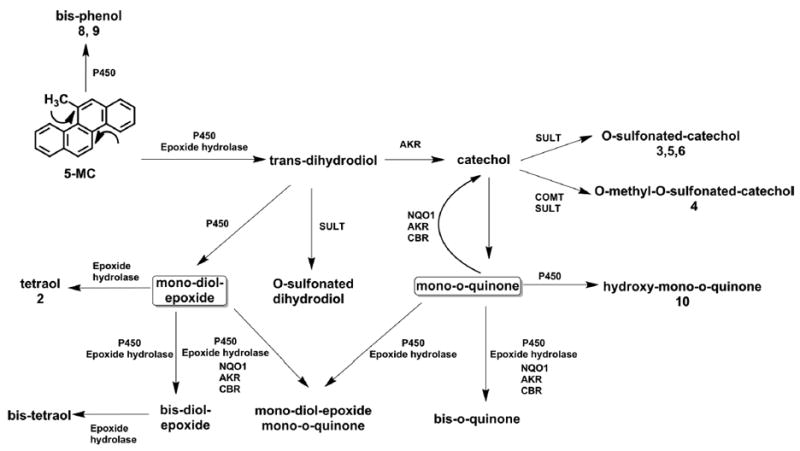
aThe numbers for each metabolite correspond to the metabolites labeled in the UV and fluorescence chromatograms in Figure 1.
Metabolic activation of 5-MC via the diol-epoxide pathway has been extensively studied previously in vitro and in vivo.8-12 Using human liver microsomes, the major metabolites of 5-MC were positional isomers of trans-dihydrodiols and monophenols.11 In our initial studies, when human HepG2 cells were treated with 5-MC in HBSS media containing 10 mM glucose, two major metabolites, 5-MC-trans-1,2-dihydrodiol and 5-MC-trans-7,8-dihydrodiol, were detected, and their identities were further validated by comparison to authentic synthesized standards (data not shown). However, under these conditions, a large amount of 5-MC was left unmetabolized after a 24 h incubation, and similar findings were observed in human liver microsomes.11 We observed enhanced metabolism in human HepG2 cells when grown in MEM (without phenol red) containing 10 mM glucose, where 5-MC was almost completely consumed after a 24 h incubation, and we chose these conditions to conduct our work. The different metabolic outcomes observed in the two cell culture media likely reflect the higher levels of nutrients in MEM vs HBSS media. This enabled us to detect more metabolites, including those derived from the diol-epoxide and ortho-quinone pathways.
HepG2 cells contain inducible P450 1A1, and this is most likely responsible for the formation of diol-epoxides.31 Previous transcriptomic profiling also demonstrated that HepG2 cells contain AKR1C1, AK1C2, and AKR1C3 but not AKR1C4, which is liver-specific.32 Several members of the AKR superfamily, including these, are able to oxidize PAH trans-dihydrodiols to ortho-quinones.29,30 In addition, AKRs, NAD-(P)H:quinone oxidoreductase 1 (NQO1), and carbonyl reductase (CBR) also catalyze the redox cycling of PAH ortho-quinones.33 Therefore, we hypothesize that AKRs are responsible not only for the formation of 5-MC-1,2-dione but also for the redox cycling of this ortho-quinone. AKRs are cytosolic and are present in human HepG2 cells rather than in human liver microsomes, which explains why these metabolites were not detected in previous studies using human liver microsomes to metabolize 5-MC.11 Metabolism of 5-MC in rat liver S9 fractions led to the formation of two unknown metabolites8 which could have been derived from the ortho-quinone pathway. Rat liver dihydrodiol dehydrogenase (AKR1C9) has been shown to oxidize both 5-MC-trans-1,2-dihydrodiol and 5-MC-trans-7,8-dihydrodiol to the corresponding quinones.34,35
We now identify O-monosulfonated-5-MC-1,2-catechol, O-monomethyl-O-monosulfonated-5-MC-1,2-catechol, and 5-MC-1,2-dione as metabolites by comparison to their authentic synthesized standards. Identification of these three metabolites unequivocally established the metabolic activation of 5-MC via the ortho-quinone pathway involving AKRs in human HepG2 cells. The electrophilic 5-MC-1,2-dione could undergo 1,4- or 1,6-Michael addition with glutathione, DNA, RNA, or protein to form covalent adducts. 5-MC-1,2-dione can also be enzymatically and nonenzymatically reduced back to the catechol and establish futile redox cycles that result in reactive oxygen species (ROS) amplification until cellular reducing equivalents (e.g., NADPH) are depleted. Reduction of 5-MC-1,2-dione to the catechol followed by the formation of phase II conjugates represents a detoxification pathway for 5-MC-1,2-dione since both its electrophilicity and redox activity are eliminated. In contrast, other metabolites such as mono-hydroxy-5-MC-dione, if derived from the ortho-quinone, would retain their electrophilicity and ability to redox cycle, generating oxidative stress and causing oxidative DNA damage.
A novel feature of our work is evidence for the metabolic activation of 5-MC on both terminal benzo rings so that bis-electrophiles containing a mono-diol-epoxide and a mono-ortho-quinone within the same structure, bis-diol-epoxides, and bis-ortho-quinones are formed. This means that P450 1A1 and AKRs can work separately or together in the bioactivation of 5-MC to form bis-electrophiles. Substrate specificity studies demonstrate that the human AKR1C enzymes prefer to metabolize methylated-PAH trans-dihydrodiols and oxidize the (R,R)- or (S,S)- stereoisomers equally well.30
We failed to show that once 5-MC-trans-1,2-dihydrodiol is formed and oxidized to the catechol that either O-monomethylation and/or O-monoglucuronidation occurs in human HepG2 cells using enzymatically synthesized O-monomethyl-5-MC-1,2-catechol and O-monoglucuronosyl-5-MC-1,2-catechol as authentic standards, We expected to find evidence for the O-methyl catechol since we were able to detect O-monomethyl-O-monosulfonated-5-MC-1,2-catechol. This difference could be explained if either the O-monomethyl catechol is rapidly sulfonated or sulfonation proceeds prior to O-methylation.
Using 5-hydroxy-5-MC as an authentic standard, mono-hydroxylation on the methyl group side chain was not observed in human HepG2 cells, which is consistent with previous findings that hydroxymethylation of 5-MC is not an important metabolic activation pathway in humans.11 Using an authentic standard of 7-hydroxy-5-MC, evidence for monohydroxylation on the chrysene ring was also not found in human HepG2 cells, probably due to the more extensive formation of bis-phenols detected in this study.
The phase I and phase II isozymes responsible for the novel metabolic pathway of 5-MC in human HepG2 cells remain to be completely identified. Detection of 5-MC-1,2-dione, mono-hydroxy-5-MC-dione, and 5-MC-bis-phenols indicates that catalysis is being mediated by cytochrome P450 and AKR in these cells. Although the AKR enzymes responsible for making 5-MC-1,2-dione are likely to be AKR1C1, AKR1C2, and AKR1C3, the P450 isozymes responsible for the hydroxylation of ortho-quinones and bis-phenol formation remain to be identified. The detection of catechol conjugates indicates that 5-MC-1,2-dione is being intercepted to prevent its redox cycling. As human recombinant SULT1A1 can be used to form O-sulfonated-5-MC-1,2-catechol synthetically and is expressed in human HepG2 cells,36 it is likely to be involved in this detoxication mechanism. Other SULT isoforms expressed in HepG2 cells have yet to be studied to determine their ability to sulfonate 5-MC-1,2-catechol.
Elucidation of the metabolic pathways of 5-MC in human liver cells can be used to identify exposure biomarkers of 5-MC that could be used for biomonitoring human urine and plasma. This study indicates that the major metabolites, i.e., O-monosulfonated-catechol and tetraols, appear to be stable and could be reasonable biomarkers of 5-MC exposure resulting from the consumption of sea food contaminated by oil spills.
Supplementary Material
Acknowledgments
Funding
This publication was made possible by Deepwater Horizon Research Consortia grant no. U19 ES020676-04 and P30 ES013508 (T.M.P.) from the National Institute of Environmental Health Sciences (NIEHS), NIH, DHHS. UTMB SOCC funding was also provided in part by grant no. P30 ES006676 (Center for Environmental Toxicology, UTMB) from the National Institute of Environmental Health Sciences (NIEHS). Its contents are solely the responsibility of the authors and do not necessarily represent the official views of the NIEHS or NIH.
ABBREVIATIONS
- PAPS
adenosine 3′-phosphate 5′-phosphosulfate
- AdoMet
S-(5′-adenosyl)-l-methionine
- AKR
aldo-keto reductase
- B[a]P-7,8-dione
benzo[a]pyrene-7,8-dione
- CBR
carbonyl reductase
- COMT
catechol-O-methyltransferase
- P450
cytochrome P450
- ESI
electrospray ionization
- FBS
fetal bovine serum
- HPLC-UV-FLR
high-performance liquid chromatography-ultraviolet-fluorescence
- LC-MS/MS
liquid chromatography–tandem mass spectrometry
- 5-MC
5-methylchrysene
- NQO1
NAD (P)H:quinone oxidoreductase 1
- PAH
polycyclic aromatic hydrocarbon
- ROS
reactive oxygen species
- SULTs
sulfotransferases
- UDPGA
uridine-5′-diphosphoglucuronic acid
- UGTs
uridine 5′-diphospho-glucuronosyltransferases
Footnotes
Supporting Information
The Supporting Information is available free of charge on the ACS Publications website at DOI: 10.1021/acs.chemres-tox.5b00256.
Excitation wavelength and emission wavelength spectra of 5-MC (Figure S1); UV spectra of metabolite 1–10 in HepG2 cells (Figure S2); extracted ion chromatograms of Orbitrap full scan for monodehydrated 5-MC-tetraol, bis-dehydrated 5-MC-tetraol, and 5-MC-tetraol detected in HepG2 cells (Figure S3); extracted ion chromatograms of Orbitrap full scan for monodehydrated tetrahydroxy-5-MC-dione (Figure S4); bis-dehydrated-tetraol plus O-monosulfonated-bis-dehydrated-tetraol (Figure S5); monodehydrated-tetraol plus O-mono-glucuronosyl-bis-dehydrated-tetraol (Figure S6); and O-monomethyl-catechol-5-MC-ortho-quinone (Figure S7) detected in HepG2 cells; synthetic routes and details of synthesis of 5-hydroxy-5-MC and 7-hydroxy-5-MC (also see Figure S8) (PDF).
Notes
The authors declare no competing financial interest.
References
- 1.Joye SB, MacDonald IR, Leifer I, Asper V. Magnitude and oxidation potential of hydrocarbon gases released from the BP oil well blowout. Nat Geosci. 2011;4:160–164. [Google Scholar]
- 2.Atlas RM, Hazen TC. Oil biodegradation and bioremediation: a tale of the two worst spills in US history. Environ Sci Technol. 2011;45:6709–6715. doi: 10.1021/es2013227. [DOI] [PMC free article] [PubMed] [Google Scholar]
- 3.Goldstein BD, Osofsky HJ, Lichtveld MY. The Gulf oil spill. N Engl J Med. 2011;364:1334–1348. doi: 10.1056/NEJMra1007197. [DOI] [PubMed] [Google Scholar]
- 4.National Institute of Standards and Technology Certificate of Analysis: Standard Reference Material (SRM) 2779, Gulf of Mexico Crude Oil. National Institue of Standards and Technology; Gaithersburg, MD: 2012. pp. 1–7. [Google Scholar]
- 5.Ylitalo GM, Krahn MM, Dickhoff WW, Stein JE, Walker CC, Lassitter CL, Garrett ES, Desfosse LL, Mitchell KM, Noble BT, Wilson S, Beck NB, Benner RA, Koufopoulos PN, Dickey RW. Federal seafood safety response to the Deepwater Horizon oil spill. Proc Natl Acad Sci U S A. 2012;109:20274–20279. doi: 10.1073/pnas.1108886109. [DOI] [PMC free article] [PubMed] [Google Scholar]
- 6.Sammarco PW, Kolian SR, Warby RAF, Bouldin JL, Subra WA, Porter SA. Distribution and concentrations of petroleum hydrocarbons associated with the BP/Deepwater Horizon Oil Spill, Gulf of Mexico. Mar Pollut Bull. 2013;73:129–143. doi: 10.1016/j.marpolbul.2013.05.029. [DOI] [PubMed] [Google Scholar]
- 7.Hecht SS, Bondinell WE, Hoffmann D. Chrysene and methylchrysenes: presence in tobacco smoke and carcinogenicity. J Natl Cancer Inst. 1974;53:1121–1133. doi: 10.1093/jnci/53.4.1121. [DOI] [PubMed] [Google Scholar]
- 8.Hecht SS, LaVoie E, Mazzarese R, Amin S, Bedenko V, Hoffmann D. 1,2-dihydro-1,2-dihydroxy-5-methylchrysene, a major activated metabolite of the environmental carcinogen 5-methylchrysene. Cancer Res. 1978;38:2191–2194. [PubMed] [Google Scholar]
- 9.Melikian AA, LaVoie EJ, Hecht SS, Hoffmann D. 5-Methylchrysene metabolism in mouse epidermis in vivo, diol epoxide–DNA adduct persistence, and diol epoxide reactivity with DNA as potential factors influencing the predominance of 5-methylchrysene-1,2-diol-3,4-epoxide–DNA adducts in mouse epidermis. Carcinogenesis. 1983;4:843–849. doi: 10.1093/carcin/4.7.843. [DOI] [PubMed] [Google Scholar]
- 10.Amin S, Huie K, Balanikas G, Hecht SS, Pataki J, Harvey RG. High stereoselectivity in mouse skin metabolic activation of methylchrysenes to tumorigenic dihydrodiols. Cancer Res. 1987;47:3613–3617. [PubMed] [Google Scholar]
- 11.Koehl W, Amin S, Staretz ME, Ueng YF, Yamazaki H, Tateishi T, Guengerich FP, Hecht SS. Metabolism of 5-methylchrysene and 6-methylchrysene by human hepatic and pulmonary cytochrome P450 enzymes. Cancer Res. 1996;56:316–324. [PubMed] [Google Scholar]
- 12.Shappell NW, Carlino-MacDonald U, Amin S, Kumar S, Sikka HC. Comparative metabolism of chrysene and 5-methylchrysene by rat and rainbow trout liver microsomes. Toxicol Sci. 2003;72:260–266. doi: 10.1093/toxsci/kfg039. [DOI] [PubMed] [Google Scholar]
- 13.Melikian AA, LaVoie EJ, Hecht SS, Hoffmann D. Influence of bay-region methyl group on formation of 5-methylchrysene dihydrodiol epoxide:DNA adducts in mouse skin. Cancer Res. 1982;42:1239–1242. [PubMed] [Google Scholar]
- 14.Melikian AA, Amin S, Hecht SS, Hoffmann D, Pataki J, Harvey RG. Identification of the major adducts formed by reaction of 5-methylchrysene anti-dihydrodiol-epoxides with DNA in vitro. Cancer Res. 1984;44:2524–2529. [PubMed] [Google Scholar]
- 15.Reardon DB, Prakash AS, Hilton BD, Roman JM, Pataki J, Harvey RG, Dipple A. Characterization of 5-methylchrysene-1,2-dihydrodiol-3,4-epoxide-DNA adducts. Carcino-genesis. 1987;8:1317–1322. doi: 10.1093/carcin/8.9.1317. [DOI] [PubMed] [Google Scholar]
- 16.Melikian AA, Amin S, Huie K, Hecht SS, Harvey RG. Reactivity with DNA bases and mutagenicity toward Salmonella typhimurium of methylchrysene diol epoxide enantiomers. Cancer Res. 1988;48:1781–1787. [PubMed] [Google Scholar]
- 17.Melikian AA, Prahalad KA, Amin S, Hecht SS. Comparative DNA binding of polynuclear aromatic hydrocarbons and their dihydrodiol and bay region diolepoxide metabolites in newborn mouse lung and liver. Carcinogenesis. 1991;12:1665–1670. doi: 10.1093/carcin/12.9.1665. [DOI] [PubMed] [Google Scholar]
- 18.Kuljukka-Rabb T, Peltonen K, Isotalo S, Mikkonen S, Rantanen L, Savela K. Time- and dose-dependent DNA binding of PAHs derived from diesel particle extracts, benzo[a]pyrene and 5-methychrysene in a human mammary carcinoma cell line (MCF-7) Mutagenesis. 2001;16:353–358. doi: 10.1093/mutage/16.4.353. [DOI] [PubMed] [Google Scholar]
- 19.Bigger CA, Flickinger DJ, Strandberg J, Pataki J, Harvey RG, Dipple A. Mutational specificity of the anti 1,2-dihydrodiol 3,4-epoxide of 5-methylchrysene. Carcinogenesis. 1990;11:2263–2265. doi: 10.1093/carcin/11.12.2263. [DOI] [PubMed] [Google Scholar]
- 20.Okuda H, Hiratsuka A, Nojima H, Watabe T. A hydroxymethyl sulphate ester as an active metabolite of the carcinogen, 5-hydroxymethylchrysene. Biochem Pharmacol. 1986;35:535–538. doi: 10.1016/0006-2952(86)90232-7. [DOI] [PubMed] [Google Scholar]
- 21.Okuda H, Nojima H, Watanabe N, Miwa K, Watabe T. Activation of the carcinogen, 5-hydroxymethylchrysene, to the mutagenic sulphate ester by mouse skin sulphotransferase. Biochem Pharmacol. 1988;37:970–973. doi: 10.1016/0006-2952(88)90192-x. [DOI] [PubMed] [Google Scholar]
- 22.Okuda H, Nojima H, Miwa K, Watanabe N, Watabe T. Selective covalent binding of the active sulfate ester of the carcinogen 5-(hydroxymethyl)chrysene to the adenine residue of calf thymus DNA. Chem Res Toxicol. 1989;2:15–22. doi: 10.1021/tx00007a003. [DOI] [PubMed] [Google Scholar]
- 23.Zhang L, Jin Y, Chen M, Huang M, Harvey RG, Blair IA, Penning TM. Detoxication of structurally diverse polycyclic aromatic hydrocarbon (PAH) o-quinones by human recombinant catechol-O-methyltransferase (COMT) via O-methylation of PAH catechols. J Biol Chem. 2011;286:25644–25654. doi: 10.1074/jbc.M111.240739. [DOI] [PMC free article] [PubMed] [Google Scholar]
- 24.Zhang L, Huang M, Blair IA, Penning TM. Detoxication of benzo[a]pyrene-7,8-dione by sulfotransferases (SULTs) in human lung cells. J Biol Chem. 2012;287:29909–29920. doi: 10.1074/jbc.M112.386052. [DOI] [PMC free article] [PubMed] [Google Scholar]
- 25.Zhang L, Huang M, Blair IA, Penning TM. Interception of benzo[a]pyrene-7,8-dione by UDP glucuronosyltrans-ferases (UGTs) in human lung cells. Chem Res Toxicol. 2013;26:1570–1578. doi: 10.1021/tx400268q. [DOI] [PMC free article] [PubMed] [Google Scholar]
- 26.Huang M, Zhang L, Mesaros C, Zhang S, Blaha MA, Blair IA, Penning TM. Metabolism of a representative oxygenated polycyclic aromatic hydrocarbon (PAH) phenanthrene-9,10-quinone in human hepatoma (HepG2) cells. Chem Res Toxicol. 2014;27:852–863. doi: 10.1021/tx500031p. [DOI] [PMC free article] [PubMed] [Google Scholar]
- 27.Shimada T, Oda Y, Gillam EM, Guengerich FP, Inoue K. Metabolic activation of polycyclic aromatic hydrocarbons and other procarcinogens by cytochromes P450 1A1 and P450 1B1 allelic variants and other human cytochromes P450 in Salmonella typhimurium NM2009. Drug Metab Dispos. 2001;29:1176–1182. [PubMed] [Google Scholar]
- 28.Huang M, Liu X, Basu SS, Zhang L, Kushman ME, Harvey RG, Blair IA, Penning TM. Metabolism and distribution of benzo[a]pyrene-7,8-dione (B[a]P-7,8-dione) in human lung cells by liquid chromatography tandem mass spectrometry: detection of an adenine B[a]P-7,8-dione adduct. Chem Res Toxicol. 2012;25:993–1003. doi: 10.1021/tx200463s. [DOI] [PMC free article] [PubMed] [Google Scholar]
- 29.Palackal NT, Burczynski ME, Harvey RG, Penning TM. The ubiquitous aldehyde reductase (AKR1A1) oxidizes proximate carcinogen trans-dihydrodiols to o-quinones: potential role in polycyclic aromatic hydrocarbon activation. Biochemistry. 2001;40:10901–10910. doi: 10.1021/bi010872t. [DOI] [PubMed] [Google Scholar]
- 30.Palackal NT, Lee SH, Harvey RG, Blair IA, Penning TM. Activation of polycyclic aromatic hydrocarbon trans-dihydrodiol proximate carcinogens by human aldo-keto reductase (AKR1C) enzymes and their functional overexpression in human lung carcinoma (A549) cells. J Biol Chem. 2002;277:24799–24808. doi: 10.1074/jbc.M112424200. [DOI] [PubMed] [Google Scholar]
- 31.Burczynski ME, Penning TM. Genotoxic polycyclic aromatic hydrocarbon ortho-quinones generated by aldo-keto reductases induce CYP1A1 via nuclear transloaction of the aryl hydrocrabon receptor. Cancer Res. 2000;60:908–915. [PubMed] [Google Scholar]
- 32.Steckelbroeck S, Oyesanmi B, Jin Y, Lee SH, Kloosterboer HJ, Penning TM. Tibolone metabolism in human liver is catalyzed by 3α/3β-hydroxysteroid dehydrogenase activities of the four isoforms of the aldo-keto reductase (AKR)1C subfamily. J Pharmacol Exp Ther. 2006;316:1300–1309. doi: 10.1124/jpet.105.091587. [DOI] [PubMed] [Google Scholar]
- 33.Shultz CA, Quinn AM, Park JH, Harvey RG, Bolton JL, Maser E, Penning TM. Specificity of human aldo-keto reductases, NAD(P)H:quinone oxidoreductase, and carbonyl reductases to redox-cycle polycyclic aromatic hydrocarbon diones and 4-hydroxyequilenin-o-quinone. Chem Res Toxicol. 2011;24:2153–2166. doi: 10.1021/tx200294c. [DOI] [PMC free article] [PubMed] [Google Scholar]
- 34.Smithgall TE, Harvey RG, Penning TM. Regio- and stereospecificity of homogeneous 3α-hydroxysteroid-dihydrodiol dehydrogenase for trans-dihydrodiol metabolites of polycyclic aromatic hydrocarbons. J Biol Chem. 1986;261:6184–6191. [PubMed] [Google Scholar]
- 35.Smithgall TE, Harvey RG, Penning TM. Spectroscopic identification of ortho-quinones as the products of polycyclic aromatic trans-dihydrodiol oxidation catalyzed by dihy-drodiol dehydrogenase. A potential route of proximate carcinogen metabolism. J Biol Chem. 1988;263:1814–1820. [PubMed] [Google Scholar]
- 36.Westerink WM, Schoonen WG. Phase II enzyme levels in HepG2 cells and cryopreserved primary human hepatocytes and their induction in HepG2 cells. Toxicol In Vitro. 2007;21:1592–1602. doi: 10.1016/j.tiv.2007.06.017. [DOI] [PubMed] [Google Scholar]
Associated Data
This section collects any data citations, data availability statements, or supplementary materials included in this article.


