

Summary
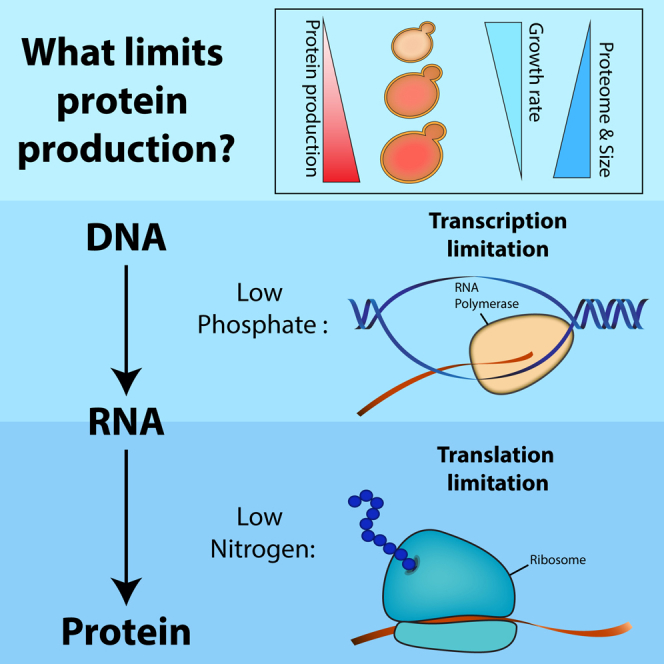
The economy of protein production is central to cell physiology, being intimately linked with cell division rate and cell size. Attempts to model cellular physiology are limited by the scarcity of experimental data defining the molecular processes limiting protein expression. Here, we distinguish the relative contribution of gene transcription and protein translation to the slower proliferation of budding yeast producing excess levels of unneeded proteins. In contrast to widely held assumptions, rapidly growing cells are not universally limited by ribosome content. Rather, transcription dominates cost under some conditions (e.g., low phosphate), translation in others (e.g., low nitrogen), and both in other conditions (e.g., rich media). Furthermore, cells adapted to enforced protein production by becoming larger and increasing their endogenous protein levels, suggesting limited competition for common resources. We propose that rapidly growing cells do not exhaust their resources to maximize growth but maintain sufficient reserves to accommodate changing requirements.
Keywords: budding yeast, fitness cost, protein burden, protein synthesis
Graphical Abstract
Highlights
-
•
Libraries expressing increasingly high protein amounts are extensively studied
-
•
Processes that limit protein production vary, depending on growth conditions
-
•
Ribosomes are not universally limiting in rapidly growing cells
-
•
Cells adapt by increasing their size and the abundance of endogenous proteins
Kafri et al. investigate the processes that limit protein production. They find that enforcing either gene transcription or protein translation reduces growth rate, depending on growth conditions. Cells adapt by increasing their size and endogenous proteome content, suggesting that rapidly growing cells are not resource limited.
Introduction
Protein production in living cells is tightly coordinated with external conditions and intracellular demands. This regulation ensures that needed proteins are produced, while those whose function is not compatible with current needs are not. It may also serve to minimize the cost of protein production; indeed, making proteins consumes cellular resources by using energy and nutrients as building blocks and also by occupying common cellular machineries such as ribosomes, polymerases, or chaperones, whose abundance may be limiting. Defining the cost of protein production, and the molecular processes limiting this production, is a central challenge in cellular physiology, which is relevant in particular for understanding the interplays among cell growth, cell division, and cell size.
The cost of protein production is commonly attributed to protein translation (Andrews and Hegeman, 1976, Emilsson and Kurland, 1990, Kurland, 1992, Marr, 1991, Molin et al., 1974, Scott and Hwa, 2011, Scott et al., 2010, Vind et al., 1993). A major fraction of the cellular GTP pool is used for amino acid polymerization, while significantly lower quantities are invested in other processes including gene transcription and protein folding (Russell and Cook, 1995, Schimmel, 1993). Ribosomes were implicated as the major factor limiting growth of rapidly growing cells (Dennis et al., 2004, Emilsson and Kurland, 1990, Klumpp et al., 2013, Maaløe and Kjeldgaard, 1966, Marr, 1991, Russell and Cook, 1995, Scott et al., 2010, Scott et al., 2014, Vind et al., 1993), following the discovery that most of the cellular biosynthetic activity is devoted to making ribosomes (Bremer and Dennis, 1996) and the observation that ribosome content is tightly coordinated with cell growth rate (Bremer and Dennis, 1996, Schaechter et al., 1958, Warner, 1999). However, there is still a need for experimental data that directly map the molecular mechanisms limiting protein expression.
The cost of protein production was extensively studied in E. coli. Forced overexpression of the Lac operon in medium lacking lactose leads to reduced cell growth and arrested the cell cycle when reaching ∼30% of total proteome (Dong et al., 1995, Horiuchi et al., 1962, Nguyen et al., 1989, Novick and Weiner, 1957, Scott et al., 2010). This reduced growth was broadly interpreted as the cost of protein production (Dong et al., 1995, Klumpp et al., 2013, Scott et al., 2010, Stoebel et al., 2008, Zamenhof and Eichhorn, 1967), although a recent study provided an alternative interpretation (Eames and Kortemme, 2012). Only limited data are available describing protein burden in eukaryotic cells (Hauf et al., 2000, Lang et al., 2009, MacLean, 2007), and it is not clear whether results inferred from one cell type, or from specific conditions, can be generalized to other organisms and environments.
In this paper, we examined the relative contributions of gene transcription and protein translation to the cost of protein production in budding yeast, S. cerevisiae, and mapped the limitation to the initiation versus elongation steps of each process. We found that transcription and translation can both be limiting, depending on the growth conditions. In particular, our data challenge the hypothesis that ribosome content is a universal limiting factor defining growth rate of rapidly growing cells, as only slow-growing cells appeared to be limited in ribosome content. Notably, endogenous protein expression was increased, rather than decreased, upon forced production of inert proteins, suggesting that the protein production capacity can readily adapt to increasing demands. We discuss the implications of our data for describing the interplay between protein production and cell growth.
Results
Systematic Study of Protein Burden
Microorganisms are optimized for rapid growth. We therefore analyzed the impact of enforcing protein production on cell growth rate. Expressing mCherry fluorescent protein using one of the strongest yeast promoters (pTDH3, glyceraldehyde-3-phosphate dehydrogenase enzyme) resulted in a change in growth rate that was below our experimental resolution (∼2%). To enforce higher expression levels, we cloned the pTDH3-driven mCherry construct into a plasmid that integrates into the genome in multiple copies and generated a library of strains expressing one up to ∼20 copies of this construct (Figures 1A, 1B, and S1A), as measured by mCherry fluorescence and verified by qPCR of genomic DNA (Figure 1C). Proportionality between fluorescence levels and DNA copy numbers was maintained for the full range of integrations and was compatible with protein abundances measured by western blots (Figures 1D and S1B). A comparable library was generated also using GFP, giving consistent results (Figure S3B). We calibrated the measured fluorescence levels using 15 GFP-fused proteins and available abundances data (Figures 1E and S1C; Table S3; Supplemental Experimental Procedures). By this, we estimate that a single pTDH3-GFP construct contributes ∼2% to the cellular proteome.
Figure 1.

Generating Libraries of Strains Expressing Increasing Amounts of Chromosomally Integrated Fluorescence Proteins
(A) TDH3 promoter driving mCherry expression (pTDH3-mCherry) was cloned into a plasmid that, when transformed into yeast cells, integrates into the genome in multiple copies (Figure S1A).
(B) mCherry expression range can be appreciated from the differences in the colonies’ color (left panel, natural light). Fluorescence images of individual cells expressing low or high mCherry copies (middle panel) and superimposed with bright light (right panel). No aggregates were observed in high-burdened cells (n > 1,000 cells). Scale bar, 5 μm.
(C) Differences between colonies were quantified using a flow cytometer (fluorescence-activated cell sorting [FACS]) measuring mCherry fluorescence and by qPCR. The FACS copy number was obtained by normalizing using the 1 copy strain fluorescence. Error bars indicate SE of three biological repeats
(D) Quantification of the mCherry proteins using western blots. Error bars indicate SE.
(E) Calibration curve defining the fraction of cellular proteins made by a single pTDH3-GFP construct. Fifteen distinct GFP-fused strains spanning a range of abundances were chosen. Their fluorescence levels were quantified using a flow cytometer and plotted as a function of their protein abundance in PPM (parts per million) as described in Supplemental Experimental Procedures and Figure S1C. Horizontal error bars represent SE between different measurements in Table S3, and vertical error bars represent the SD between different fluorescence measurements. Vertical dashed blue line indicates 2.3% from the proteome.
(F) Growth curve on rich media (YPD). Shown is the log2(OD) of the low-burden (one copy) and high-burden (18 copies) strains. Data were fitted with a sigmoid fit (Matlab function sigm_fit). Error bars indicate SD of three biological replicates.
(G) Quantifying growth fitness. Cells expressing a given level of mCherry were co-incubated with a GFP-labeled wild-type strain for ∼30 generations, during which, their relative frequencies were quantified using a flow cytometer. Relative growth rate defined with respect to wild-type cells was calculated from the rate by which the frequency of the mCherry expressing cells was reduced.
(H) The fitness cost of protein expression. The relative growth rates of mCherry-expressing cells as a function of mCherry fluorescence. Cells were grown in YPD. The red line indicates expression levels estimated as ∼2% total endogenous proteins.
Growth Fitness Decreases in Proportion to the Expressed Proteins
We measured the growth rate of our library strains using two methods. First, we used direct comparison of growth curves of strain expressing a single copy or 18 integrations of pTDH3-mCherry. The strain with 18 copies grew ∼18% slower than the stain expressing a single copy (Figure 1F). Second, relative growth rates were quantified for the full library using a sensitive competition assay (Figure 1G). Strains containing different integration number of pTDH3-mCherry were co-incubated with GFP-labeled wild-type cells, and their relative abundance in the population of growing cells was quantified at subsequent times using a flow cytometer. When cells were grown in rich media (YPD) and maintained in log phase by serial dilutions, the relative growth rate decreased linearly with increasing mCherry fluorescence (Figure 1H). Also by this estimate, each additional copy of the construct reduces the growth rate by ∼1% (Figure S1D).
To examine whether protein burden depends on growth conditions, we repeated our measurements when growing cells in different media, this time allowing cells to enter and exit stationary phase. In all conditions tested, growth rate decreased linearly with increasing mCherry expression, although to different extents (Figures 2A, 2C, and S2). Notably, cells growing in low-phosphate conditions appeared less sensitive to the introduced burden compared to cells growing in standard media, possibly reflecting their somewhat lower division rate. Exit from prolonged starvation was also delayed (Figure 2B), as was reported for E. coli (Shachrai et al., 2010). Finally, when growing cells in continuous cultures, burdened cells reached a lower steady-state density (Figure 2D), indicating that they require a higher influx of the limiting nutrient for maintaining the same imposed growth rate.
Figure 2.

Fitness Cost of Forcing Unneeded Protein Expression Is Condition Dependent
(A) The fitness cost of protein expression depends on the growth conditions. The reduced growth rate of pTDH3-mCherry expressing cells was quantified in the different specified conditions and is plotted as a function of the mCherry fluorescence. Note that in all cases, the growth rates are reduced in proportion to mCherry expression, but the magnitude of the fitness cost depends on the tested condition. The cells were grown on SC (blue), low-phosphate (0.2 mM phosphate, red), and low-nitrogen media (50 μM of ammonium sulfate, cyan). For more conditions, see Figure S2A.
(B) Protein burden during recovery from starvation. Cells were grown in SC to stationary phase and were left in this media for 1 week before being transferred back to fresh media. Shown is the recovery time (hours) from starvation, defined by the time required for 50% increase in cell density.
(C) Generation time in the different media tested. Error bars indicate SE of three biological repeats. See also Figures S2C–S2H.
(D) The OD600 in steady state in continuous culture (dilution time: SC, 3 hr; low phosphate and low nitrogen, 4 hr). Measurements’ mean during 5–12 hr with SD lower than 0.005 between the different measurements.
Repeating our experiment using an additional library of lower-expression-capacity strains did not show measurable growth defects, verifying that the reduced fitness is not due to the multiple genomic integrations (Figures 3A, S3C, and S3D). In contrast, replacing wild-type GFP by its ∼20-fold less stable variant (Mateus and Avery, 2000) had the same effect on fitness, confirming that growth is not impaired by accumulating GFP (Figures 3B and S3A). Consistent with this, neither the mCherry nor the GFP proteins formed detectable aggregates (Figures 1B and S3F–S3H; Supplemental Information). Because Tdh3p is a key enzyme in glycolysis (McAlister and Holland, 1985), the reduced growth rate of our strain could reflect impaired glycolysis resulting from competition with endogenous TDH3 expression. Fluorescence levels in our library, however, increased linearly with the DNA copy number (Figure 1C), suggesting limited competition between copies. Furthermore, two additional libraries, in which mCherry was driven by different promoters (pPDC1 and pPGK1), showed practically the same fitness cost when normalized by expression levels (Figure 3C). More directly, we verified that the expression of Tdh3-GFP-fused protein was not lower in burdened cells in any of the conditions tested (Figure S3I). Therefore, we can conclude that the reduced fitness of our library strains does not result from the multiple genomic integrations, protein toxicity, or impaired glycolysis, suggesting that it is the result of a limitation in the protein production process itself.
Figure 3.

Fitness Cost Arises from the Protein Production Process
(A) Genomic integrations do not contribute significantly to the measured fitness cost. Library construction was repeated, replacing the TDH3 promoter with the weaker RPS5 promoter, without a terminator (DAmP-RPS5, bottom). The relative growth rates of the cells in those two libraries are plotted as a function of the genomic copy number (top). Note the negligible reduction in growth rate for the DAmP-RPS5-based library (Figures S3C and S3D).
(B) Protein toxicity does not contribute significantly to the measured fitness cost. Library construction was repeated, replacing the mCherry first by a wild-type GFP and then by a destabilized version of GFP (open gray, marked with asterisk), which was obtained by fusing GFP to the CLN2 degradation box (Muhlrad and Parker, 1999). When driven by the same TDH3 promoter, the destabilized GFP fluorescence was reduced by ∼20-fold (bottom). The relative growth rates of the cells in these two libraries is plotted as a function of the integration copy number, showing the same fitness cost independently of the number of expressed GFP proteins (top). Note that the fitness cost of the pTDH3-GFP- and pTDH3-mCherry-expressing strains were practically identical (Figure S3B). Cells were grown in SC media. For low-phosphate media see Figure S3A.
(C) Expression by different promoters results in a similar fitness cost. Two additional libraries were constructed, in which mCherry was driven by different promoters as shown. Expression levels driven by the PDC1 promoter are similar to those of TDH3, whereas expression levels driven by the PGK1 promoter are ∼2-fold lower (bottom). In this experiment, cells were grown in YPD and kept in log phase by frequent dilutions. For more conditions, see Figure S3E.
Gene Transcription and Protein Translation Both Contribute to Protein Burden, Depending on Growth Conditions
We next wished to examine the relative contribution of protein translation and gene transcription to the cost of protein production. To this end, we generated an additional library in which mCherry was expressed from a destabilized mRNA (DAmP [decreased abundance by mRNA perturbation]; Figure 4A) (Muhlrad and Parker, 1999, Schuldiner et al., 2005), thereby reducing the translation load while maintaining the same transcription burden. Indeed, when expressed using the same TDH3 promoter, the DAmP strain produced ∼10-fold lower mCherry fluorescence (Figure S4A) and ∼30-fold less mRNA as measured by qPCR (not shown). The burden on the translation machinery was thus reduced by ∼10-fold. By comparing fitness cost in these two libraries, we could therefore distinguish the cost coming from transcription from that coming from the translation process; a cost that results from burdened translation depends only on the amount of mCherry produced, independently of whether it was transcribed from wild-type or destabilized mRNA. In contrast, the cost originating from limiting transcription will depend on the genomic copy number (transcribed genes), irrespective of how many proteins were eventually produced (Figure S4B).
Figure 4.

The Relative Contribution of Transcription and Translation to the Fitness Cost of Protein Production
(A) Experimental strategy. mCherry protein fused to the Adh1 terminator, under the TDH3 promoter (black). mCherry DAmP construct (red) have the same mCherry gene under the same TDH3 promoter followed by antibiotic resistance cassette. The lack of the terminator in the mCherry construct reduces the mRNA stability and leads to ∼10-fold lower protein translation (Figure S4A). Accordingly, DAmP strains have the same mRNA transcription but much lower translation.
(B) Fitness cost of strains from the wild-type and DAmP libraries grown in different conditions: The reduced growth rate of the strains in the wild-type and DAmP libraries are plotted as a function of protein fluorescence and as a function of the integration copy number in the different conditions, as indicated. (Top) When phosphate is limiting, fitness cost is dominated by gene transcription. Fitness scales with the copy number, but not with the fluorescence levels, indicating low contribution of protein translation to the reduced fitness. (Middle) In the low-nitrogen condition, the major contributor to the fitness cost is translation. (Bottom) In standard media (SC), there is contribution of both transcription and translation. For additional promoters, see Figure S4C.
(C and D) The relative contribution of transcription and translation to protein burden is condition specific. Shown is the relative (C) and absolute effect per copy number (D) contribution of transcription and translation to protein burden. The model is described in Supplemental Experimental Procedures. The error bars indicate the SE around the median. In (C), n = 3/2/2 (low phosphate/SC/low nitrogen, respectively). In (D), the error bars indicate the variation in the total cost and n = 5/3/3 (low phosphate/SC/low nitrogen, respectively).
We applied this approach to cells growing at three different conditions: low phosphate, low nitrogen, and standard media (SC). The relative contribution of transcription versus translation to the measured burden varied depending on growth conditions. In medium low in phosphate, the cost scaled with the genomic copy number, indicating that transcription is limiting. In contrast, in medium low in nitrogen, the cost scaled more with mCherry fluorescence, indicating that translation is limiting. In standard media (SC), both transcription and translation contributed about equally to the fitness cost (Figures 4B–4D, S4C, and S4D).
Cells growing in low phosphate are therefore limited in their transcription capacity, while cells growing in low nitrogen are limited in their translation capacity. To further verify that, we examined whether these different conditions inflict differential sensitivity to drugs that inhibit protein translation or gene transcription. Indeed, cells growing in low nitrogen were more sensitive to the translation-inhibiting drug hygromycin B, while cells growing in low phosphate were more sensitive to the transcription-inhibiting drug phenanthroline (Figures S4E–S4I; Supplemental Information).
Initiation and Elongation Contribute to Protein Burden in a Condition-Dependent Manner
We next wished to map the measured limitations to the initiation or the elongation steps of the respective transcription/translation processes. To this end, we generated an additional library, in which mCherry ORF (open reading frame) was fused to GFP ORF. The two ORFs were separated by a linker, and were transcribed as a single unit using the TDH3 promoter (Figure 5A). mCherry fluorescence levels were invariant to the addition of GFP (Figure S5B). Comparing the fitness of the new library to the original mCherry library enabled us to distinguish the relative contribution of initiation and elongation to protein burden. In standard media (SC), the fitness cost scaled with mCherry fluorescence, irrespectively of GFP production, indicating that initiation is limiting. In contrast, in medium low in nitrogen, the cost scaled with the total length of the transcribed proteins, indicating that elongation is limiting (Figures 5B and S5D).
Figure 5.

The Relative Contribution of Initiation and Elongation to the Fitness Cost of Protein Production
(A) Experimental strategy. The mCherry mRNA (black) was extended to also code for the GFP ORF (red). The two ORFs were separated by a linker, and an additional library was constructed. When driven by the same TDH3 promoter, cells expressing this allele showed the same mCherry fluorescence (Figure S5B). Therefore, the mCherry and mCherry-GFP libraries posed the same burden on the initiation process but differed in the burden on elongation.
(B) Distinguishing the contribution of initiation versus elongation to the fitness cost. Shown is the relative growth rate of strains in the specified libraries, which is plotted as a function of the mCherry fluorescence (left) and as a function of the length of the translated proteins (right). (Top) SC media. Note that fitness cost scales with the level of mCherry fluorescence, independently of the presence of GFP, indicating low contribution of elongation to the cost. (Middle) Limiting nitrogen. Note that fitness cost is dominated by elongation. (Bottom) Limiting phosphate. Note that both initiation and elongation contribute to the fitness cost.
(C) mCherry-Stop construct. As in (B), the mCherry mRNA was extended to code for GFP ORF. However, in this construct, the linker between the two ORFs contains translation stop codons. An additional library was constructed using this construct. The addition of the stop codon resulted in a lower mRNA levels, presumably due to nonsense mediated decay (Hentze and Kulozik, 1999; Figures S5B and S5C).
(D) Distinguishing between the contribution of transcription elongation versus translation elongation to the fitness cost. Shown is the fitness cost of all three libraries specified in (A) and (C). (Left) Limiting nitrogen. All phenotypic cost in all three libraries scaled with the normalized fluorescence, indicating that fitness cost is dominated by translation elongation. (Right) Limiting phosphate. Strains of the mCherry (black dots) and mCherry-stop (blue dots) libraries scale with the genomic copy number, indicating that the limitation is mainly due transcription initiation. Strains of the mCherry-GFP library (red dots) show a somewhat higher fitness cost when scaled with the genomic copy number, indicated a minor contribution of translation elongation.
Introducing a stop codon between the mCherry and GFP, reduced mCherry levels, likely reflecting nonsense-mediated mRNA decay (Hentze and Kulozik, 1999; Figures 5C, S5B, and S5C). Fitness cost of expressing this construct in low-nitrogen medium still scaled with the total length of the translated proteins (mCherry only) (Figure 5D, left). Together, this maps the limitation in low nitrogen to translation elongation. In contrast, when growing this library in low phosphate, fitness cost scaled primarily with the genomic copy number and not with protein fluorescence, consistent with transcription initiation being the main limiting factor (Figure 5D, right). Fitness cost here was still somewhat lower than that of the fused Cherry-GFP, suggesting a minor contribution of translation elongation.
Translation Initiation Is Limiting in Slow-Growing Respiring Cells
Ribosome content and energy are critical resources for protein translation and are often implicated in limiting protein production (Andrews and Hegeman, 1976, Emilsson and Kurland, 1990, Klumpp et al., 2013, Maaløe and Kjeldgaard, 1966, Marr, 1991, Scott et al., 2010, Scott et al., 2014, Vind et al., 1993). We were therefore surprised that translation did not emerge as the universal, or major, factor limiting growth of our rapidly proliferating cells. Furthermore, even in the one case where limitation was mapped exclusively to translation elongation (low-nitrogen medium), it is more likely due to shortage of amino acids previously reported under these conditions (Boer et al., 2010). We reasoned that this might reflect the unconstrained availability of energy expected from fermenting cells, which direct the vast majority of their carbon molecules to produce ethanol (Figure 6A). Indeed, each glucose molecule generates two ATP molecules when fermented, but it can generate 36 ATPs if respired, so that a minor re-direction of the carbon flux toward respiration could provide all additional energy required when the translation capacity is forced to increase. As a result, we predicted that energy, and subsequently translation, would become limiting when growing cells on a suboptimal carbon source that cannot be fermented.
Figure 6.

Translation Initiation Is Limiting in Slow-Growing Respiring Cells
(A) Central carbon metabolism in budding yeast. When provided with glucose as a carbon source, cells direct more carbon into fermentation (ethanol production) with only a minor fraction used for respiration.
(B) Translation is limiting in YEPG-growing cells. mCherry and DAmP libraries are plotted; they scale with the fluorescence, indicating that the relative growth rate affected mainly by the amount of translated proteins.
(C) The translation initiation process is limiting in YEPG-growing cells. mCherry and Cherry-GFP libraries are plotted; they scale with mCherry fluorescence, indicating that the relative growth rate affected mainly by the number of created proteins and not by their length. The Cherry-Stop strain is also scaled with them, indicating that translation initiation is the limiting factor.
(D) Condition-dependent origin of protein burden. A summary of the data from Figures 4, 5, and 6. Error bars indicate SE.
To test this possibility, we grew our cells on a mixed ethanol-glycerol media. Cells division time was ∼6 hr (Figure S6A), compared to 1.5 hr for cells grown on glucose-supported media. As predicted, limitation was mapped exclusively to translation; the reduced fitness of the DAmP and wild-type strains scaled with the amount of produced proteins, irrespective of mRNA stability (Figures 6B and S6B).
Energy limitation could directly impact on translation elongation and perhaps indirectly impact ribosomal machinery, as producing ribosomes is the major biosynthetic activity of the cell (Bremer and Dennis, 1996, Russell and Cook, 1995). We found that the cost of expressing the fused mCherry-GFP protein was the same as that of expressing mCherry alone, indicating that the limitation is due to translation initiation (Figures 6C, 6D, and S6C). While ribosome content could limit either initiation or elongation, a recent theoretical analysis concluded that initiation is the rate-limiting step in ribosome function (Shah et al., 2013). Together, our results suggest that during this slow growth on a non-fermentable carbon source, protein production is limited by ribosome content.
Cells Adapt to the Enforced Protein Production by Increasing Their Cell Size and Making More Endogenous Proteins
It is often assumed that microbes are optimized for rapid growth (Schaechter et al., 1958). Accordingly, it is expected that cells grow at their maximal possible capacity and cannot further increase their overall biosynthesis. In this framework, enforcing expression of unneeded proteins would necessarily come at the expense of producing other proteins (Klumpp et al., 2013, Scott et al., 2010, Shachrai et al., 2010). Our finding that ribosome content is not limiting under conditions of rapid growth, prompted us to re-visit this assumption. If protein production is not constrained, cells might grow larger when forced to express excessive amounts of proteins. We therefore examined whether cell size increased in our library strains using a Coulter counter. Indeed, cell volume increased in proportion to the produced mCherry proteins, with cells becoming up to ∼40% bigger. This increase is consistent with the estimated fraction of added proteins and may therefore be at least partially explained by the extra proteins being produced (Figures 7A and 7B). Note that as a consequence of the increased cell size, cell volume in our library is negatively correlated with the cell growth rate (Figure 7C). This negative correlation contrasts the typical positive correlation between size and division observed upon changing conditions (Schaechter et al., 1958) but resembles the relationship observed when the influx of glucose does not match the levels predicted by sensing the environment (Schmidt-Glenewinkel and Barkai, 2014).
Figure 7.

Forcing Protein Production Results in an Increased Cell Size
(A–C) Increased size of burdened cells. Cell size was measured using a Coulter counter. Volume is shown as a function of the genomic copy number (A), mCherry fluorescence (B), or growth rate (C), and the color gradient denotes the increasing copy number. Fluorescence in YPEG cannot be compared due to high autofluorescence of the medium.
(D) Experimental setup for measuring GFP level with the increased burden. Low- and high-haploid-burdened strains were mated with a library of ∼90 GFP-fused genes and then subjected to a SGA protocol, resulting in new haploids containing both the GFP-fused gene and our mCherry burden. The low- and high-burden strains for each GFP gene (left and right density clouds, respectively) grew together in the same well, allowing a highly controlled comparison of the GFP levels. Black dashed lines represent the GFP and mCherry medians of the two strains. Shown is an FACS-data example of the TSA1 gene. For a gene list, see Table S4.
(E) Protein levels increase with the increasing burden throughout the different conditions. For each mCherry copy-numbers bin, the median of GFP fluorescence ratio (high/low) was calculated. The endogenous gene levels are shown with the binned mCherry copy number, and a linear fit was plotted (dashed line; see also Figures S7B–S7D and Supplemental Experimental Procedures). Error bars indicate SE in the bin.
We next asked whether expression of the enforced mCherry protein comes at the expense of endogenous protein expression. To examine that, we selected a group of ∼90 GFP-fused proteins that span a broad range of expression levels (Figure S7A; Table S4) and used the synthetic genetic array (SGA) technique (Cohen and Schuldiner, 2011, Tong et al., 2001) to introduce the GFP-fused proteins into mCherry-burdened cells. In short, the SGA technique consists of mating an haploid cell expressing a given GFP-fused protein with a haploid cell expressing either high or low mCherry levels, subjecting the resulting diploid to meiosis and sporulation, germinating the spores, and selecting for haploids that contain both markers. We found variable levels of mCherry expression following SGA using the high burden strain, indicating instability of the long tandem integrations during meiosis (not shown). We next mixed together haploids containing the same GFP-fused proteins but either high or low mCherry proteins, grew them to log phase, and measured their fluorescence using flow cytometry. This provided direct comparison of the endogenous GFP-fused protein in high- and low-burden cells grown under the same precise conditions (Figure 7D).
Notably, expression of endogenous proteins increased, rather than decreased, when enforcing high expression of mCherry proteins. Furthermore, on average, the increase in expression was proportional to the amount of enforced mCherry production and was dependent on the growth condition. The strongest effect was observed for cells grown in standard media (SC), where we observed an averaged ∼20% increase in endogenous protein expression in cells expressing ∼18 copies of the pTDH3-mCherry construct. Cells growing in low phosphate or low nitrogen also increased their endogenous protein expression in proportion to the enforced mCherry production, but to a significantly lower amount. In none of the cases did we observe an overall decreased average expression of the endogenous proteins below the low-burden GFP amounts (Figures 7E and S7B–S7D).
Discussion
Common notion holds that microorganisms, including bacteria and yeast, are optimized for rapid growth, making the most efficient use of nutrients once these become available in order to outgrow other microorganisms that share the same habitat. Proteins are the growth driving force, but their production is a major consumer of energy and nutrients. What are the fundamental limits on cell growth rate? What cellular resources are limiting, and how are they distributed? What limits protein production, and how do these limitations impact the cell division cycle? Our study touches on these questions by systematically interrogating the origins and consequences of protein burden: the reduced growth rate of cells that are forced to express increasingly high amounts of inert proteins.
We report three main results. First, we demonstrate that forcing cells to either transcribe or translate inert proteins reduces cell growth in proportion to the introduced burden, and we map the relative contributions of these processes in different conditions. Second, we find that the capacity of the cells to tolerate increased demand for transcription or translation differs between growth conditions, even when the growth rates themselves remain largely similar. Finally, we show that cells adapt to the enforced burden by increasing their size and increasing the abundances of endogenous proteins, suggesting a general adaptation of the protein production machinery and a limited competition for common resources.
Our results call for revisiting some common notions invoked for describing the physiology of cell growth. The first is the question of whether maximal growth rate is set by optimal allocation of ribosomes, dedicating the maximal possible fraction of ribosomes to the task of producing new ribosomes. This notion comes largely from the realization that cell growth is fundamentally limited by ribosome translation. For example, if 50% of the ribosomes are occupied in making new ribosomes, each one of those ribosomes will need to translate two ribosomes within each cell cycle. In E. coli, ribosome translation requires 6–10 min, in agreement with their 20-min minimal division time (Scott et al., 2010). Our results imply that budding yeast does not work in this limit, consistent with the larger difference between cell-cycle time (∼90 min) and the time it takes to translate a eukaryotic ribosome (∼24 min; Planta and Mager, 1998, Waldron et al., 1977; Supplemental Information). Thus, ribosome content was not universally limiting in the rapid growth conditions we tested. When we grew cells in medium containing low levels of phosphate (while maintaining rapid growth; Figure 2C), limitation was mapped to transcription initiation. Cells growing in SC were equally limited by transcription and translation initiation, whereas in yeast growing in low-nitrogen conditions, limitation was mapped to translation elongation (Figure 6D). This may be attributed to a shortage of ribosomes, but we find it more likely to result from the shortage of amino acids that has been described for this medium (Boer et al., 2010). Therefore, ribosome activity readily adapts to the increasing translation demands, at least in some conditions. A likely implication of our results is therefore that rapidly growing cells do not produce proteins at their maximal possible capacity. This, again, calls for revisiting the common assumption that protein production is set by maximizing the use of some limiting resource, be it the ribosome, nutrient, or any other factor. Indeed, we show that cells readily adapt to the increased protein production by increasing in size and the amount of endogenous proteins.
If ribosomes, or other factors, are not limiting protein production and cell growth, what defines a cell’s growth rate, and how does it depend on the number of proteins produced? Our data suggest that growth control involves the coordination of a variety of processes that function in parallel, with different growth conditions altering the relative importance of these processes. Proposed cell physiological models (Bremer and Dennis, 1996, Keren et al., 2013, Klumpp et al., 2013, Scott et al., 2010, Zaslaver et al., 2009) provide the necessary rigorous framework for formulating such limitations and testing possible hypotheses about their consequences. Still, the space of possible models is too broad considering the scarcity of available experimental data. The experimental setup we have described provides data essential for restricting and refining the resource allocation models toward the goal of understanding cell physiology and, in particular, the interplay among protein production, cell size, and cell growth.
Yeast, like bacteria, is a fast-growing organism. By contrast, in higher eukaryotes, most cells grow slower. Further, while budding yeast metabolize glucose by fermentation, respiration is predominant in most cells predominantly. By these criteria, these cells would be more similar to our glycerol-grown cells, in which ribosomes appear to be limiting. It would be interesting to extent similar studies for these different cell types.
Experimental Procedures
Strains and Media
All of the budding yeast (S. cerevisiae) strains in this study were based on BY4741, BY4742 (Brachmann et al., 1998), or Y8205 (Tong and Boone, 2007) laboratory strains. Manipulations were performed using a standard PEG;LiAC;ssDNA protocol (Gietz and Woods, 2002). For strains and plasmids used in this research, see Supplemental Experimental Procedures and Table S1; for strain stability, see Supplemental Information.
Strains were grown in YPD medium, YPEG medium, SC medium, or SC medium depleted of a specific nutrient, as described in the main text. Glucose-limiting media contained 0.2% glucose. For starvation experiments, cells were grown to stationery phase in SC medium overnight (optical density [OD] ∼10) and were left without shaking at 30°C for 1 week. See Supplemental Experimental Procedures for further details.
Competition Assays
Cells were grown to stationery phase in the relevant media overnight. GFP and mCherry strains were then co-incubated in the specified media at 30°C. Frequencies of GFP versus mCherry cells were measured by flow cytometry. The cells were diluted once a day and may have reached stationary phase (except for the YPD log experiment, in which cells were diluted every ∼9 hr). For more details and calculations, see Supplemental Experimental Procedures. The full list of competition experiments performed is given in Table S2.
qPCR
Cells were harvested and frozen immediately in liquid nitrogen; DNA and RNA were extracted using MasterPure Complete DNA and RNA Purification Kit (Epicenter, MC85200), respectively. Next, RNA was reverse-transcribed to cDNA using M-MLV Reverse Transcriptase kit (Promega, M1701). cDNA and DNA levels were compared to the wild-type (WT) using ACT1 gene as reference (LightCycler 480, Roche).
Lag-Time Measurements
Following starvation, cells were returned to fresh SC medium and their OD600 was measured every 10 min using an absorbance reader (Sunrise, Tecan). Lag time was defined as the time it took the cells to increase their OD600 by 1.5-fold.
Growth Curves and Generation Time
Cells were grown overnight in the different media, then diluted to OD600 ∼0.1 into shake flasks. ODs were measured (Novaspec Plus, Amersham Biosciences) every 90/40 min (low-nitrogen medium/other media, respectively) for ∼12 hr and a final OD600 measurement after ∼24 hr. Next, growth curves were plotted: log2(OD) as a function of time in hours. The generation time was calculated as 1/s’, where s’ is the slope’s linear part in the growth curve.
Quantitative Western Blots
Post-alkaline NaOH protein extraction protocol was performed followed by standard quantitative western blot. See Supplemental Experimental Procedures for further details.
Soluble, Insoluble, and Total Protein Isolation and Relative Quantification
Soluble, insoluble, and total protein isolation and relative quantification were performed as previously described (Geiler-Samerotte et al., 2011). Quantitative western blots were performed as described above.
Microscopy
Cells were grown overnight to stationary phase, then diluted to a final OD of ∼0.5. The photos were taken by a Delta Vision 1 microscope (Applied Precision) with the following optics objective: Olympus 60×/1.42, Plan Apo N.
Cell Size
All the strains were diluted after overnight growth and left growing to OD600 ∼0.3. Next the cultures were diluted 1:40 with 0.5 M NaCl and immediately measured in a Multisizer4 Coulter counter (Beckman Coulter) (Coulter, 1953).
GFP Level Measurements
Haploids from the SGA selection, which possessed both the GFP-tagged protein and the different copies of mCherry, were grown overnight in the relevant media. The following day, cells from each plate were diluted 20× and mixed 1:1.5 (low:high burden) and were left to grow with shaking at 30°C for ∼5 hr (∼6 hr for low-nitrogen medium) before analysis in the flow cytometer (∼80,000 cells per well). See Supplemental Experimental Procedures for further details.
Data Analysis and Modeling
For the protein abundance calculation of one genomic copy strain, see Supplemental Experimental Procedures.
For protein cost origin analysis and modeling and GFP haploid libraries analysis, see Supplemental Experimental Procedures.
Author Contributions
M.K. and E.M.-R. designed experiments, performed research, interpreted data and wrote the manuscript. G.J. designed chemostat experiments and performed research. N.B. designed and supervised research, interpreted data, and wrote the manuscript.
Acknowledgments
We thank N. Vardi for introducing the integration method, the Schuldiner lab for the kind help with generating the SGA protocol and for the quantitative western blot analysis, and our lab members for the fruitful discussions. This work was supported by the ERC and the ISF.
Published: December 24, 2015
Footnotes
This is an open access article under the CC BY-NC-ND license (http://creativecommons.org/licenses/by-nc-nd/4.0/).
Supplemental Information includes Supplemental Experimental Procedures, seven figures, and four tables and can be found with this article online at http://dx.doi.org/10.1016/j.celrep.2015.12.015.
Supplemental Information
Data from PaxDB (Wang et al., 2012) and CYCLOPS (Koh et al., 2015) as indicated in the headers.
References
- Andrews K.J., Hegeman G.D. Selective disadvantage of non-functional protein synthesis in Escherichia coli. J. Mol. Evol. 1976;8:317–328. doi: 10.1007/BF01739257. [DOI] [PubMed] [Google Scholar]
- Boer V.M., Crutchfield C.A., Bradley P.H., Botstein D., Rabinowitz J.D. Growth-limiting intracellular metabolites in yeast growing under diverse nutrient limitations. Mol. Biol. Cell. 2010;21:198–211. doi: 10.1091/mbc.E09-07-0597. [DOI] [PMC free article] [PubMed] [Google Scholar]
- Brachmann C.B., Davies A., Cost G.J., Caputo E., Li J., Hieter P., Boeke J.D. Designer deletion strains derived from Saccharomyces cerevisiae S288C: a useful set of strains and plasmids for PCR-mediated gene disruption and other applications. Yeast. 1998;14:115–132. doi: 10.1002/(SICI)1097-0061(19980130)14:2<115::AID-YEA204>3.0.CO;2-2. [DOI] [PubMed] [Google Scholar]
- Bremer H., Dennis P. Modulation of chemical composition and other parameters of the cell by growth rate. In: Neidhardt F.C., editor. Escherichia Coli and Salmonella. ASM Press; 1996. pp. 1553–1569. [Google Scholar]
- Cohen Y., Schuldiner M. Humana Press; 2011. Advanced Methods for High-Throughput Microscopy Screening of Genetically Modified Yeast Libraries. [DOI] [PubMed] [Google Scholar]
- Coulter, W.H. (1953). Means for counting particles suspended in a fluid. http://www.cyto.purdue.edu/cdroms/cyto10a/seminalcontributions/media/keypapers/2656508.pdf.
- Dennis P.P., Ehrenberg M., Bremer H. Control of rRNA synthesis in Escherichia coli: a systems biology approach. Microbiol. Mol. Biol. Rev. 2004;68:639–668. doi: 10.1128/MMBR.68.4.639-668.2004. [DOI] [PMC free article] [PubMed] [Google Scholar]
- Dong H., Nilsson L., Kurland C.G. Gratuitous overexpression of genes in Escherichia coli leads to growth inhibition and ribosome destruction. J. Bacteriol. 1995;177:1497–1504. doi: 10.1128/jb.177.6.1497-1504.1995. [DOI] [PMC free article] [PubMed] [Google Scholar]
- Eames M., Kortemme T. Cost-benefit tradeoffs in engineered lac operons. Science. 2012;336:911–915. doi: 10.1126/science.1219083. [DOI] [PubMed] [Google Scholar]
- Emilsson V., Kurland C.G. Growth rate dependence of transfer RNA abundance in Escherichia coli. EMBO J. 1990;9:4359–4366. doi: 10.1002/j.1460-2075.1990.tb07885.x. [DOI] [PMC free article] [PubMed] [Google Scholar]
- Geiler-Samerotte K.A., Dion M.F., Budnik B.A., Wang S.M., Hartl D.L., Drummond D.A. Misfolded proteins impose a dosage-dependent fitness cost and trigger a cytosolic unfolded protein response in yeast. Proc. Natl. Acad. Sci. USA. 2011;108:680–685. doi: 10.1073/pnas.1017570108. [DOI] [PMC free article] [PubMed] [Google Scholar]
- Gietz R.D., Woods R.A. Transformation of yeast by lithium acetate/single-stranded carrier DNA/polyethylene glycol method. Methods Enzymol. 2002;350:87–96. doi: 10.1016/s0076-6879(02)50957-5. [DOI] [PubMed] [Google Scholar]
- Hauf J., Zimmermann F.K., Müller S. Simultaneous genomic overexpression of seven glycolytic enzymes in the yeast Saccharomyces cerevisiae. Enzyme Microb. Technol. 2000;26:688–698. doi: 10.1016/s0141-0229(00)00160-5. [DOI] [PubMed] [Google Scholar]
- Hentze M.W., Kulozik A.E. A perfect message: RNA surveillance and nonsense-mediated decay. Cell. 1999;96:307–310. doi: 10.1016/s0092-8674(00)80542-5. [DOI] [PubMed] [Google Scholar]
- Horiuchi T., Tomizawa J.-I., Novick A. Isolation and properties of bacteria capable of high rates of β-galactosidase synthesis. Biochim. Biophys. Acta. 1962;55:152–163. doi: 10.1016/0006-3002(62)90941-1. [DOI] [PubMed] [Google Scholar]
- Keren L., Zackay O., Lotan-Pompan M., Barenholz U., Dekel E., Sasson V., Aidelberg G., Bren A., Zeevi D., Weinberger A. Promoters maintain their relative activity levels under different growth conditions. Mol. Syst. Biol. 2013;9:701. doi: 10.1038/msb.2013.59. [DOI] [PMC free article] [PubMed] [Google Scholar]
- Klumpp S., Scott M., Pedersen S., Hwa T. Molecular crowding limits translation and cell growth. Proc. Natl. Acad. Sci. USA. 2013;110:16754–16759. doi: 10.1073/pnas.1310377110. [DOI] [PMC free article] [PubMed] [Google Scholar]
- Kurland C.G. Translational accuracy and the fitness of bacteria. Annu. Rev. Genet. 1992;26:29–50. doi: 10.1146/annurev.ge.26.120192.000333. [DOI] [PubMed] [Google Scholar]
- Lang G.I., Murray A.W., Botstein D. The cost of gene expression underlies a fitness trade-off in yeast. Proc. Natl. Acad. Sci. USA. 2009;106:5755–5760. doi: 10.1073/pnas.0901620106. [DOI] [PMC free article] [PubMed] [Google Scholar]
- Maaløe O., Kjeldgaard N.O. W.A. Benjamin; New York: 1966. Control of macromolecular synthesis a study of DNA, RNA, and protein synthesis in bacteria. [Google Scholar]
- MacLean R.C. Pleiotropy and GAL pathway degeneration in yeast. J. Evol. Biol. 2007;20:1333–1338. doi: 10.1111/j.1420-9101.2007.01351.x. [DOI] [PubMed] [Google Scholar]
- Marr A.G. Growth rate of Escherichia coli. Microbiol. Rev. 1991;55:316–333. doi: 10.1128/mr.55.2.316-333.1991. [DOI] [PMC free article] [PubMed] [Google Scholar]
- Mateus C., Avery S.V. Destabilized green fluorescent protein for monitoring dynamic changes in yeast gene expression with flow cytometry. Yeast. 2000;16:1313–1323. doi: 10.1002/1097-0061(200010)16:14<1313::AID-YEA626>3.0.CO;2-O. [DOI] [PubMed] [Google Scholar]
- McAlister L., Holland M.J. Differential expression of the three yeast glyceraldehyde-3-phosphate dehydrogenase genes. J. Biol. Chem. 1985;260:15019–15027. [PubMed] [Google Scholar]
- Molin S., von Meyenburg K., Gullov K., Maaloe O. The size of transcriptional units for ribosomal proteins in Escherichia coli. Mol. Gen. Genet. 1974;129:11–26. doi: 10.1007/BF00269262. [DOI] [PubMed] [Google Scholar]
- Muhlrad D., Parker R. Aberrant mRNAs with extended 3′ UTRs are substrates for rapid degradation by mRNA surveillance. RNA. 1999;5:1299–1307. doi: 10.1017/s1355838299990829. [DOI] [PMC free article] [PubMed] [Google Scholar]
- Nguyen T.N., Phan Q.G., Duong L.P., Bertrand K.P., Lenski R.E. Effects of carriage and expression of the Tn10 tetracycline-resistance operon on the fitness of Escherichia coli K12. Mol. Biol. Evol. 1989;6:213–225. doi: 10.1093/oxfordjournals.molbev.a040545. [DOI] [PubMed] [Google Scholar]
- Novick A., Weiner M. Enzyme induction as an all-or-none phenomenon. Proc. Natl. Acad. Sci. USA. 1957;43:553–566. doi: 10.1073/pnas.43.7.553. [DOI] [PMC free article] [PubMed] [Google Scholar]
- Planta R.J., Mager W.H. The list of cytoplasmic ribosomal proteins of Saccharomyces cerevisiae. Yeast. 1998;14:471–477. doi: 10.1002/(SICI)1097-0061(19980330)14:5<471::AID-YEA241>3.0.CO;2-U. [DOI] [PubMed] [Google Scholar]
- Russell J.B., Cook G.M. Energetics of bacterial growth: balance of anabolic and catabolic reactions. Microbiol. Rev. 1995;59:48–62. doi: 10.1128/mr.59.1.48-62.1995. [DOI] [PMC free article] [PubMed] [Google Scholar]
- Schaechter M., Maaloe O., Kjeldgaard N.O. Dependency on medium and temperature of cell size and chemical composition during balanced grown of Salmonella typhimurium. J. Gen. Microbiol. 1958;19:592–606. doi: 10.1099/00221287-19-3-592. [DOI] [PubMed] [Google Scholar]
- Schimmel P. GTP hydrolysis in protein synthesis: two fur Tu? Science. 1993;259:1264–1265. doi: 10.1126/science.8446896. [DOI] [PubMed] [Google Scholar]
- Schmidt-Glenewinkel H., Barkai N. Loss of growth homeostasis by genetic decoupling of cell division from biomass growth: implication for size control mechanisms. Mol. Syst. Biol. 2014;10:769. doi: 10.15252/msb.20145513. [DOI] [PMC free article] [PubMed] [Google Scholar]
- Schuldiner M., Collins S.R., Thompson N.J., Denic V., Bhamidipati A., Punna T., Ihmels J., Andrews B., Boone C., Greenblatt J.F. Exploration of the function and organization of the yeast early secretory pathway through an epistatic miniarray profile. Cell. 2005;123:507–519. doi: 10.1016/j.cell.2005.08.031. [DOI] [PubMed] [Google Scholar]
- Scott M., Hwa T. Bacterial growth laws and their applications. Curr. Opin. Biotechnol. 2011;22:559–565. doi: 10.1016/j.copbio.2011.04.014. [DOI] [PMC free article] [PubMed] [Google Scholar]
- Scott M., Gunderson C.W., Mateescu E.M., Zhang Z., Hwa T. Interdependence of cell growth and gene expression: origins and consequences. Science. 2010;330:1099–1102. doi: 10.1126/science.1192588. [DOI] [PubMed] [Google Scholar]
- Scott M., Klumpp S., Mateescu E.M., Hwa T. Emergence of robust growth laws from optimal regulation of ribosome synthesis. Mol. Syst. Biol. 2014;10:747. doi: 10.15252/msb.20145379. [DOI] [PMC free article] [PubMed] [Google Scholar]
- Shachrai I., Zaslaver A., Alon U., Dekel E. Cost of unneeded proteins in E. coli is reduced after several generations in exponential growth. Mol. Cell. 2010;38:758–767. doi: 10.1016/j.molcel.2010.04.015. [DOI] [PubMed] [Google Scholar]
- Shah P., Ding Y., Niemczyk M., Kudla G., Plotkin J.B. Rate-limiting steps in yeast protein translation. Cell. 2013;153:1589–1601. doi: 10.1016/j.cell.2013.05.049. [DOI] [PMC free article] [PubMed] [Google Scholar]
- Stoebel D.M., Dean A.M., Dykhuizen D.E. The cost of expression of Escherichia coli lac operon proteins is in the process, not in the products. Genetics. 2008;178:1653–1660. doi: 10.1534/genetics.107.085399. [DOI] [PMC free article] [PubMed] [Google Scholar]
- Tong A.H.Y., Boone C. Second Edition. Elsevier; 2007. Yeast Gene Analysis. [Google Scholar]
- Tong A.H., Evangelista M., Parsons A.B., Xu H., Bader G.D., Pagé N., Robinson M., Raghibizadeh S., Hogue C.W., Bussey H. Systematic genetic analysis with ordered arrays of yeast deletion mutants. Science. 2001;294:2364–2368. doi: 10.1126/science.1065810. [DOI] [PubMed] [Google Scholar]
- Vind J., Sørensen M.A., Rasmussen M.D., Pedersen S. Synthesis of proteins in Escherichia coli is limited by the concentration of free ribosomes. Expression from reporter genes does not always reflect functional mRNA levels. J. Mol. Biol. 1993;231:678–688. doi: 10.1006/jmbi.1993.1319. [DOI] [PubMed] [Google Scholar]
- Waldron C., Jund R., Lacroute F. Evidence for a high proportion of inactive ribosomes in slow-growing yeast cells. Biochem. J. 1977;168:409–415. doi: 10.1042/bj1680409. [DOI] [PMC free article] [PubMed] [Google Scholar]
- Warner J.R. The economics of ribosome biosynthesis in yeast. Trends Biochem. Sci. 1999;24:437–440. doi: 10.1016/s0968-0004(99)01460-7. [DOI] [PubMed] [Google Scholar]
- Zamenhof S., Eichhorn H.H. Study of microbial evolution through loss of biosynthetic functions: establishment of “defective” mutants. Nature. 1967;216:456–458. doi: 10.1038/216456a0. [DOI] [PubMed] [Google Scholar]
- Zaslaver A., Kaplan S., Bren A., Jinich A., Mayo A., Dekel E., Alon U., Itzkovitz S. Invariant distribution of promoter activities in Escherichia coli. PLoS Comput. Biol. 2009;5:e1000545. doi: 10.1371/journal.pcbi.1000545. [DOI] [PMC free article] [PubMed] [Google Scholar]
Associated Data
This section collects any data citations, data availability statements, or supplementary materials included in this article.
Supplementary Materials
Data from PaxDB (Wang et al., 2012) and CYCLOPS (Koh et al., 2015) as indicated in the headers.