

Abstract
Objectives
The objective of this study was to measure quantitatively antimicrobial de-escalation utilizing electronic medication administration data based on the spectrum of activity for antimicrobial therapy (i.e. spectrum score) to identify variables associated with de-escalation in a nationwide healthcare system.
Methods
A retrospective cohort study of patients hospitalized for healthcare-associated pneumonia was conducted in Veterans Affairs Medical Centers (n = 119). Patients hospitalized for healthcare-associated pneumonia on acute-care wards between 5 and 14 days who received antimicrobials for ≥3 days during calendar years 2008–11 were evaluated. The spectrum score method was applied at the patient level to measure de-escalation on day 4 of hospitalization. De-escalation was expressed in aggregate and facility-level proportions. Logistic regression was used to assess variables associated with de-escalation. ORs with 95% CIs were reported.
Results
Among 9319 patients, the de-escalation proportion was 28.3% (95% CI 27.4–29.2), which varied 6-fold across facilities [median (IQR) facility-level de-escalation proportion 29.1% (95% CI 21.7–35.6)]. Variables associated with de-escalation included initial broad-spectrum therapy (OR 1.5, 95% CI 1.4–1.5 for each 10% increase in spectrum), collection of respiratory tract cultures (OR 1.1, 95% CI 1.0–1.2) and care in higher complexity facilities (OR 1.3, 95% CI 1.1–1.6). Respiratory tract cultures were collected from 35.3% (95% CI 32.7–37.7) of patients.
Conclusions
De-escalation of antimicrobial therapy was limited and varied substantially across facilities. De-escalation was associated with respiratory tract culture collection and treatment in a high complexity-level facility.
Introduction
Effective antimicrobial stewardship requires the ability to measure antimicrobial use and promote the selection of optimal antimicrobial regimen, dose, duration and route of administration.1 Guidelines recommend that empirical antimicrobial regimens be de-escalated when diagnostic results are available and the patient's condition stabilizes.2–6 Engaging clinicians to de-escalate broad-spectrum therapy is a key function of stewardship programmes.
De-escalation generally refers to discontinuation of antimicrobials providing a spectrum of activity greater than necessary to treat infection, discontinuation of unnecessary antimicrobials or switching to a narrower spectrum antimicrobial once a patient stabilizes.4 In practice and research, de-escalation events are recognized based upon an intuitive sense of narrow- versus broad-spectrum therapy and what constitutes de-escalation.7 The time-intensive manual chart review required with this approach has resulted in few multicentred studies of de-escalation practice.8–12 Data characterizing inter-facility variability in de-escalation rates or factors associated with improved de-escalation practices are limited.
We developed a method to measure de-escalation based upon the difference between antimicrobial spectra of regimens administered on day 2 and day 4 of hospitalization (i.e. spectrum score method).13 This can be applied to measure de-escalation from antimicrobial administration data without manual chart review. It demonstrated high accuracy in predicting de-escalation events as determined by antimicrobial steward review of antimicrobial regimens administered in healthcare-associated pneumonia (HCAP).13,14
The purpose of this study was to examine the variation in facility-level de-escalation for a system-wide cohort of patients hospitalized with HCAP, in which broad-spectrum empirical antimicrobial therapy and de-escalation are recommended.2 Another objective included determining if collection of bacterial cultures upon admission was associated with enhanced de-escalation practice.
Patients and methods
Setting and patients
Electronic medical records data obtained through the Veterans Informatics and Computing Infrastructure were used to develop the cohort. Admissions to acute-care wards with complete antimicrobial administration data were included if they were admitted to Veteran's Administration (VA) facilities with at least 10 acute-care beds and 15 HCAP admissions during calendar years 2008–11. Only the first inpatient pneumonia diagnosis for each patient in the study period was included. An inpatient diagnosis of pneumonia was defined by International Classification of Diseases, Ninth Revision, Clinical Modification (ICD-9 CM) discharge codes: (i) a primary diagnosis of 480–483 or 485–487.0 (pneumonia), or (ii) a secondary diagnosis of pneumonia coupled with a primary diagnosis of 507.0 (pneumonitis due to inhalation, or aspiration pneumonitis), 518.8 (respiratory failure) or 0.38 (septicaemia).15 In a prior study, we determined that this algorithm had a sensitivity of ∼90% to identify HCAP cases.16 Additional inclusion criteria required administration of antimicrobials within 24 h of admission, continued therapy for ≥3 days and duration of hospitalization between 5 and 14 days. Patients who died before day 5 were excluded. HCAP criteria included: (i) hospitalization within a VA or other facility for at least 2 days during the preceding 90 days; (ii) direct admission from a skilled nursing facility; (iii) chronic haemodialysis [as defined by documentation of inpatient or outpatient ICD-9 CM codes (v45.1, v56, v56.1, v56.2, v56.8, v458.21 and 39.95) or current procedural terminology (CPT) codes (90 918–90 925, G0308-G0319, 36 830–36 833, S993g, 36 145, 36 800, 36 815 and 36 825)] within the preceding 30 days; (iv) home or clinic infusion therapy within the preceding 30 days, and chronic wound care (CPT codes 97 597, 97 598, q4104, q4107, q4108, 14 110, q4111, q4112, q4113, q4114, q4115, q4116, q4117, q4118, q4119, q4120, q4121, 96 401–96 425, 96 440, 96 445, 96 450, 93 521, 96 522, 96 523, 96 542, 96 549 and c8957; or (v) visits to wound, foot, peripherally inserted central catheter or infusion clinics within the preceding 30 days.2
Measurements
Patient-level data included demographics, admitting ward, antimicrobials administered and administration route, microbial culture source and results for cultures obtained ≤1 day prior to or within ≤2 days of hospitalization (hereafter termed ‘admission cultures’). Facility-level data included a measure of complexity, which was based upon patient population, clinical services offered, educational and research missions, and administrative complexity.17 Facility-level responses to survey questions regarding the existence of antimicrobial de-escalation or intravenous to oral conversion policies were obtained from a survey conducted by the VA Antimicrobial Stewardship Task Force (ASTF) that inventoried antimicrobial stewardship activities across all inpatient facilities in 2012.
Description of the spectrum score method and validation exercises has been previously reported.13,14 The method involves assignment of a numerical score to antimicrobial regimens administered during hospitalization based upon the regimen's degree of microbial activity. High scores indicate broad-spectrum therapy relative to lower scores. Regimen scores for hospital calendar day 4 are subtracted from baseline (calendar day 2) regimen scores to calculate a change in spectrum score. We previously reported that antimicrobial stewards were more likely to classify antimicrobial regimens as representing de-escalation events if oral antimicrobials were included in regimens, even for regimens providing similar microbial coverage.14 Therefore, additional credits, worth up to 10% of the possible spectrum score scale, are added to the change in spectrum score based upon the percentage of antimicrobials administered by the oral route by hospital day 4. A positive change in spectrum score signifies de-escalation (day 4 minus day 2 spectrum score > 0), whereas a negative change indicates escalation.
The proportion of admissions with antimicrobial therapy de-escalated was expressed as the proportion of discharges where de-escalation occurred before day 5 of hospitalization. The proportions of patients with escalation and unchanged therapy were calculated similarly, and results were expressed overall and as facility-level proportions with 95% CI [OR (95% CI)]. Summary measures for patient-level cohort characteristics and de-escalation proportions were stratified by baseline therapy regimens and positive admission culture status. The distribution of percentage change in spectrum score, numbers of concurrent antimicrobials administered and percentage of patients receiving oral antimicrobials by day 4 were reported similarly.
Statistical analyses
A mixed-effects logistic regression model was used to test for associations between the probability of antimicrobial de-escalation and covariates. The model included these patient-level covariates as fixed effects: age, sex, hospitalization day 2 spectrum score, year of admission, prior healthcare exposures, whether admission blood and respiratory tract cultures were obtained, admitting ward (ICU or general medical/surgical wards). Facility complexity [(complexity level 1 (most complex) versus levels 2 and 3 (less complex)] was modelled as a random effect.17 Reported ORs were adjusted for other covariates included in the model. To evaluate the potential for confounding, associations between covariates were estimated. The model of de-escalation was re-estimated without potential confounders to observe changes in ORs and significance. The cohort was restricted to the final year of data (2011) to estimate ORs for de-escalation associated with existence of facility antimicrobial de-escalation and intravenous to oral policies as reported in the 2012 VA ASTF survey.
Analyses were conducted with the statistical software R (version 3.1.2). Mixed effect logistic regression models were estimated with the function glmer in the R package lme4 version 1.1–7.
This research complies with all federal guidelines and VA policies relative to Human Subjects and Research.
Results
The cohort consisted of 9319 admissions to 119 VA facilities (Figure 1). The median (IQR) number of admissions per facility was 64 (44–96) (Table 1). Patients were primarily elderly and male, and more than 80% had been recently hospitalized. Most patients were treated in non-ICU settings. Cultures were obtained on admission from the blood and respiratory tract in 82.1% (95% CI 81.2–82.9) and 35.3% (95% CI 33.7–37.0) of patients, respectively. Respiratory tract culturing varied between facilities with a median (IQR) of 35.2% (25.7%–46.3%). Less than 20% of patients had an organism reported from admission cultures. Overall, 6.7% of patients in the cohort had MRSA and 5.8% had Pseudomonas aeruginosa identified from admission cultures.
Figure 1.
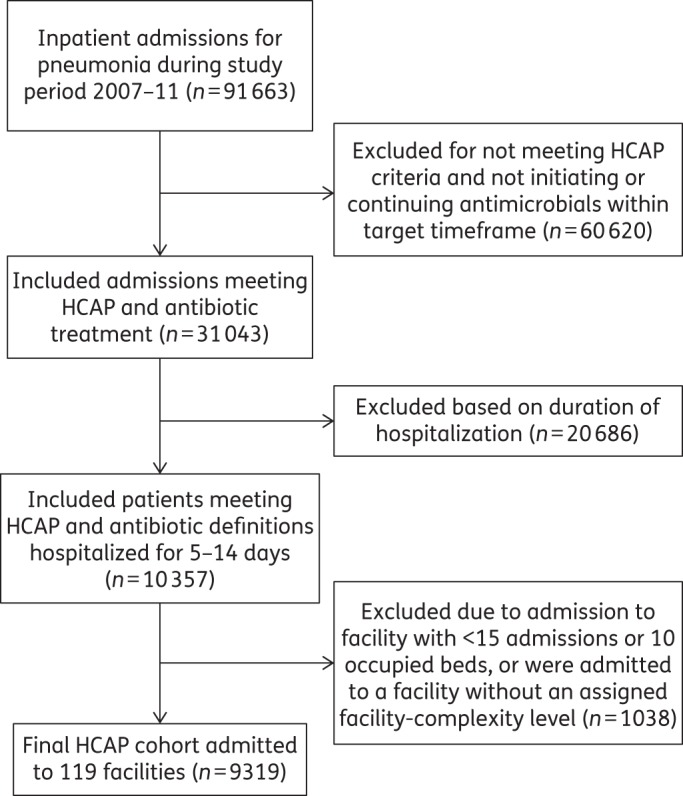
Study flow diagram for HCAP cohort.
Table 1.
Characteristics of the HCAP cohort
| Characteristic | Value | Facility median (IQR) |
|---|---|---|
| Age (years) [mean (SD)] | 72.5 (12.1) | 73.0 (70.0–76.0) |
| Male (%) | 97.8 | 98.1 (96.5–100.0) |
| Prior healthcare exposure (%) | ||
| hospital admission within prior 90 days | 84.1 | 85.9 (78.1–91.2) |
| skilled nursing facility residence upon admission | 16.7 | 12.5 (6.3–25.4) |
| chronic haemodialysis within prior 30 days | 0.2 | 0.0 (0.0–0.0) |
| intravenous antimicrobials within prior 30 days | 8.1 | 13.9 (7.3–22.7) |
| wound care within the prior 30 days | 4.4 | 3.1 (0.0–6.5) |
| ICU admission (%) | 11.6 | 10.6 (6.4–16.1) |
| Admission respiratory tract culture obtained (%) | 35.3 | 35.2 (25.7–46.3) |
| Admission blood culture(s) obtained (%) | 82.1 | 83.3 (77.6–86.7) |
| Culture-positive admission (%) | 17.6 | 20.7 (14.5–27.6) |
| respiratory tract (%) | 14.0 | 16.1 (9.7–22.9) |
| bloodstream (%) | 5.9 | 6.9 (4.1–9.5) |
There were 551 distinct antimicrobials or combination antimicrobial regimens administered to the cohort at baseline; however, 20 regimens accounted for more than 70% of therapies administered (Table 2). The median (IQR) baseline spectrum score was 44.50 (38.50–49.75) on a 60-point scale. Approximately 66.2% (95% CI 65.3–67.2) of patients received an anti-pseudomonal β-lactam and 57.3% (95% CI 56.3–58.3) of patients received MRSA coverage. The combination of at least one anti-pseudomonal and one anti-MRSA antimicrobial (guideline similar therapy) was administered in 52.6% (95% CI 51.6–53.7) of patients.16 Patients who received guideline similar therapy had higher median baseline spectrum scores than patients receiving alternative therapies (45.25 versus 37.25; P < 0.001).
Table 2.
Baseline antimicrobial regimens and spectrum scores
| Antimicrobial regimen groups | Cohort receiving antimicrobial or regimen (%) | Baseline spectrum score for regimena |
|---|---|---|
| Category A (anti-pseudomonal β-lactams) | 66.2 | 44.50 (44.50–53.00) |
| Category B (other anti-pseudomonals) | 25.7 | 53.00 (46.75–55.25) |
| Category C (anti-MRSA antimicrobials) | 57.3 | 44.50 (44.50–53.00) |
| Guideline similar therapy | 52.6 | 45.25 (44.50–53.25) |
| Category A + B combinations | 18.3 | 55.25 (52.75–55.25) |
| Category A + C combinations | 50.0 | 45.00 (44.50–54.00) |
| Category B + C combinations | 17.0 | 55.25 (53.00–55.25) |
| Category A + B + C combinations | 14.3 | 55.25 (53.00–55.25) |
| CAP (non-pseudomonal β-lactams or FQ) | 20.1 | 30.75 (30.75–36.25) |
| Other antimicrobials | 1.7 | 12.25 (12.25–29.25) |
| Specific common antimicrobial regimensb | ||
| piperacillin/tazobactam, vancomycin | 17.4 | 44.50 |
| third-generation cephalosporin, macrolide | 8.9 | 30.75 |
| piperacillin/tazobactam, vancomycin, pseudomonal FQ | 8.3 | 55.25 |
| non-pseudomonal FQ | 6.1 | 36.25 |
| piperacillin/tazobactam | 5.2 | 42.25 |
| pseudomonal cephalosporin, vancomycin | 4.7 | 39.75 |
| pseudomonal FQ | 2.8 | 39.75 |
| piperacillin/tazobactam., vancomycin, macrolide | 2.8 | 49.75 |
| piperacillin/tazobactam., pseudomonal FQ | 2.0 | 52.75 |
| pseudomonal cephalosporin, vancomycin, pseudomonal FQ | 1.8 | 53.00 |
| pseudomonal carbapenem, vancomycin | 1.8 | 45.25 |
| piperacillin/tazobactam, vancomycin, non-pseudomonal FQ | 1.5 | 55.25 |
| pseudomonal FQ, vancomycin | 1.5 | 45.50 |
| pseudomonal cephalosporin | 1.3 | 33.25 |
| third-generation cephalosporin | 1.2 | 25.50 |
| non-pseudomonal FQ, Vancomycin | 1.1 | 42.00 |
| piperacillin/tazobactam, macrolide | 1.0 | 47.25 |
| vancomycin | 1.0 | 13.00 |
| piperacillin/tazobactam, non-pseudomonal FQ | 1.0 | 54.00 |
| remaining regimens | 28.8 | 43.00 (39.5–50.75) |
FQ, fluoroquinolone.
Category A antimicrobials (anti-pseudomonal β-lactams): piperacillin/tazobactam, ticarcillin/clavulanate, cefepime, ceftazidime, imipenem, meropenem, aztreonam.
Category B antimicrobials (other anti-pseudomonals): ciprofloxacin, levofloxacin, amikacin, tobramycin, gentamicin, colistin.
Category C antimicrobials (anti-MRSA antimicrobials): vancomycin, linezolid, tigecycline.
CAP antimicrobials: regimens containing ceftriaxone, cefotaxime, ampicillin/sulbactam, ertapenem, moxifloxacin alone or in combination with macrolides or doxycycline without additional antimicrobials from categories A to C.
Other antimicrobials: agents not included in categories A, B, C or CAP antimicrobials. Levofloxacin may have been used to treat CAP; however, the agent is included in category B antimicrobials for treatment of HCAP. Regimens were classified based upon inclusion of any category A, B or C antimicrobial. CAP regimens were classified based upon the absence of A, B or C antimicrobials in addition to the inclusion of CAP antimicrobials.
aBaseline spectrum scores are expressed as a median (IQR) of regimens. Spectrum score scale ranges from 4 to 60 points.
bPiperacillin/tazobactam; third-generation cephalosporin: ceftriaxone, cefotaxime, cefpodoxime, cefdinir; anti-pseudomonal fluoroquinolone: ciprofloxacin, levofloxacin; non-pseudomonal fluoroquinolone: moxifloxacin; pseudomonal cephalosporin: cefepime, ceftazidime; anti-pseudomonal carbapenem: meropenem, imipenem; remaining regimens: 531 distinct antimicrobial combinations that may have included different and/or additional antimicrobials as those listed.
Overall, 28.3% (95% CI 27.4–29.2) of patients underwent de-escalation of therapy by hospital day 4 (Table 3). The de-escalation proportion based solely upon a decrease in spectrum score without assignment of oral credits was 25.8% (95% CI 24.9–26.7). The average reduction in spectrum based on the spectrum score was 24.2% (95% CI 22.5–25.8) among patients who had therapy de-escalated. Consistent with the concept of simplifying therapy, the mean (SD) number of antimicrobials administered on day 4 [( = 1.9 (1.0)] decreased from baseline [( = 2.5 (0.9)] significantly (P < 0.001). De-escalation proportions generally paralleled baseline spectrum scores with the highest de-escalation rates occurring in the upper quartile of baseline spectrum scores. De-escalation proportions for the 20 most commonly prescribed antimicrobial regimens were generally higher for regimens with high baseline spectrum scores. There were 232 distinct regimens administered to patients who had therapy de-escalated. The following seven regimens accounted for 50% of the de-escalations: fluoroquinolones (19.6%), third-generation cephalosporins with or without a macrolide (7.8%), piperacillin/tazobactam (7.2%), piperacillin/tazobactam/vancomycin (6.1%), no antibiotic (4.3%), anti-pseudomonal cephalosporin (3.0%) or an amino-penicillin β-lactamase inhibitor combination (3.0%). The de-escalation proportion for patients who had positive admission cultures was 35.6% (95% CI 34.6–36.5) versus 26.8% (95% CI 25.9–27.7) for patients who did not (P < 0.001). Limiting culture-positive cases to patients initiated on anti-MRSA therapy who had an admission respiratory tract culture obtained but without MRSA identified, indicated that 21.8% (95% CI 19.9–23.7) had anti-MRSA therapy discontinued by day 4. A similar finding was identified for patients initiated anti-pseudomonal β-lactam therapy who did not have P. aeruginosa isolated [anti-pseudomonal β-lactam discontinued in 15.0% (95% CI 13.4–16.6)]. Unadjusted facility-level de-escalation rates exhibited more than a 6-fold difference with a median of 29.1% (IQR 21.7–35.6).
Table 3.
De-escalation rates for patients hospitalized with HCAP
| Outcome or comparison | Result | 95% CI |
|---|---|---|
| De-escalation rate (%) | 28.3 | 27.4–29.2 |
| No change in therapy (%) | 59.7 | 58.7–60.7 |
| Escalation rate (%) | 12.0 | 11.4–12.7 |
| Mean reduction in spectrum score for de-escalations (%) | 24.2 | 22.5–25.8 |
| De-escalation rate based solely on change in spectrum (%) | 25.8 | 24.9–26.7 |
| De-escalation event rate dependent upon inclusion of PO credits (%) | 8.7 | 7.7–9.9 |
| Antimicrobial count for de-escalations day 2 [mean (SD)] | 2.5 (0.9) | NA |
| Antimicrobial count for de-escalations day 4 [mean (SD)] | 1.9 (1.0) | NA |
| De-escalation rate by quartile of baseline (day 2) spectrum score (%) | ||
| quartile 1 (spectrum score range 4.00–38.50) | 17.6 | 16.0–19.1 |
| quartile 2 (spectrum score range 38.75–44.50) | 23.3 | 21.9–24.7 |
| quartile 3 (spectrum score range 44.75–49.75) | 38.5 | 35.8–41.1 |
| quartile 4 (spectrum score range 50.00–60.00) | 42.9 | 40.8–45.1 |
| Guideline similar therapy (spectrum score range 34.25–60.00) (%) | 32.7 | 31.7–33.6 |
| De-escalation rate for patients in ICU day 2 (%) | 34.5 | 33.6–35.5 |
| Culture-positive admissiona (%) | 35.6 | 34.6–36.5 |
| positive blood culturea (%) | 46.6 | 44.7–46.7 |
| positive lower respiratory tract culturea (%) | 35.7 | 34.7–36.7 |
| Culture-negative admission (%) | 26.8 | 25.9–27.7 |
| De-escalation rates for most common baseline antimicrobial regimens (%) | ||
| piperacillin/tazobactam, vancomycin | 24.1 | 22.0–26.2 |
| third-generation cephalosporin, macrolide | 16.9 | 14.4–19.5 |
| piperacillin/tazobactam, vancomycin, pseudomonal FQ | 38.4 | 34.9–41.8 |
| non-pseudomonal FQ | 17.3 | 14.1–20.4 |
| piperacillin/tazobactam | 19.8 | 16.2–23.4 |
| pseudomonal cephalosporin, vancomycin | 16.1 | 12.6–19.5 |
| pseudomonal FQ | 19.9 | 15.1–24.8 |
| piperacillin/tazobactam, vancomycin, macrolide | 41.4 | 35.4–47.4 |
| piperacillin/tazobactam, pseudomonal FQ | 30.5 | 23.9–37.1 |
| pseudomonal cephalosporin, vancomycin, pseudomonal FQ | 29.1 | 22.3–35.9 |
| pseudomonal carbapenem, vancomycin | 15.2 | 9.7–20.6 |
| piperacillin/tazobactam, vancomycin, non-pseudomonal FQ | 41.3 | 33.2–49.3 |
| pseudomonal FQ, vancomycin | 34.3 | 33.3–35.2 |
| pseudomonal cephalosporin | 18.6 | 11.6–25.7 |
| third-generation cephalosporin | 22.5 | 14.8–30.3 |
| non-pseudomonal FQ, vancomycin | 26.0 | 17.5–34.4 |
| piperacillin/tazobactam, macrolide | 27.1 | 18.1–36.0 |
| vancomycin | 5.4 | 0.8–10.0 |
| piperacillin/tazobactam, non-pseudomonal FQ | 35.6 | 25.7–45.4 |
| all other regimens | 38.1 | 27.4–48.9 |
FQ, fluoroquinolone; NA, not applicable; PO, per os (by mouth).
aNote: cultures positive for CoNS, Corynebacterium spp. and yeast were excluded.
Logistic regression analysis indicated de-escalation of antimicrobial therapy was associated with: age (OR 1.1, 95% CI 1.0–1.1; P = 0.006, for each additional 10 years of age), female sex (OR 1.4, 95% CI 1.0–1.9; P = 0.041), baseline broad-spectrum therapy (OR 1.5, 95% CI 1.4–1.5; P < 0.001, for each 6 point increase in spectrum score, i.e. 10% of the 60 point range of possible spectrum scores), respiratory tract culture obtained (OR 1.1, 95% CI 1.0–1.2; P = 0.044) and care in a higher complexity facility (OR 1.3, 95% CI 1.1–1.6; P = 0.003). Patients admitted from a skilled nursing facility were less likely to have therapy de-escalated (OR 0.8, 95% CI 0.7–0.9; P = 0.006). Notable variables that were not associated with de-escalation included ICU admission (OR 1.1, 95% CI 0.9–1.2; P = 0.45), obtaining blood cultures (OR 1.0, 95% CI 0.9–1.2; P = 0.82) and year of study (OR 1.1, 95% CI 1.0–1.1; P = 0.30). There was potential for confounding as patients admitted to facilities that are more complex and patients with a culture obtained from the respiratory tract tended to be younger and to receive initial broad-spectrum therapy more frequently. Re-estimated without age or day 2 spectrum score in the model, the associations between de-escalation of antimicrobial therapy and care in a more complex facility relative to a less complex facility (OR 1.4, 95% CI 1.2–1.7; P < 0.001) and respiratory tract culture obtained (OR 1.2, 95% CI 1.1–1.3; P = 0.001) were similar. Omitting potential confounders from the model, the OR for baseline broad-spectrum therapy was nearly unchanged (OR 1.5, 95% CI 1.4–1.5; P < 0.001). The mixed-effects model was used to compare predictive probability of the facility-level de-escalation proportion for a typical patient from the cohort (Figure 2). After adjustment for covariates a 2-fold difference in facility-level de-escalation rates remained.
Figure 2.
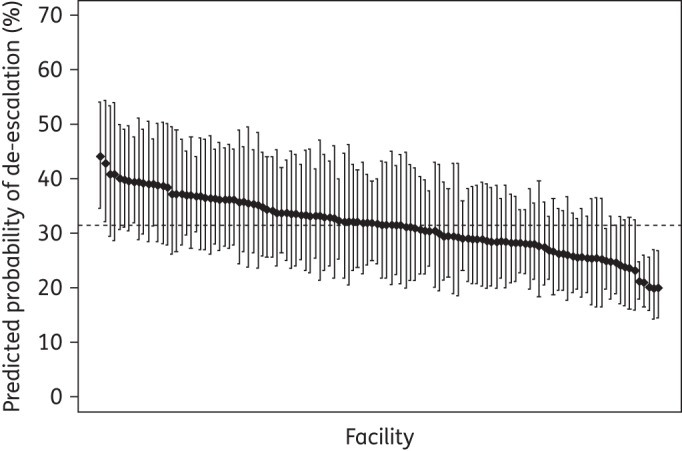
Predicted probability of de-escalation by facility for patients hospitalized with HCAP. The predicted probability of de-escalation (%) by facility is based on a mixed-effects logistic regression model for a typical patient from the cohort. Values for covariates used to fit the model included: admitted 1 January 2010 (study midpoint) to a general medical/surgical unit at a complexity level 1 VA facility, not admitted from a skilled nursing facility, median age (73 years), male, median number of days hospitalized in the last 90 days (6 days), no recent outpatient intravenous therapy, no chronic wound care, median spectrum score on day 2 of inpatient stay (44.50), blood culture(s) obtained and respiratory tract culture not obtained. Regression analyses were based on 9283 admissions at 118 VA facilities with complete data. Facilities are ordered left to right from highest to lowest predicted probability of de-escalation. The broken line represents a facility with median predicted probability of de-escalation (31.6%).
The 2012 ASTF survey indicated that 15.1% of facilities had a de-escalation policy and 24.4% of facilities had an intravenous to oral conversion policy. For the cohort subset admitted in 2011 (n = 2366), a patient's probability of being de-escalated was positively associated with admission to a facility with a de-escalation policy (OR 1.4, 95% CI 1.1–1.8; P = 0.002) and to a facility with an intravenous to oral policy (OR 1.3. 95% CI 1.1–1.5; P = 0.012). De-escalation policies were in place in 17.6% and 9.1% of more and less complex facilities, respectively (OR 2.1, 95% CI 0.6–7.0; P = 0.21). Intravenous to oral conversion policies were in place in 29.7% and 15.9% of more and less complex facilities, respectively (OR 2.2, 95% CI 0.9–5.8; P = 0.097).
Discussion
This study is the first to evaluate antimicrobial de-escalation across a nationwide system of healthcare facilities. Antimicrobial de-escalation was performed in ≤30% of admissions with HCAP. More than half of patients had no change in therapy after 4 days, a timeframe that allows for most diagnostic results to have been reported and for assessment of clinical response to initial therapy. While not a study focus, the heterogeneity of 550 unique antimicrobial regimens prescribed is noteworthy and illustrates the lack of consensus for the treatment of HCAP.18,19
An important finding is the association between respiratory tract cultures and de-escalation; only 35% of the patients had an admission respiratory tract culture obtained. De-escalation was more common in culture-positive cases than culture-negative cases, and de-escalation was more common for patients with positive blood cultures than for patients with positive respiratory tract cultures, suggesting a higher degree of confidence in blood culture results. Culture collection from both sources is recommended as a routine component of the diagnostic work-up for HCAP.2 While not all patients with pneumonia produce sputum and differentiation of colonizing flora from pathogens can be difficult, the absence of antimicrobial-resistant pathogens from a quality sputum specimen suggests that continued coverage for these organisms is unnecessary.20–22 Even when respiratory tract cultures were collected and MRSA or P. aeruginosa were not identified, therapy directed at these pathogens was infrequently discontinued. The findings suggest that both improvement in collection of respiratory tract cultures and utilization of negative culture results to guide therapy represent modifiable factors that may improve de-escalation practice.
Other noteworthy findings include the variation in de-escalation practice across facilities and that more complex facilities had higher de-escalation rates compared with less complex facilities. Presumably, facilities with antimicrobial stewardship programmes are better able to encourage de-escalation, and generally these programmes are located in larger academic medical centres (e.g. more complex facilities).23 It is unknown how many facilities had antimicrobial stewardship programmes during the study period; however, the 2012 ASTF survey findings suggest that formal policies directed towards therapy re-evaluation were associated with improved de-escalation; these policies were more common in complex facilities. In 2014, the VA required that all facilities develop antimicrobial stewardship programmes, and the US Department of Health and Human Services is tasked with creating similar regulations by 2017 for US inpatient healthcare facilities.24,25 Facility-level programme assessments may need to address hospital complexity when evaluating performance.
The majority of studies investigating antimicrobial de-escalation have involved respiratory tract infections or sepsis. A PubMed English language search with the terms ‘antibiotic’ or ‘antimicrobial’ and ‘de-escalation’ or ‘streamlining’ with limits of ‘humans’ within the last 10 years identified 12 studies of interest.21,26–36 Several study definitions have been used to identify de-escalation including: completely stopping therapy;31–37 reduction in the number of antimicrobials prescribed;26–31,36 investigator opinion of narrow versus broad antimicrobial spectrum or antimicrobial de-escalation;27,30–36 and ranking regimens based on the intrinsic activity of anti-pseudomonal β-lactam and fluoroquinolone antimicrobials.10 Many studies provided no definition for the assessment of de-escalation. We identified five multicentred studies of de-escalation, and the de-escalation proportion we observed with the spectrum score method is comparable to these studies.8–12 Recently, Braykov et al.8 conducted an observational cohort study of de-escalation practice utilizing chart review in six hospitals. Patients hospitalized for >3 days with a variety of infections were assessed for de-escalation on day 5 of therapy. The de-escalation rate was 21.5%. These authors identified culture-positive status (OR 2.0, 95% CI 1.2–3.3) and initial broad-spectrum therapy (OR 1.3, 95% CI 1.0–1.7) as predictive of de-escalation status. Other studies have observed similar findings.
Limitations include those associated with other VA studies including evaluation of a predominantly elderly male population hospitalized primarily in non-ICU settings.38 To ensure that we identified new admissions who were started on therapy promptly and remained hospitalized long enough to assess clinical improvement and culture results, we limited the cohort to patients who received therapy within 24 h, continued therapy for ≥72 h and remained hospitalized for 5–14 days. Many VA facilities have relatively small inpatient components; combined with the stringent inclusion criteria some facilities had limited observations for assessment. As the study was retrospective, it is impossible to know if patients actually had pneumonia or if baseline therapy was empirical. However, VA antimicrobial administration data are captured with highly accurate bar code technology and patients were treated irrespective of confirmatory diagnosis. The spectrum score method also has limitations.13,14 Assignment of antimicrobial susceptibility values were based on VA data, and periodic recalibration of the spectrum score relative to changes in susceptibility will be required for continued use. Further, de-escalation assessments occur at specific time-points during therapy rather than at any time during the treatment continuum. Calendar days 2 and 4 were selected for measuring baseline therapy and de-escalation events based upon the opinions of antimicrobial stewards, and our prior validation exercises were based on patient simulations rather than bedside review of patient cases.13,14 Finally, the method does not account for differences in spectrum of initial therapy; it reflects the reduction in microbial spectrum of regimens between days 2 and 4 of therapy. An inherent limitation of our analysis is that the higher the baseline spectrum score, the more potential there is for de-escalation. While the logistic regression analysis adjusted for baseline spectrum of therapy, at some level this limitation may be conceptualized as ‘regression to the mean’. Analytic approaches such as conditional logistic regression to adjust for baseline spectrum scores may be an alternative approach to address this concern.39,40 Despite limitations, the method can be automated, which allows for measurement of de-escalation rates across facilities minimizing the issues of inter-observer reliability and agreement associated with manual chart review.
As de-escalation was more common for culture-positive admissions, future work should include systematic interventions to improve culture collection and microbial diagnosis. The de-escalation outcome of the spectrum score method is dependent upon the initial spectrum or ‘choice’ of antimicrobial regimen in addition to capturing the ‘change’ in therapy, and further work to differentiate these separate but related aspects of therapy would be necessary. Finally, there is a paucity of multicentred data regarding the impact of de-escalation practices on patient outcomes and antimicrobial resistance rates; both should be evaluated.
Conclusions
De-escalation of antimicrobial therapy in HCAP was performed in less than 30% of patients within a large cohort of VA facilities. A substantial difference in the proportion of patients with therapy de-escalated across the facilities was observed. De-escalation rates were higher for patients who received initial broad-spectrum therapy, had cultures obtained from the respiratory tract on admission and were hospitalized in higher complexity facilities. Further, de-escalation was more common in facilities where relevant antimicrobial stewardship policies were present, suggesting that systematic intervention may be beneficial. Accordingly, efforts to determine a microbiological diagnosis in HCAP and formalization of systematic interventions to improve de-escalation practice seem reasonable. Multicentred trials of methods to improve de-escalation rates and evaluate outcomes associated with antimicrobial de-escalation are warranted.
Funding
This work was supported by the National Institute of Allergy and Infectious Diseases at the National Institutes of Health (grant number 1 R15 AI098049-01 to K. M.-K.).
Transparency declarations
K. M.-K. and R. R. have a pending grant submission to the National Institutes of Health that proposes further study of de-escalation based on the ‘spectrum score’ method. All other authors: none to declare.
Disclaimer
The views expressed in this article are solely those of the authors and do not necessarily reflect the position or policy of the Department of Veterans Affairs.
Acknowledgements
This work was supported in part by resources and use of the Boise and George E. Wahlen Veterans Affairs Medical Centers.
References
- 1.Promoting Antimicrobial Stewardship in Human Medicine. http://www.idsociety.org/Stewardship_Policy/.
- 2.American Thoracic Society, Infectious Diseases Society of America. Guidelines for the management of adults with hospital-acquired, ventilator-associated, and healthcare-associated pneumonia. Am J Respir Crit Care Med 2005; 171: 388–416. [DOI] [PubMed] [Google Scholar]
- 3.Dellinger RP, Levy MM, Rhodes A et al. Surviving Sepsis Campaign: international guidelines for management of severe sepsis and septic shock, 2012. Intensive Care Med 2013; 39: 165–228. [DOI] [PMC free article] [PubMed] [Google Scholar]
- 4.Dellit TH, Owens RC, McGowan JE Jr et al. Infectious Diseases Society of America and the Society for Healthcare Epidemiology of America guidelines for developing an institutional program to enhance antimicrobial stewardship. Clin Infect Dis 2007; 44: 159–77. [DOI] [PubMed] [Google Scholar]
- 5.Society for Healthcare Epidemiology of America, Infectious Diseases Society of America, Pediatric Infectious Diseases Society. Policy statement on antimicrobial stewardship by the Society for Healthcare Epidemiology of America (SHEA), the Infectious Diseases Society of America (IDSA), and the Pediatric Infectious Diseases Society (PIDS). Infect Control Hosp Epidemiol 2012; 33: 322–77. [DOI] [PubMed] [Google Scholar]
- 6.CDC. Evidence to Support Stewardship. http://www.cdc.gov/getsmart/healthcare/evidence.html.
- 7.Masterton RG. Antibiotic de-escalation. Crit Care Clin 2011; 27: 149–62. [DOI] [PubMed] [Google Scholar]
- 8.Braykov NP, Morgan DJ, Schweizer ML et al. Assessment of empirical antibiotic therapy optimisation in six hospitals: an observational cohort study. Lancet Infect Dis 2014; 14: 1220–77. [DOI] [PMC free article] [PubMed] [Google Scholar]
- 9.Alvarez-Lerma F, Alvarez B, Luque P et al. Empiric broad-spectrum antibiotic therapy of nosocomial pneumonia in the intensive care unit: a prospective observational study. Crit Care 2006; 10: R78. [DOI] [PMC free article] [PubMed] [Google Scholar]
- 10.Kollef MH, Morrow LE, Niederman MS et al. Clinical characteristics and treatment patterns among patients with ventilator-associated pneumonia. Chest 2006; 129: 1210–8. [DOI] [PubMed] [Google Scholar]
- 11.Leone M, Bechis C, Baumstarck K et al. De-escalation versus continuation of empirical antimicrobial treatment in severe sepsis: a multicenter non-blinded randomized noninferiority trial. Intensive Care Med 2014; 40: 1399–408. [DOI] [PubMed] [Google Scholar]
- 12.Ahmad F, Pogue JM, Marchaim D et al. Evaluation of the potential impact of a carbapenem de-escalation program in an academic healthcare system. J Infect Public Health 2014; 7: 50–3. [DOI] [PubMed] [Google Scholar]
- 13.Madaras-Kelly KJ, Jones M, Remington R et al. Development of an antibiotic spectrum score based on Veterans Affairs culture and susceptibility data for the purpose of measuring antibiotic de-escalation: a modified Delphi approach. Infect Control Hosp Epidemiol 2014; 35: 1103–13. [DOI] [PMC free article] [PubMed] [Google Scholar]
- 14.Madaras-Kelly KJ, Jones M, Remington R et al. Description and validation of a spectrum score method to measure antimicrobial de-escalation from electronic medical records data. BMC Infect Dis 2015; 15: 197. [DOI] [PMC free article] [PubMed] [Google Scholar]
- 15.Aronsky D, Haug PJ, Lagor C et al. Accuracy of administrative data for identifying patients with pneumonia. Am J Med Qual 2005; 20: 319–28. [DOI] [PubMed] [Google Scholar]
- 16.Madaras-Kelly KJ, Remington RE, Sloan KL et al. Guideline-based antibiotics and mortality in healthcare-associated pneumonia. J Gen Intern Med 2012; 27: 845–52. [DOI] [PMC free article] [PubMed] [Google Scholar]
- 17.Korom-Djakovic D, Canamucio A, Lempa M et al. Organization complexity and primary care providers' perceptions of quality improvement culture within the Veterans Health Administration. Am J Med Qual 2014; doi:10.1177/1062860614559743. [DOI] [PubMed] [Google Scholar]
- 18.Ewig S, Welte T, Torres A. Is healthcare-associated pneumonia a distinct entity needing specific therapy? Curr Opin Infect Dis 2012; 25: 166–75. [DOI] [PubMed] [Google Scholar]
- 19.Chalmers JD, Rother C, Salih W et al. Healthcare-associated pneumonia does not accurately identify potentially resistant pathogens: a systematic review and meta-analysis. Clin Infect Dis 2014; 58: 330–9. [DOI] [PubMed] [Google Scholar]
- 20.Mandell LA, Wunderink RG, Anzueto A et al. Infectious Diseases Society of America/American Thoracic Society consensus guidelines on the management of community-acquired pneumonia in adults. Clin Infect Dis 2007; 44 Suppl 2: S27–72. [DOI] [PMC free article] [PubMed] [Google Scholar]
- 21.Schlueter M, James C, Dominguez A et al. Practice patterns for antibiotic de-escalation in culture-negative healthcare-associated pneumonia. Infection 2010; 38: 357–62. [DOI] [PMC free article] [PubMed] [Google Scholar]
- 22.Labelle AJ, Arnold H, Reichley RM et al. A comparison of culture-positive and culture-negative health-care-associated pneumonia. Chest 2010; 137: 1130–7. [DOI] [PubMed] [Google Scholar]
- 23.Johannsson B, Beekmann SE, Srinivasan A et al. Improving antimicrobial stewardship: the evolution of programmatic strategies and barriers. Infect Control Hosp Epidemiol 2011; 32: 367–74. [DOI] [PubMed] [Google Scholar]
- 24.VHA Directive 1031. Antimicrobial Stewardship Programs. http://www.va.gov/vhapublications/ViewPublication.asp?pub_ID=2964.
- 25.Executive Order–Combating Antibiotic-Resistant Bacteria. http://www.whitehouse.gov/the-press-office/2014/09/18/executive-order-combating-antibiotic-resistant-bacteria.
- 26.Koupetori M, Retsas T, Antonakos N et al. Bloodstream infections and sepsis in Greece: over-time change of epidemiology and impact of de-escalation on final outcome. BMC Infect Dis 2014; 14: 272. [DOI] [PMC free article] [PubMed] [Google Scholar]
- 27.Garnacho-Montero J, Gutiérrez-Pizarraya A, Escoresca-Ortega A et al. De-escalation of empirical therapy is associated with lower mortality in patients with severe sepsis and septic shock. Intensive Care Med 2014; 40: 32–40. [DOI] [PubMed] [Google Scholar]
- 28.Shime N, Kosaka T, Fujita N. De-escalation of antimicrobial therapy for bacteraemia due to difficult-to-treat Gram-negative bacilli. Infection 2013; 41: 203–10. [DOI] [PubMed] [Google Scholar]
- 29.Boyce JM, Pop OF, Abreu-Lanfranco O et al. A trial of discontinuation of empiric vancomycin therapy in patients with suspected methicillin-resistant Staphylococcus aureus health care-associated pneumonia. Antimicrob Agents Chemother 2013; 57: 1163–8. [DOI] [PMC free article] [PubMed] [Google Scholar]
- 30.Shime N, Satake S, Fujita N. De-escalation of antimicrobials in the treatment of bacteraemia due to antibiotic-sensitive pathogens in immunocompetent patients. Infection 2011; 39: 319–25. [DOI] [PubMed] [Google Scholar]
- 31.Morel J, Casoetto J, Jospé R et al. De-escalation as part of a global strategy of empiric antibiotherapy management. A retrospective study in a medico-surgical intensive care unit. Crit Care 2010; 14: R225. [DOI] [PMC free article] [PubMed] [Google Scholar]
- 32.De Waele JJ, Ravyts M, Depuydt P et al. De-escalation after empirical meropenem treatment in the intensive care unit: fiction or reality? J Crit Care 2010; 25: 641–6. [DOI] [PubMed] [Google Scholar]
- 33.Eachempati SR, Hydo LJ, Shou J et al. Does de-escalation of antibiotic therapy for ventilator-associated pneumonia affect the likelihood of recurrent pneumonia or mortality in critically ill surgical patients? J Trauma 2009; 66: 1343–8. [DOI] [PubMed] [Google Scholar]
- 34.Schouten JA, Hulscher ME, Trap-liefers J et al. Tailored interventions to improve antibiotic use for lower respiratory tract infections in hospitals: a cluster-randomized, controlled trial. Clin Infect Dis 2007; 44: 931–41. [DOI] [PubMed] [Google Scholar]
- 35.Kim JW, Chung J, Choi SH et al. Early use of imipenem/cilastatin and vancomycin followed by de-escalation versus conventional antimicrobials without de-escalation for patients with hospital-acquired pneumonia in a medical ICU: a randomized clinical trial. Crit Care 2012; 16: R28. [DOI] [PMC free article] [PubMed] [Google Scholar]
- 36.Joung MK, Lee JA, Moon SY et al. Impact of de-escalation therapy on clinical outcomes for intensive care unit-acquired pneumonia. Crit Care 2011; 15: R79. [DOI] [PMC free article] [PubMed] [Google Scholar]
- 37.Singh N, Rogers P, Atwood CW et al. Short-course empiric antibiotic therapy for patients with pulmonary infiltrates in the intensive care unit. A proposed solution for indiscriminate antibiotic prescription. Am J Respir Crit Care Med 2000; 162: 505–11. [DOI] [PubMed] [Google Scholar]
- 38.Rosen AK, Loveland S, Anderson JJ et al. Evaluating diagnosis-based case-mix measures: how well do they apply to the VA population? Med Care 2001; 39: 692–704. [DOI] [PubMed] [Google Scholar]
- 39.Linden A. Assessing regression to the mean effects in health care initiatives. BMC Med Res Methodol 2013; 13: 119. [DOI] [PMC free article] [PubMed] [Google Scholar]
- 40.Barnett AG, van der Pols JC, Dobson AJ. Regression to the mean: what it is and how to deal with it. Int J Epidemiol 2005; 34: 215–20. [DOI] [PubMed] [Google Scholar]