

Abstract
Objectives
Mutations in the gyrase genes cause fluoroquinolone resistance in Mycobacterium tuberculosis. However, the predictive value of these markers for clinical outcomes in patients with MDR-TB is unknown to date. The objective of this study was to determine molecular markers and breakpoints predicting second-line treatment outcomes in M. tuberculosis patients treated with fourth-generation fluoroquinolones.
Methods
We analysed treatment outcome data in relation to the gyrA and gyrB sequences and MICs of ofloxacin, gatifloxacin and moxifloxacin for pretreatment M. tuberculosis isolates from 181 MDR-TB patients in Bangladesh whose isolates were susceptible to injectable drugs.
Results
The gyrA 90Val, 94Gly and 94Ala mutations were most frequent, with the highest resistance levels for 94Gly mutants. Increased pretreatment resistance levels (>2 mg/L), related to specific mutations, were associated with lower cure percentages, with no cure in patients whose isolates were resistant to gatifloxacin at 4 mg/L. Any gyrA 94 mutation, except 94Ala, predicted a significantly lower proportion of cure compared with all other gyrA mutations taken together (all non-94 mutants + 94Ala) [OR = 4.3 (95% CI 1.4–13.0)]. The difference in treatment outcome was not explained by resistance to the other drugs.
Conclusions
Our study suggests that gyrA mutations at position 94, other than Ala, predict high-level resistance to gatifloxacin and moxifloxacin, as well as poor treatment outcome, in MDR-TB patients in whom an injectable agent is still effective.
Introduction
Fluoroquinolones (FQs) are the most important drugs in the treatment of MDR-TB. Phenotypic cross-resistance between FQs has been extensively documented, and breakpoints of newer, fourth-generation FQs (moxifloxacin and gatifloxacin) have been calibrated against older FQs (usually ofloxacin1–6 or levofloxacin). Independent of the medium, MICs of the newer FQs are considerably lower than those of the older ones,2,6–11 and they may remain clinically useful even in the presence of low-level resistance.12–14
Genotypic determinants of resistance to specific drugs or drug classes offer a rapid and highly specific alternative to phenotypic drug susceptibility testing (DST). The majority of mutations found in the quinolone resistance-determining region (QRDR) of the gyrA gene have been correlated with FQ resistance both in laboratory-generated and clinical Mycobacterium tuberculosis isolates.4,5,10,15–21 Two rare gyrA mutations within the QRDR (Thr80Ala and Ala90Gly) do not confer resistance and, in combination, may even increase in vitro susceptibility,7,22 while other mutations constitute phylogenetic markers (95Thr)22,23 without effect on MICs. In some instances, gyrB mutations have been associated with FQ resistance, mainly at codons 538–540 following the TubercList nomenclature,3,17,22,24,25 yet the majority of observed gyrB mutations do not confer phenotypic resistance.22,26
Clinical evidence to support the hypothesis that the greater in vitro activity of newer FQs can overcome resistance to older FQs is sparse.10 In a retrospective study on 106 MDR-TB patients, levofloxacin proved superior to ofloxacin even for ofloxacin-resistant strains (2 mg/L).12 Similarly, moxifloxacin and levofloxacin showed equivalent efficacy in the treatment of 171 MDR-TB patients in South Korea.27 In the mouse model, moxifloxacin had greater sterilizing activity than levofloxacin in MDR-TB treatment.28 Furthermore, 800 mg/kg moxifloxacin demonstrated good efficacy for treatment of mice infected with low-level moxifloxacin-resistant strains (MIC of 0.5 mg/L) and reduced mortality for intermediately resistant strains (2 mg/L), but had no impact on high-level resistant strains (4 mg/L).13 Treatment with a 9 month gatifloxacin-based regimen showed that, in contrast to high-level resistance, low-level gatifloxacin resistance did not adversely affect treatment outcome.14
Nevertheless, the critical threshold drug concentration for fourth-generation FQs above which successful treatment outcome becomes unlikely remains unknown. Moreover, the strength of the association of mutations in the QRDR with treatment outcome remains largely elusive.
The purpose of this study was to identify the MIC breakpoints and the gyrA and gyrB mutations predicting poor clinical outcome with standardized FQ-based MDR treatment regimens.
Methods
Study population and isolates
Isolates from patients with confirmed MDR-TB in the Damien Foundation Bangladesh project are routinely shipped to the Institute of Tropical Medicine in Antwerp for second-line DST and storage at −80°C. During the study period, a total of 1037 MDR-TB patients were treated with ofloxacin-based (n = 240) or gatifloxacin-based (n = 797) standard regimens. In this study, we included all available MDR isolates found to be ofloxacin-resistant in routine testing, together with a random sample of ofloxacin-susceptible MDR-TB isolates from the same site, representing 294 patients. From 2005 to 2010, 61 ofloxacin-resistant and 171 ofloxacin-susceptible MDR-TB isolates had their ofloxacin, gatifloxacin and moxifloxacin MICs determined and gyrA and gyrB sequenced (Figure 1). From 2010 onwards, 95 ofloxacin-resistant isolates were available and had the gatifloxacin MIC determined, as well as gyrA and gyrB sequencing done. In total, 327 MDR-TB isolates were examined from 294 patients.
Figure 1.
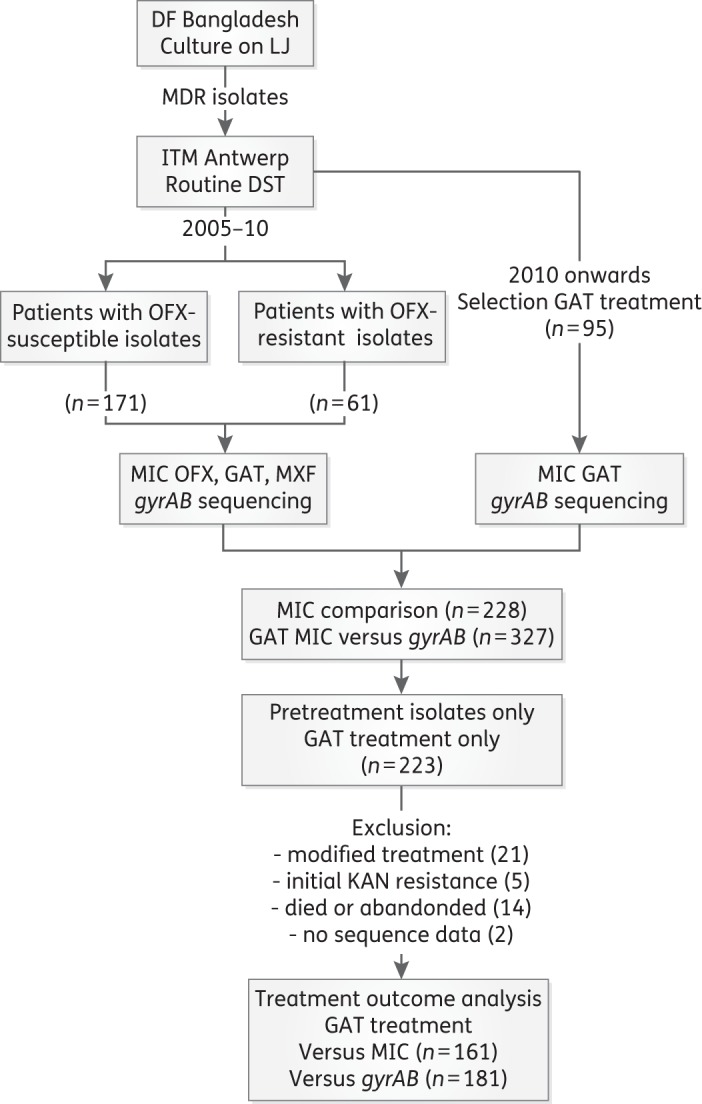
Overview of patients and M. tuberculosis complex isolates included. DF, Damien Foundation; ITM, Institute of Tropical Medicine; OFX, ofloxacin; GAT, gatifloxacin; MXF, moxifloxacin; KAN, kanamycin.
Subsequent to ofloxacin-based regimens for the treatment of MDR, a 9 month MDR treatment regimen was implemented in this area, with high-dose gatifloxacin, ethambutol, pyrazinamide and clofazimine throughout, supplemented during the minimum 4 month intensive phase by kanamycin, prothionamide and isoniazid, colloquially also referred to as the ‘Bangladesh regimen’. Deviations from this standard regimen were kept minimal, such as stopping prothionamide early, or switching to intermittent kanamycin injections. Gatifloxacin doses given were 400 mg for patients weighing <33 kg, 600 mg for those between 33 and 50 kg and 800 mg for those >50 kg, in combination with six other drugs in the intensive phase.29 The bacteriological response was ascertained by sputum smear microscopy and solid-medium-based culture.
The impact of pre-existing FQ resistance on treatment outcome was determined for patients with an FQ-resistant baseline isolate available and bacteriologically defined outcome (cure, failure or relapse) who received the high dose of gatifloxacin. Patients who died or were lost to follow-up, and also those who had documented resistance to second-line injectables (XDR), were excluded from the outcome analysis. Outcome—including ascertainment for relapse during 2 years post-treatment follow-up—was defined following WHO guidelines.30 To declare cure required completion of treatment with five or more negative cultures after the last positive culture. Failure was defined as one or more positive cultures from the fifth month of treatment onwards and relapse as at least one positive culture during the follow-up period. Reclassification of failure or relapse as reinfection or laboratory error (cross-contamination, misidentification) required genotypic confirmation (by spoligotyping and/or 15-locus mycobacterial interspersed repetitive unit–variable number of tandem repeat typing) of strain difference.
Phenotypic DST
Routine DST was done by the proportion method on Löwenstein–Jensen (LJ) medium using established critical concentrations (rifampicin, 40 mg/L; isoniazid, 0.2 and 1 mg/L; ethambutol, 0.2 mg/L) and Middlebrook 7H11 medium (ofloxacin, 2 mg/L; kanamycin, 6 mg/L; ethionamide, 10 mg/L).31 Ethionamide was used as surrogate for prothionamide (used in the regimen).
The MICs of ofloxacin, gatifloxacin and moxifloxacin were determined on LJ medium using the following concentrations: 0.5, 1, 2, 4 and 8 mg/L for ofloxacin and 0.25, 0.5, 1, 2, 4, 8 and 16 mg/L for gatifloxacin and moxifloxacin.31–33 The MIC-99 (henceforth MIC) was the lowest drug concentration determined to inhibit 99% of visible bacillary growth. To this end, drug-containing slants and one control tube were inoculated with a 10−1 dilution of a 1 mg/mL bacterial suspension and a second control tube using a 10−3 dilution. All tubes were inspected for growth after 4 and 6 weeks of incubation at 34–38°C.
Isolates with an MIC value less than or equal to the set breakpoint were considered susceptible; MIC values greater than the breakpoint were defined as resistant.
Sequence analysis
DNA extractions were prepared by resuspending a loopful of bacilli in 200 μL of Tris/EDTA buffer [10 mM Tris–HCl/1 mM EDTA (pH 8.0)], followed by heat inactivation at 100°C for 5 min and centrifugation at 10 000 g for 15 s. Two microlitres of supernatant was used for combined amplification of gyrA and gyrB as described previously.7
For pyrazinamide and clofazimine susceptibility testing, sequencing of the pncA and Rv0678 genes, respectively, was performed in a similar way, using primer pairs pncA-R (5- CGACCTGGAAAGGCAACCCGAGAG-3)/pncA-S (5-CGCCCGATGAAGGTGTCGTAGAAGC-3) and 30F22 (5-AGCCGGAAACTTCGTACTCCAC-3)/916R20 (5-GCTGGACAACACGGTCACCT-3), yielding amplicons of 1163 and 886 bp, respectively. After purification using the ExoSAP-IT® Kit (USB Corporation), sequencing was done using a capillary sequencer (Applied Biosystems 3730 DNA Analyzer) in combination with an ABI Prism BigDye Terminator Cycle Sequencing Kit. Any Rv0678 mutant was considered as potentially causing clofazimine resistance. For pyrazinamide, known resistance-conferring pncA mutations plus all novel mutations in the pncA gene not previously described were considered as resistant.34,35
CLC Sequence Viewer (version 7.0.1) was used for analysis. Mutations were identified using NCBI BLAST and comparing with the M. tuberculosis H37Rv sequence (GenBank accession number NC_000962). An isolate was defined as heteroresistant if both WT and mutant nucleotides conferring resistance at a specific locus were detected.
Data analysis
The primary data were read into an EpiData file for analysis (EpiData Analysis, version 2.2.2.183, freely available at http://www.epidata.dk). To determine differences between observed values, χ2 values, ORs and 95% CIs for categorical data were calculated. Additional analyses were done with R software (R Core Team 2015; http://www.R-project.org). For contingency tables with nominal values (levels of drug concentrations) we calculated Cramer's V (a Pearson's χ2-derived statistic) as the measure of association. To calculate the MIC ratios between ofloxacin and gatifloxacin and between ofloxacin and moxifloxacin, we applied a censored Tobit regression, with gatifloxacin or moxifloxacin, respectively, being the dependent right-censored variable above an MIC of 4 mg/L.
Ethics considerations
Ethics clearance for the treatment regimens was obtained from the Bangladesh Medical Research Council (reference BMRC/ERC/2004-2007/1130). Before enrolment, each patient completed and signed an informed consent form in the local language. Ethics clearance for the retrospective sub-study on the M. tuberculosis isolates was obtained from the Institute of Tropical Medicine Institutional Review Board (reference 833/12).
Results
A total of 228 isolates were available for MIC comparison between ofloxacin, gatifloxacin and moxifloxacin (Figure 1). The MICs of the three FQs were strongly correlated (Cramer's V: 0.555, 0.539 and 0.737, respectively, for ofloxacin versus gatifloxacin, ofloxacin versus moxifloxacin and gatifloxacin versus moxifloxacin), with ofloxacin MICs being systematically and significantly higher relative to gatifloxacin (Table 1). Censored regression analysis revealed a linear correlation between the logarithms of the ofloxacin and gatifloxacin MICs, with the gatifloxacin/ofloxacin MIC ratio (converted back to linear scale) increasing from 3.4 to 5.7 as the gatifloxacin MICs increased from 0.25 to 4 mg/L (Figure 2). Similar MIC ratios and a linear correlation were observed between ofloxacin and moxifloxacin, with a linearized ratio ranging from 3.2 to 4.7 (Figure 2). Moxifloxacin MICs were somewhat higher than those of gatifloxacin (steeper regression slope of moxifloxacin MICs: conc[gatifloxacin] = exp(−1.482 + 0.808*ln(ofloxacin)) vs conc[moxifloxacin] = exp(−1.353 + 0.866*ln(ofloxacin))) (Figure 2).
Table 1.
Correlation between FQ MICs for 228 M. tuberculosis isolates from patients prior to initiation and during follow-up of second-line treatment: ofloxacin versus gatifloxacin, ofloxacin versus moxifloxacin and gatifloxacin versus moxifloxacin
| OFX MIC (mg/L) | GAT MIC (mg/L) |
|||||||
|---|---|---|---|---|---|---|---|---|
| ≤0.25 | 0.5 | 1 | 2 | 4 | 8 | >8 | total | |
| ≤0.5 | 12 | 0 | 0 | 0 | 0 | 0 | 0 | 12 |
| 1 | 83 | 2 | 0 | 0 | 0 | 0 | 0 | 85 |
| 2 | 59 | 16 | 0 | 0 | 0 | 0 | 0 | 75 |
| 4 | 1 | 8 | 1 | 0 | 0 | 0 | 0 | 10 |
| 8 | 0 | 1 | 12 | 3 | 2 | 0 | 0 | 18 |
| >8 | 0 | 0 | 6 | 4 | 5 | 0 | 13 | 28 |
| Total | 155 | 27 | 19 | 7 | 7 | 0 | 13 | 228 |
| OFX MIC (mg/L) | MXF MIC (mg/L) |
|||||||
| ≤0.25 | 0.5 | 1 | 2 | 4 | 8 | >8 | total | |
| ≤0.5 | 12 | 0 | 0 | 0 | 0 | 0 | 0 | 12 |
| 1 | 75 | 10 | 0 | 0 | 0 | 0 | 0 | 85 |
| 2 | 35 | 33 | 7 | 0 | 0 | 0 | 0 | 75 |
| 4 | 0 | 7 | 3 | 0 | 0 | 0 | 0 | 10 |
| 8 | 0 | 1 | 5 | 10 | 1 | 1 | 0 | 18 |
| >8 | 0 | 0 | 2 | 7 | 2 | 3 | 14 | 28 |
| Total | 122 | 51 | 17 | 17 | 3 | 4 | 14 | 228 |
| GAT MIC (mg/L) | MXF MIC (mg/L) |
|||||||
| ≤0.25 | 0.5 | 1 | 2 | 4 | 8 | >8 | total | |
| ≤0.25 | 120 | 33 | 2 | 0 | 0 | 0 | 0 | 155 |
| 0.5 | 2 | 17 | 7 | 1 | 0 | 0 | 0 | 27 |
| 1 | 0 | 1 | 7 | 11 | 0 | 0 | 0 | 19 |
| 2 | 0 | 0 | 1 | 5 | 1 | 0 | 0 | 7 |
| 4 | 0 | 0 | 0 | 0 | 2 | 4 | 1 | 7 |
| 8 | 0 | 0 | 0 | 0 | 0 | 0 | 0 | 0 |
| >8 | 0 | 0 | 0 | 0 | 0 | 0 | 13 | 13 |
| Total | 122 | 51 | 17 | 17 | 3 | 4 | 14 | 228 |
OFX, ofloxacin; GAT, gatifloxacin; MXF, moxifloxacin.
Figure 2.
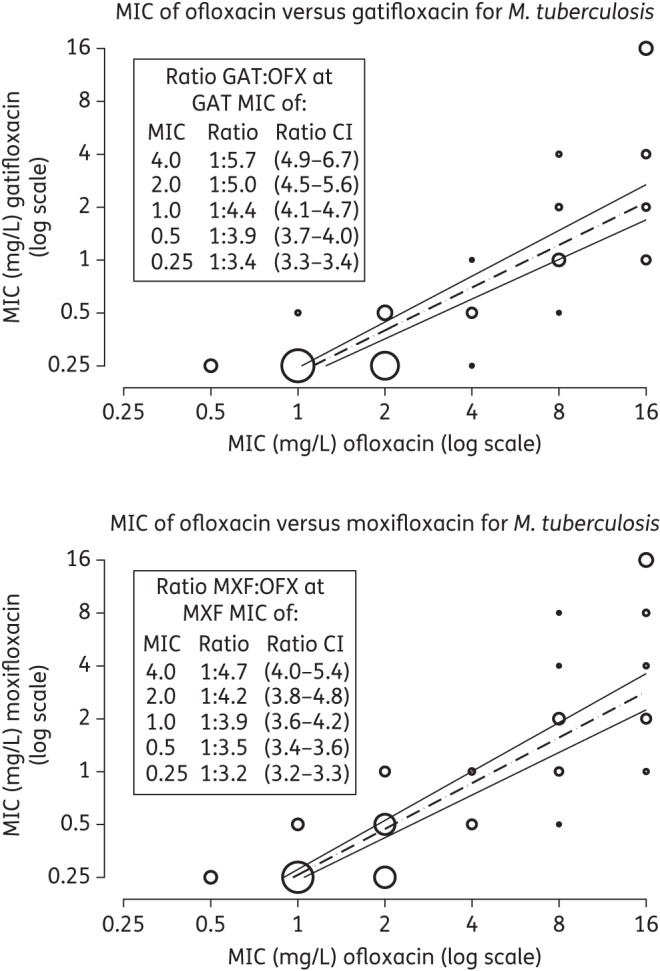
Censored regression analysis for MICs of the fourth-generation FQs (gatifloxacin or moxifloxacin) versus ofloxacin. OFX, ofloxacin; GAT, gatifloxacin; MXF, moxifloxacin. Gatifloxacin and moxifloxacin are right censored above an MIC of 4 mg/L. Bubble sizes are proportional to case density, using the square root of the case number in the stratum.
For all isolates tested, the MICs of moxifloxacin and gatifloxacin were identical in 62.0%, while 35.0% had a 2-fold higher moxifloxacin MIC and in only 2.8% was the moxifloxacin MIC below that of gatifloxacin. These higher MICs of moxifloxacin relative to gatifloxacin were not related to specific mutations, and occurred mostly among the lower MIC values.
A comparison between gatifloxacin MICs and gyrAB sequence data was made for 327 isolates (Figure 1 and Table 2). In 119 of 327 isolates we observed mutations in the QRDRs: 6 gyrB mutants, 96 gyrA mutants, 6 with mutations in both genes, 10 showing heterogeneity in the gyrA gene and 1 showing heterogeneity in the gyrB gene. In addition to QRDR mutations, we observed one deletion of codons 683 and 684 in gyrB, one 615Cys mutation and six isolates showing a 551Arg mutation. All of these had gatifloxacin and moxifloxacin MIC values ≤0.25 mg/L and ofloxacin MICs ranging from 0.5 to 2 mg/L. The 551Arg mutation has been described as not being associated with FQ resistance.36 Hence, we included all of them with the WT isolates.
Table 2.
Correlation between observed mutations in the QRDRs of gyrA and gyrB genes and gatifloxacin MICs for 327 M. tuberculosis isolates from patients prior to initiation and during follow-up of MDR treatment; this table includes all isolates for which gatifloxacin MICs were determined
| gyrAB QRDRs | Gatifloxacin MIC (mg/L) |
|||||||
|---|---|---|---|---|---|---|---|---|
| ≤0.25 | 0.5 | 1 | 2 | 4 | 8 | >8 | total | |
| Total | 162 | 40 | 32 | 32 | 39 | 8 | 14 | 327 |
| WT | 160 | 33 | 4 | 3 | 8 | 0 | 0 | 208 |
| gyrB mutation | 6 | |||||||
| 535Met | 0 | 1 | 1 | 0 | 0 | 0 | 0 | 2 |
| 538Ser | 0 | 0 | 0 | 0 | 0 | 0 | 1 | 1 |
| 539Asn | 0 | 0 | 1 | 0 | 0 | 0 | 0 | 1 |
| 539Ala | 0 | 1 | 0 | 0 | 0 | 0 | 0 | 1 |
| 539Ile | 0 | 0 | 0 | 1 | 0 | 0 | 0 | 1 |
| Heterogeneous WT + gyrB mutation | 1 | |||||||
| WT + 539Asn | 0 | 0 | 0 | 1 | 0 | 0 | 0 | 1 |
| gyrA mutation | 96 | |||||||
| 74Ser | 0 | 2 | 0 | 0 | 0 | 0 | 0 | 2 |
| 88Cys | 0 | 0 | 0 | 1 | 0 | 1 | 0 | 2 |
| 89Asn | 0 | 0 | 0 | 1 | 0 | 0 | 2 | 3 |
| 89Gly | 0 | 0 | 1 | 0 | 0 | 0 | 0 | 1 |
| 90Val | 1 | 2 | 14 | 12 | 0 | 0 | 1 | 30 |
| 91Pro | 0 | 0 | 0 | 2 | 6 | 0 | 0 | 8 |
| 94Ala | 0 | 1 | 7 | 5 | 1 | 0 | 0 | 14 |
| 94Asn | 0 | 0 | 0 | 0 | 1 | 1 | 0 | 2 |
| 94Gly | 0 | 0 | 0 | 5 | 16 | 5 | 2 | 28 |
| 94His | 0 | 0 | 0 | 0 | 1 | 0 | 0 | 1 |
| 94Tyr | 0 | 0 | 0 | 0 | 1 | 1 | 0 | 2 |
| 94Ala + 37Val | 0 | 0 | 0 | 0 | 1 | 0 | 0 | 1 |
| 94Asn + 94Gly | 0 | 0 | 0 | 0 | 1 | 0 | 0 | 1 |
| 90Val + 91Pro | 0 | 0 | 0 | 0 | 0 | 0 | 1 | 1 |
| gyrA + B mutation | 6 | |||||||
| 94Gly + 540Arg | 0 | 0 | 0 | 0 | 0 | 0 | 1 | 1 |
| 90Val + 539Ala | 0 | 0 | 0 | 0 | 1 | 0 | 0 | 1 |
| 94Tyr + 538Ser | 0 | 0 | 0 | 0 | 0 | 0 | 4 | 4 |
| Heterogeneous WT + gyrA mutation | 10 | |||||||
| WT + 89Asn | 0 | 0 | 0 | 0 | 0 | 0 | 1 | 1 |
| WT + 90Val | 0 | 0 | 1 | 1 | 0 | 0 | 0 | 2 |
| WT + 94Ala | 1 | 0 | 2 | 0 | 0 | 0 | 0 | 3 |
| WT + 94Glya | 0 | 0 | 1 | 0 | 2 | 0 | 1 | 4 |
aOne patient had an additional 538Asp mutation.
All but one (90Val) homogeneous QRDR mutants had gatifloxacin MIC values >0.25 mg/L (Table 2). Among six gyrB mutants, the 538Ser mutant had the highest gatifloxacin MIC (>8 mg/L). Among pretreatment isolates only, 31%, 29% and 15% harboured 90Val, 94Gly and 94Ala mutations, respectively. The highest gatifloxacin MIC values were observed for 94Gly mutants, ranging from 2 to ≥16 mg/L, whereas both 90Val and 94Ala mutants tended to have somewhat lower MIC values, ranging from 0.25 to 2 mg/L and from 0.5 to 2 mg/L, respectively (with one exception each; Table 2). All nine either double gyrA mutants or combined gyrA–gyrB mutants had MICs of ≥4 mg/L. The 11 genetically heterogeneous populations (WT + mutant) showed the entire range of MICs.
Isolates with WT QRDRs represented 16.4% of the phenotypically low-level gatifloxacin-resistant strains (MIC >0.5 to ≤2 mg/L), counting only one isolate per patient. Among the total of 208 isolates with a WT QRDR sequence, 15 (7.2%) would be considered resistant, with a gatifloxacin breakpoint to denote resistance set at 0.5 mg/L and 11 (5.3%) if set at 1.0 mg/L. Applying the WHO-recommended ≤1.0 mg/L (for 7H10 agar) to denote susceptibility would result in 32/102 (31.4%) homogeneous QRDR mutants being classified as gatifloxacin-susceptible. The cumulative number of strains plotted along the range of MICs tested37 reveals a maximum discrimination resistant/susceptible as defined by QRDR status at 0.5 mg/L for gatifloxacin (Figure 3), excluding isolates with documented heterogeneous populations.
Figure 3.
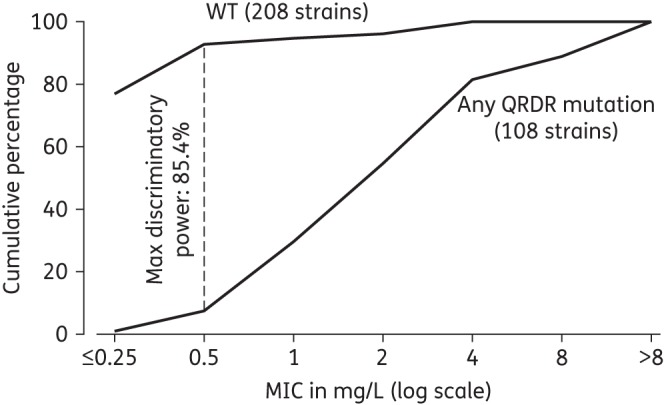
Cumulative percentage of isolates in relation to the gatifloxacin MIC, stratified by absence (WT) or presence of any QRDR mutation in the gyrAB genes (11 heterogeneous populations excluded).
To correlate characteristics of the respective pretreatment M. tuberculosis isolates with treatment outcome, only one pretreatment isolate per patient was included. As ofloxacin has become obsolete in MDR treatment, we limited our analysis to patients treated with a gatifloxacin-based regimen. From these 223, 21 were excluded because of major modifications of the standard treatment protocol, such as addition of linezolid, and 5 because of initial kanamycin resistance. To allow a fair assessment of only patients who had a chance to fail or get cured, we further excluded the 14 patients who died or absconded from treatment and 2 because they had no gyrase result, leaving 181 patient-strains for genotypic-based analysis. For a sub-set analysis on phenotypic correlation, 20 of the 181 were excluded because they had no MIC determination of gatifloxacin, thus leaving 161 single-isolate patient-strains (Figure 1 and Table 3). Among the excluded four patients who had died, two had a gyrA mutation (90Val and 94Ala) while two yielded WT QRDR. Gatifloxacin MICs ranged from ≤0.25 (1 WT) through 2 mg/L (90Val) to 4 mg/L (94Ala and WT).
Table 3.
Cure versus failure/relapse for high-dose gatifloxacin-based treatment stratified by MIC values; only one pre-MDR-treatment isolate per patient included
| GAT MIC (mg/L) | Failure/relapse | Cure | Total | Percentage cured | OR to fail | 95% CI |
|---|---|---|---|---|---|---|
| ≤0.25 | 3 | 84 | 87 | 96.6 | 1 | |
| 0.5 | 1 | 17 | 18 | 94.4 | 1.6 | 0.16–16.8 |
| 1 | 3 | 14 | 17 | 82.4 | 6.0 | 1.1–32.8 |
| 2 | 7 | 9 | 16 | 56.3 | 21.8 | 4.8–99.3 |
| 4 | 8 | 7 | 15 | 46.7 | 32.0 | 6.9–148.5 |
| 8 | 5 | 0 | 5 | 0.0 | undef | |
| >8 | 3 | 0 | 3 | 0.0 | undef | |
| Total | 30 | 131 | 161 | 81.4 |
GAT, gatifloxacin; undef, undefined.
The odds of failing increased significantly with increasing pretreatment gatifloxacin resistance level (Pearson's χ2 test: P < 0.001; Cramer's V: 0.654) (Table 3), with a drop in the proportion cured to ∼50% or below starting from an MIC of 2 mg/L.
A comparison between gyrA mutations with gatifloxacin MICs and treatment outcome showed that specific QRDR mutations were associated with different MIC ranges, and that the presence of QRDR mutations does not per se prevent cure with a high-dose gatifloxacin-based regimen (Table 4). Gatifloxacin-based treatment cured 94.1% of the 119 patients with WT isolates, whereas this dropped to 50.0% in the presence of any mutation in the QRDR (P < 0.001). Heterogeneous QRDR mutations did not significantly affect treatment outcome. The specific impact of gyrB mutations could not be assessed in our study, as only three gyrB mutations were not combined with a gyrA mutation. Among the gyrA mutations, 90Val, 94Gly and 94Ala were the most frequent, but their impact on cure differed. Any gyrA 94 mutation except 94Ala showed a cure proportion of only 30.8%, whereas all remaining gyrA mutations taken together (all non-94 mutants + 94Ala) resulted in successful high-dose gatifloxacin treatment in 65.6% [P = 0.008; OR = 4.3 (CI 1.4–13.0)] (Table 4).
Table 4.
Summary of gatifloxacin treatment outcome stratified by gyrA-gyrB sequence result; only one pre-MDR-treatment isolate per patient included
| gyrAB QRDRs | Mutation type | Cured | Failure/relapse |
Total | |
|---|---|---|---|---|---|
| n | % | ||||
| All strains | 143 | 38 | 21.0 | 181 | |
| WTa | 112 | 7 | 5.9 | 119 | |
| gyrB mutation only | 535Met | 0 | 1 | 100.0 | 1 |
| gyrB mutation only | 539Ala | 1 | 0 | 0.0 | 1 |
| gyrB mutation only | 539Ile | 0 | 1 | 100.0 | 1 |
| WT + gyrB mutation | WT + 539Asn | 1 | 0 | 0.0 | 1 |
| gyrA mutation only | 89Asn | 1 | 0 | 0.0 | 1 |
| gyrA mutation only | 89Gly | 0 | 1 | 100.0 | 1 |
| gyrA mutation only | 90Val | 9 | 8 | 47.1 | 17 |
| gyrA mutation only | 94Ala | 8 | 1 | 11.1 | 9 |
| gyrA mutation only | 94Asn | 1 | 0 | 0.0 | 1 |
| gyrA mutation only | 94Gly | 6 | 14 | 70.0 | 20 |
| gyrA mutation only | 94His | 1 | 0 | 0.0 | 1 |
| gyrA mutation only | 94Tyr | 0 | 3 | 100.0 | 3 |
| gyrA + gyrB mutation | 90Val + 539Ala | 1 | 0 | 0.0 | 1 |
| WT + gyrA mutation | WT + 89Asn | 0 | 1 | 100.0 | 1 |
| WT + gyrA mutation | WT + 90Val | 2 | 0 | 0.0 | 2 |
| WT + gyrA mutation | WT + 94Glyb | 0 | 1 | 100.0 | 1 |
| Any gyrAB QRDR mutant | 31 | 31 | 50.0 | 62 | |
| Any gyrA QRDR mutant | 29 | 29 | 50.0 | 58 | |
| Any gyrA 94 mutant except 94Ala | 8 | 18 | 69.2 | 26 | |
| Remaining gyrA mutants | 21 | 11 | 34.4 | 32 | |
Remaining gyrA mutants: all non-94 mutants + 94Ala mutants; OR in 2 × 2 table shown in italics: 4.2 (95% CI 1.3–15.1).
aIncluding six with −34T (cured), one with 614His (cured), one with del 683–684 (cured) and three with 551Arg (two cured).
bFailure patient also has 538Asp mutation in gyrB gene.
To further investigate the relevance of these findings within the evaluated MDR-TB regimen, we assessed profiles of resistance to the six accompanying drugs for all QRDR mutants. As specified in our inclusion criteria, all isolates were susceptible to kanamycin. Proportions of isolates resistant to high-dose isoniazid (1 mg/L), ethambutol, ethionamide, pyrazinamide and clofazimine did not differ significantly between cured and failed/relapsed patients (Table 5). Similarly, cure proportions did not differ among isolates resistant to one, two, three or four of the non-injectable accompanying drugs (Table 6).
Table 5.
Resistance to accompanying drugs for 62 QRDR mutants stratified by gatifloxacin-based treatment outcome; only one pre-MDR-treatment isolate per patient included
| Cured |
Failed/relapsed |
OR | 95% CI |
P | ||||||
|---|---|---|---|---|---|---|---|---|---|---|
| valid result | resistant |
valid result | resistant |
low | high | |||||
| n | % | n | % | |||||||
| INH (1 mg/L on LJ medium) | 31 | 30 | 96.8 | 27 | 27 | 100.0 | inf | NA | NA | 0.347 |
| EMB (2 mg/L on LJ medium) | 31 | 20 | 64.5 | 27 | 21 | 77.8 | 1.93 | 0.60 | 6.2 | 0.268 |
| ETH (10 mg/L on Middlebrook 7H11 medium) | 29 | 4 | 13.8 | 25 | 3 | 12.0 | 0.85 | 0.17 | 4.2 | 0.845 |
| Rv0678 sequencing | 30 | 5 | 16.7 | 16 | 1 | 6.3 | 0.33 | 0.04 | 3.1 | 0.318 |
| pncA sequencing | 31 | 20 | 64.5 | 19 | 15 | 78.9 | 2.06 | 0.55 | 7.8 | 0.280 |
INH, isoniazid; EMB, ethambutol; ETH, ethionamide; inf, infinite; NA, not applicable.
For pncA all mutations different from 65Ser were considered as resistant to pyrazinamide.
For Rv0678 all mutations were considered as potentially associated with clofazimine resistance.
Table 6.
Gatifloxacin-based treatment outcome for 62 patients with QRDR mutants stratified by resistance profile to accompanying drugs per isolate; only one pre-MDR-treatment isolate per patient included
| Resistance profile to accompanying drugs (KAN/INH/EMB/ETH/PZA/CFZ) | Number of isolates yielding a valid DST result for the accompanying drugs | Cured |
Failed |
||
|---|---|---|---|---|---|
| n | % | n | % | ||
| None or single drug | 9 | 3 | 33.3 | 6 | 66.7 |
| susceptible | 4 | 0 | 4 | ||
| ETH | 1 | 1 | 0 | ||
| INHa | 4 | 2 | 2 | ||
| Two drugs | 25 | 13 | 52.0 | 12 | 48.0 |
| INH/EMBb | 14 | 6 | 8 | ||
| INH/PZA | 9 | 5 | 4 | ||
| INH/CFZc | 2 | 2 | 0 | ||
| Subtotal for none, single drug or two drugs | 34 | 16 | 47.1 | 18 | 52.9 |
| Three drugs | 21 | 10 | 47.6 | 11 | 52.4 |
| INH/EMB/ETH | 18 | 9 | 9 | ||
| INH/EMB/PZAc | 2 | 0 | 2 | ||
| INH/PZA/CFZ | 1 | 1 | 0 | ||
| Four drugs | 7 | 5 | 71.4 | 2 | 28.6 |
| INH/EMB/ETH/PZA | 4 | 3 | 1 | ||
| INH/EMB/PZA/CFZ | 3 | 2 | 1 | ||
| Subtotal for three drugs or four drugs | 28 | 15 | 53.6 | 13 | 46.4 |
| Total | 62 | 31 | 50.0 | 31 | 50.0 |
INH, isoniazid at 1 mg/L; EMB, ethambutol; ETH, ethionamide; KAN, kanamycin; PZA, pyrazinamide; CFZ, clofazimine.
Clofazimine and pyrazinamide were tested genotypically by sequencing Rv0678 and pncA genes, respectively.
aOne failure patient lacked clofazimine data.
bTwo failure and two cured patients lacked pyrazinamide or clofazimine data.
cOne cured patient lacked ethionamide data.
Discussion
Based on our findings, an MIC >0.5 mg/L on LJ medium may be an appropriate epidemiological cut-off for gatifloxacin and probably also moxifloxacin resistance, e.g. for a drug resistance prevalence survey. Assuming similar MIC values of FQs on LJ and agar medium,3,38 the currently proposed 1 mg/L cut-off for gatifloxacin (on 7H10 agar)38 would falsely classify too many isolates with a mutation conferring drug resistance as susceptible, and should thus be abandoned.
Importantly, our data suggest that MICs above the epidemiological cut-off do not exclude high cure rates using a high-dose gatifloxacin-based standard treatment regimen. Using high-dose gatifloxacin regimens, cure rates considerably higher than those reported elsewhere are achieved even in the presence of low-level resistance (gatifloxacin MIC 1–2 mg/L).14 Because FQs are the key drugs in MDR-TB treatment, it would be a mistake not to use them with this level of resistance. A drop in the proportion cured to ∼50% or below starts from a gatifloxacin MIC of 2 mg/L and above. Given the ∼4-fold higher MIC values of ofloxacin compared with gatifloxacin and moxifloxacin as observed in our study and others,10,36 the gatifloxacin cut-offs of 0.5 and 2 mg/L correspond, respectively, to the currently widely applied 2 mg/L and the less applied 8 mg/L for ofloxacin. This suggests that for clinical purposes a strategy of testing only one FQ drug, but with two concentrations, is entirely justified. Our data show that for gatifloxacin, and probably also for moxifloxacin, this should be 0.5 and 2 mg/L on LJ medium. Ofloxacin could be tested at 2 and 8 mg/L as the epidemiological and clinical cut-offs, respectively, for regimens using more potent FQs at high dosage (gatifloxacin, possibly also moxifloxacin). Given the recent approval of bedaquiline and delamanid, patients with gatifloxacin/moxifloxacin MICs >2 mg/L might be more reliably cured by substituting one or the other of these drugs. Identifying low-level FQ resistance, on the other hand, may become important in the presence of resistance to injectable drugs; this could not be determined from this dataset.
The strongest risk factor for a bacteriologically unfavourable outcome with the Bangladesh regimen was high-level FQ resistance, particularly when compounded by initial pyrazinamide resistance.14 In our study population comprising only patients without baseline resistance to kanamycin, treatment outcome was not associated with resistance to companion drugs for the QRDR mutants, corroborating the impact of high-level gatifloxacin resistance. These proved to be mainly gyrA 94 mutants other than 94Ala.
We could not identify an obvious reason for treatment failure in patients infected with isolates showing WT QRDR and low MICs, which could be host and pathogen related. Patients were not coinfected with HIV and they did not have other overt comorbidities. The main cause of treatment failure—both for non-MDR-TB and MDR-TB—is non-adherence to treatment
The mechanism behind the differential impact of the different substitutes is not fully understood. Piton et al.39 found amino acid changes at position 94 to have a paradoxical effect on the resistance level, with smaller residues like glycine or alanine or bulky residues like tyrosine both increasing the resistance level. Using protein structure analysis, we did not identify conclusive patterns in differential GyrA protein stability for mutations that confer different levels of phenotypic resistance (data available upon request).
Also, we have no further explanation for the observed MIC ranges within isolates harbouring the same QRDR mutation, a phenomenon that has been observed for FQs in other studies15,40 and for other anti-TB drugs.41 It was not possible to determine whether the background genotype influences the MIC conferred by a specific mutation in this study.
Nevertheless, future molecular tests should thus not only allow the differentiation of mutants from WT strains or identification of the involved codon, but also permit differentiation between mutations in the same codon and the resulting amino acid change. Our study offers strong evidence for a better treatment outcome in the presence of 94Ala compared with 94Gly mutations. Other codon-94 mutants were found only rarely and some of those patients were cured, but their high MICs, comparable to those of 94Gly mutants, suggest that they should be classified with 94Gly until there is more robust clinical documentation of a difference. Even if some of the patients with 94Gly-mutant strains with an intermediate MIC were treated successfully, a regimen modification to include some of the new potent drugs might be most appropriate to reduce the risk of acquisition of resistance to companion drugs and thus treatment failure or death. Preliminary, unpublished results suggest that bedaquiline or linezolid can successfully replace high-dose fourth-generation FQs in the context of high-level FQ resistance.
Any mutation at codon 94 can be identified by the only commercial molecular test currently available (Genotype MTBDRsl; Hain Lifesciences) by the absence of the WT3 probe, whereas 94Gly mutations can be detected specifically as MUT3C, and 94Ala as MUT3A. The WHO did not endorse this test due to poor sensitivity, but our findings suggest that this may be useful after all. In any case, the WHO supports the use of this test to identify patients harbouring potentially high-level resistant codon-94 mutants in order to allow timely treatment adaptation.
The direct comparison between gatifloxacin and moxifloxacin MICs suggested that the former might be more active, confirming recent data obtained by Li et al.36 and earlier observations.42 However, the pharmacokinetics of moxifloxacin are more favourable than those of gatifloxacin, with a very similar ratio of plasma AUC to the MIC,43 suggesting equal in vivo potency at the same dosage provided the AUC difference is the same in TB lesions.
These data support the use of gatifloxacin as the most potent FQ, despite the dysglycaemia in Canadian elderly people (mean age 78 years),44 which was not confirmed by more recent data on the use of gatifloxacin in TB treatment, possibly because of a substantially different, and notably far younger, population, likely with a BMI less prone to pre-existing insulin resistance.14,45,46 The Bangladesh patients tolerated the high-dose gatifloxacin well. It remains to be seen whether similarly high bacteriological success is obtainable with moxifloxacin, which on its own is associated with potentially life-threatening adverse events.47
Our study confirms the rarity of gyrB mutations5,21,36 and does not allow firm conclusions about their effect on MDR-TB treatment when they are present. In addition, the phenotypically low-level resistant strains with WT QRDR require further investigation to discover heterogeneous populations that remain below the detection limit of classical target sequencing, and to elucidate alternative mechanisms conferring FQ resistance in case of true WT QRDR.
Heterogeneous FQ resistance seems relatively frequent among clinical isolates. Our sample size was too small to identify treatment outcome differences between heterogeneous and homogeneous populations, but their MIC levels were in the same range. Detection limits of different phenotypic and molecular assays and platforms to find these heteroresistant populations remain to be further investigated. The lack of data on levofloxacin is a limitation of this study, as this remains the FQ of choice in many recommended MDR-TB treatment regimens.
This study, based on a large dataset, provides an analysis of the relationship between phenotypic and genotypic characteristics of pretreatment isolates and the treatment outcome with a standardized MDR-TB treatment regimen. It suggests using 0.5 and 2 mg/L as breakpoints for detecting low- and high-level resistance to gatifloxacin/moxifloxacin on LJ medium, with high-level resistance and gyrA-94 mutations other than Ala as predictors of poor treatment outcome in pre-XDR patients.
Funding
Field work, consumables for laboratory analysis and a lab technician were generously financed by a grant from the Damien Foundation Belgium. N. C. was funded for this study by a Dehousse grant from the University of Antwerp (Belgium). B. C. d. J., C. J. M. and L. R. were funded by a European Research Council Starting grant INTERRUPTB (311725).
Transparency declarations
None to declare.
Acknowledgements
An abstract based on the presented data has been accepted for the Forty-sixth World Conference on Lung Health, Cape Town, South Africa (December 2015) (EP-161-05).
References
- 1.Cui Z, Wang J, Lu J et al. . Association of mutation patterns in gyrA/B genes and ofloxacin resistance levels in Mycobacterium tuberculosis isolates from east China in 2009. BMC Infect Dis 2011; 11: 78. [DOI] [PMC free article] [PubMed] [Google Scholar]
- 2.Rodriguez Díaz JC, López M, Ruiz M et al. . In vitro activity of new fluoroquinolones and linezolid against non-tuberculous mycobacteria. Int J Antimicrob Agents 2003; 21: 585–8. [DOI] [PubMed] [Google Scholar]
- 3.Sulochana S, Rahman F, Paramasivan CN. In vitro activity of fluoroquinolones against Mycobacterium tuberculosis. J Chemother 2005; 17: 169–73. [DOI] [PubMed] [Google Scholar]
- 4.Kocagöz T, Hackbarth CJ, Ünsal I et al. . Gyrase mutations in laboratory-selected, fluoroquinolone-resistant mutants of Mycobacterium tuberculosis H37Ra. Antimicrob Agents Chemother 1996; 40: 1768–74. [DOI] [PMC free article] [PubMed] [Google Scholar]
- 5.Huang TS, Kunin CM, Lee SSJ et al. . Trends in fluoroquinolone resistance of Mycobacterium tuberculosis complex in a Taiwanese medical centre: 1995–2003. J Antimicrob Chemother 2005; 56: 1058–62. [DOI] [PubMed] [Google Scholar]
- 6.Singh M, Chauhan DS, Gupta P et al. . In vitro effect of fluoroquinolones against Mycobacterium tuberculosis isolates from Agra & Kanpur region of north India. Indian J Med Res 2009; 129: 542–7. [PubMed] [Google Scholar]
- 7.Von Groll A, Martin A, Jureen P et al. . Fluoroquinolone resistance in Mycobacterium tuberculosis and mutations in gyrA and gyrB. Antimicrob Agents Chemother 2009; 53: 4498–500. [DOI] [PMC free article] [PubMed] [Google Scholar]
- 8.Falzon D, Gandhi N, Migliori GB et al. . Resistance to fluoroquinolones and second-line injectable drugs: impact on multidrug-resistant TB outcomes. Eur Respir J 2013; 42: 156–68. [DOI] [PMC free article] [PubMed] [Google Scholar]
- 9.El Sahly HM, Teeter LD, Jost KC Jr et al. . Incidence of moxifloxacin resistance in clinical Mycobacterium tuberculosis isolates in Houston, Texas. J Clin Microbiol 2011; 49: 2942–5. [DOI] [PMC free article] [PubMed] [Google Scholar]
- 10.Kam KM, Yip CW, Cheung TL et al. . Stepwise decrease in moxifloxacin susceptibility amongst clinical isolates of multidrug-resistant Mycobacterium tuberculosis: correlation with ofloxacin susceptibility. Microb Drug Resist 2006; 12: 7–11. [DOI] [PubMed] [Google Scholar]
- 11.Nosova EY, Bukatina AA, Isaeva YD et al. . Analysis of mutations in the gyrA and gyrB genes and their association with the resistance of Mycobacterium tuberculosis to levofloxacin, moxifloxacin and gatifloxacin. J Med Microbiol 2013; 62: 108–13. [DOI] [PubMed] [Google Scholar]
- 12.Yew WW, Chan CK, Leung CC et al. . Comparative roles of levofloxacin and ofloxacin in the treatment of multidrug-resistant tuberculosis. Preliminary results of a retrospective study from Hong Kong. Chest 2003; 124: 1476–81. [DOI] [PubMed] [Google Scholar]
- 13.Poissy J, Aubry A, Fernandez C et al. . Should moxifloxacin be used for the treatment of extensively drug-resistant tuberculosis? An answer from a murine model. Antimicrob Agents Chemother 2010; 54: 4765–71. [DOI] [PMC free article] [PubMed] [Google Scholar]
- 14.Aung KJM, Van Deun A, Declercq E et al. . Successful ‘9-month Bangladesh regimen’ for multidrug-resistant tuberculosis among over 500 consecutive patients. Int J Tuberc Lung Dis 2014; 18: 1180–7. [DOI] [PubMed] [Google Scholar]
- 15.Wang JY, Lee LN, Lai HC et al. . Fluoroquinolone resistance in Mycobacterium tuberculosis isolates: associated genetic mutations and relationship to antimicrobial exposure. J Antimicrob Chemother 2007; 59: 860–5. [DOI] [PubMed] [Google Scholar]
- 16.Guillemin I, Jarlier V, Cambau E. Correlation between quinolone susceptibility patterns and sequences in the A and B subunits of DNA gyrase in mycobacteria. Antimicrob Agents Chemother 1998; 42: 2084–8. [DOI] [PMC free article] [PubMed] [Google Scholar]
- 17.Matrat S, Aubry A, Mayer C et al. . Mutagenesis in the α3α4 GyrA helix and in the toprim domain of GyrB refines the contribution of Mycobacterium tuberculosis DNA gyrase to intrinsic resistance to quinolones. Antimicrob Agents Chemother 2008; 52: 2909–14. [DOI] [PMC free article] [PubMed] [Google Scholar]
- 18.Mokrousov I, Otten T, Manicheva O et al. . Molecular characterization of ofloxacin-resistant Mycobacterium tuberculosis strains from Russia. Antimicrob Agents Chemother 2008; 52: 2937–9. [DOI] [PMC free article] [PubMed] [Google Scholar]
- 19.An DD, Duyen NTH, Lan NTN et al. . Beijing genotype of Mycobacterium tuberculosis is significantly associated with high-level fluoroquinolone resistance in Vietnam. Antimicrob Agents Chemother 2009; 53: 4835–9. [DOI] [PMC free article] [PubMed] [Google Scholar]
- 20.Lau RWT, Ho PL, Kao RYT et al. . Molecular characterization of fluoroquinolone resistance in Mycobacterium tuberculosis: functional analysis of gyrA mutation at position 74. Antimicrob Agents Chemother 2011; 55: 608–14. [DOI] [PMC free article] [PubMed] [Google Scholar]
- 21.Avalos E, Catanzaro D, Catanzaro A et al. . Frequency and geographic distribution of gyrA and gyrB mutations associated with fluoroquinolone resistance in clinical Mycobacterium tuberculosis isolates: a systematic review. PLoS One 2015; 10: e0120470. [DOI] [PMC free article] [PubMed] [Google Scholar]
- 22.Malik S, Willby M, Sikes D et al. . New insights into fluoroquinolone resistance in Mycobacterium tuberculosis: functional genetic analysis of gyrA and gyrB mutations. PLoS One 2012; 7: e39754. [DOI] [PMC free article] [PubMed] [Google Scholar]
- 23.Devasia R, Blackman A, Eden S et al. . High proportion of fluoroquinolone-resistant Mycobacterium tuberculosis isolates with novel gyrase polymorphisms and a gyrA region associated with fluoroquinolone susceptibility. J Clin Microbiol 2012; 50: 1390–6. [DOI] [PMC free article] [PubMed] [Google Scholar]
- 24.Kim H, Nakajima C, Yokoyama K et al. . Impact of E540V amino acid substitution in GyrB of Mycobacterium tuberculosis on quinolone resistance. Antimicrob Agents Chemother 2011; 55: 3661–7. [DOI] [PMC free article] [PubMed] [Google Scholar]
- 25.Pantel A, Petrella S, Veziris N et al. . Extending the definition of the GyrB quinolone resistance-determining region in Mycobacterium tuberculosis DNA gyrase for assessing fluoroquinolone resistance in M. tuberculosis. Antimicrob Agents Chemother 2012; 56: 1990–6. [DOI] [PMC free article] [PubMed] [Google Scholar]
- 26.Pantel A, Petrella S, Matrat S et al. . DNA gyrase inhibition assays are necessary to demonstrate fluoroquinolone resistance secondary to gyrB mutations in Mycobacterium tuberculosis. Antimicrob Agents Chemother 2011; 55: 4524–9. [DOI] [PMC free article] [PubMed] [Google Scholar]
- 27.Lee J, Lee CH, Kim DK et al. . Retrospective comparison of levofloxacin and moxifloxacin on multidrug-resistant tuberculosis treatment outcomes. Korean J Intern Med 2011; 26: 153–9. [DOI] [PMC free article] [PubMed] [Google Scholar]
- 28.Ahmad Z, Tyagi S, Minkowski A et al. . Contribution of moxifloxacin or levofloxacin in second-line regimens with or without continuation of pyrazinamide in murine tuberculosis. Am J Respir Crit Care Med 2013; 188: 97–102. [DOI] [PMC free article] [PubMed] [Google Scholar]
- 29.Van Deun A, Aung KJM, Halim MA et al. . Short, highly effective, and inexpensive standardized treatment of multidrug-resistant tuberculosis. Am J Respir Crit Care Med 2010; 182: 684–92. [DOI] [PubMed] [Google Scholar]
- 30.WHO. Guidelines For The Programmatic Management Of Drug-Resistant Tuberculosis. Emergency Update 2008. WHO/HTM/TB/2008.402. 2008; 1–247. http://apps.who.int/iris/bitstream/10665/43965/1/9789241547581_eng.pdf.
- 31.WHO. Guidelines For Drug Susceptibility Testing For Second-Line Anti-Tuberculosis Drugs For DOTS-Plus. WHO/CDS/TB/2001.288. 2001; 1–13 http://apps.who.int/iris/bitstream/10665/83807/1/WHO_CDS_TB_2001.288_eng.pdf.
- 32.van Ingen J, Simons S, de Zwaan R et al. . Comparative study on genotypic and phenotypic second-line drug resistance testing of Mycobacterium tuberculosis complex isolates. J Clin Microbiol 2010; 48: 2749–53. [DOI] [PMC free article] [PubMed] [Google Scholar]
- 33.Hu Y, Mathema B, Wang W et al. . Population-based investigation of fluoroquinolones resistant tuberculosis in rural eastern China. Tuberculosis 2011; 91: 238–43. [DOI] [PubMed] [Google Scholar]
- 34.Ramirez-Busby SM, Valafar F. Systematic review of mutations in pyrazinamidase associated with pyrazinamide resistance in Mycobacterium tuberculosis clinical isolates. Antimicrob Agents Chemother 2015; 59: 5267–77. [DOI] [PMC free article] [PubMed] [Google Scholar]
- 35.Whitfield MG, Warren RM, Streicher EM et al. . Mycobacterium tuberculosis pncA polymorphisms that do not confer pyrazinamide resistance at a breakpoint concentration of 100 μg/ml in MGIT. J Clin Microbiol 2015; 53: 3633–5. [DOI] [PMC free article] [PubMed] [Google Scholar]
- 36.Li J, Gao X, Luo T et al. . Association of gyrA/B mutations and resistance levels to fluoroquinolones in clinical isolates of Mycobacterium tuberculosis. Emerg Microbes Infect 2014; 3: e19. [DOI] [PMC free article] [PubMed] [Google Scholar]
- 37.Mitchison DA. Standardisation of sensitivity tests. Int J Tuberc Lung Dis 1998; 2: 69. [PubMed] [Google Scholar]
- 38.WHO. Guidelines For Surveillance Of Drug Resistance In Tuberculosis. Fourth Edition. WHO/HTM/TB/2009.422. 2009; 1–83 http://apps.who.int/iris/bitstream/10665/44206/1/9789241598675_eng.pdf.
- 39.Piton J, Petrella S, Delarue M et al. . Structural insights into the quinolone resistance mechanism of Mycobacterium tuberculosis DNA gyrase. PLoS One 2010; 5: e12245. [DOI] [PMC free article] [PubMed] [Google Scholar]
- 40.Xu P, Li X, Zhao M et al. . Prevalence of fluoroquinolone resistance among tuberculosis patients in Shanghai, China. Antimicrob Agents Chemother 2009; 53: 3170–2. [DOI] [PMC free article] [PubMed] [Google Scholar]
- 41.Böttger EC. The ins and outs of Mycobacterium tuberculosis drug susceptibility testing. Clin Microbiol Infect 2011; 17: 1128–34. [DOI] [PubMed] [Google Scholar]
- 42.Rodríguez JP, Ruiz M, López G et al. . In vitro activity of moxifloxacin, levofloxacin, gatifloxacin and linezolid against Mycobacterium tuberculosis. Int J Antimicrob Agents 2003; 20: 464–7. [DOI] [PubMed] [Google Scholar]
- 43.Peloquin CA, Hadad DJ, Pereira Dutra Molino L et al. . Population pharmacokinetics of levofloxacin, gatifloxacin, and moxifloxacin in adults with pulmonary tuberculosis. Antimicrob Agents Chemother 2008; 52: 852–7. [DOI] [PMC free article] [PubMed] [Google Scholar]
- 44.Park-Wyllie LY, Juurlink DN, Kopp A et al. . Outpatient gatifloxacin therapy and dysglycemia in older adults. N Engl J Med 2006; 354: 1352–61. [DOI] [PubMed] [Google Scholar]
- 45.Jawahar MS, Banurekha VV, Paramasivan CN et al. . Randomized clinical trial of thrice-weekly 4-month moxifloxacin or gatifloxacin containing regimens in the treatment of new sputum positive pulmonary tuberculosis patients. PLoS One 2013; 8: e67030. [DOI] [PMC free article] [PubMed] [Google Scholar]
- 46.Merle CS, Fielding K, Sow OB et al. . A four-month gatifloxacin-containing regimen for treating tuberculosis. N Engl J Med 2014; 371: 1588–98. Erratum in: N Engl J Med 2015; 372: 1677. [DOI] [PubMed] [Google Scholar]
- 47.Esterly JS, McBride BF. Comparison of clinically significant cardiovascular events between three fluoroquinolones. Authors' response. Pharmacotherapy 2010; 30: 479e–80e. [Google Scholar]