

A mathematical model is used to analyze the impact of the indiscriminate kinetochore microtubule turnover and the back-to-back kinetochore geometry on chromosome biorientation during mitosis. The authors show that mammalian kinetochore operates in a near-optimal regime, whereby these two features provide a significant error-correction activity.
Abstract
Accuracy of chromosome segregation relies on the ill-understood ability of mitotic kinetochores to biorient, whereupon each sister kinetochore forms microtubule (MT) attachments to only one spindle pole. Because initial MT attachments result from chance encounters with the kinetochores, biorientation must rely on specific mechanisms to avoid and resolve improper attachments. Here we use mathematical modeling to critically analyze the error-correction potential of a simplified biorientation mechanism, which involves the back-to-back arrangement of sister kinetochores and the marked instability of kinetochore–MT attachments. We show that a typical mammalian kinetochore operates in a near-optimal regime, in which the back-to-back kinetochore geometry and the indiscriminate kinetochore–MT turnover provide strong error-correction activity. In human cells, this mechanism alone can potentially enable normal segregation of 45 out of 46 chromosomes during one mitotic division, corresponding to a mis-segregation rate in the range of 10−1–10−2 per chromosome. This theoretical upper limit for chromosome segregation accuracy predicted with the basic mechanism is close to the mis-segregation rate in some cancer cells; however, it cannot explain the relatively low chromosome loss in diploid human cells, consistent with their reliance on additional mechanisms.
INTRODUCTION
Human cells have 46 chromosomes, all of which are duplicated and then segregated equally every time the cell divides (Rieder and Salmon, 1998). If segregation fails, the daughter cells may acquire an inappropriate number of chromosomes (aneuploidy), a cause of severe malformations, developmental abnormalities, and diseases, including cancer (Cimini and Degrassi, 2005; Weaver and Cleveland, 2006; Bakhoum and Compton, 2012; Nicholson and Cimini, 2015). The exact chromosome mis-segregation rate in dividing cells in the healthy human organism is not known and appears to depend on cell type (Leach et al., 2004; Duncan et al., 2012). The immortalized human cell lines, which are derived from different tumors, are often aneuploid, with a 10−3–10−2 mis-segregation rate per chromosome (Supplemental Table S1). Noncancer cells exhibit a 10−4–10−3 mis-segregation rate (Supplemental Table S1, “normal cells”), which is still higher than the rate of chromosome loss in yeast cells: 10−5–10−4 (Hartwell and Smith, 1985; Hahnenberger et al., 1989). Identifying the molecular mechanisms that determine high accuracy of chromosome segregation and prevent chromosome loss is among the most important and challenging goals in cell biology.
One of the major causes of aneuploidy is improper regulation of the attachments between spindle microtubules (MTs) and chromosomal kinetochores, which host numerous MT-binding proteins and enzymes that control those attachments (Santaguida and Musacchio, 2009; Gascoigne and Cheeseman, 2011). The human kinetochore binds on average 18 MTs (kinetochore-associated microtubules [KMTs]), ranging from 13 to 24 (Wendell et al., 1993; McEwen et al., 2001). Many mitotic studies use rat kangaroo PtK1 cells, in which metaphase kinetochores bind on average 25 MTs, ranging from 11 to 35 MTs, but the occupancy increases up to 45 when MT dynamics is perturbed (McEwen et al., 1997). Early during mitosis in mammalian cells, relative positions between the kinetochores of different chromosomes and two poles of a growing spindle are highly variable (Compton, 2000; Silkworth et al., 2012). This inherent stochasticity of initial configurations promotes erroneous MT attachments when two sister kinetochores attach via the MTs to the same pole (syntelic attachment) or when one kinetochore becomes connected to MTs from both poles (merotelic attachment) (Figure 1A and Supplemental Figure S1A; Salmon et al., 2005; Cimini, 2008). Merotelic attachments are particularly dangerous because they frequently occur early in mitosis and, if left uncorrected before anaphase, may lead to lagging chromosomes (Cimini et al., 2002; Hauf et al., 2003; Bakhoum and Compton, 2012). Such lagging chromosomes constitute the most common pathway leading to aneuploidy in cancer cells (Thompson and Compton, 2008; Bakhoum et al., 2009, 2014; Bakhoum and Compton 2012). Healthy mitotic cells, however, can cope with the KMT attachment errors and efficiently replace them with amphitelic attachments, in which one sister kinetochore is connected to the MTs from only one pole, a configuration that results in chromosome biorientation and faithful segregation.
FIGURE 1:

Geometry of the mammalian kinetochore and biorientation outcomes. (A) Schematics of the model’s parts. The initial position of spindle poles is side by side, but then they separate to form a 10-μm-long spindle. (B) Electron microscope image of the cross-section of the mitotic kinetochore of a mouse chromosome (Ris and Witt, 1981). Reproduced with permission from Springer. Scale bar: 0.25 μm. (C) Diagram of a pair of sister kinetochores connected by a spring. In model calculations with no geometric constraints, the incoming MTs can penetrate all areas before binding to yellow “corona.” When geometric constraints are imposed, MTs bind only upon a direct contact with corona. See Supplemental Table S2 for other details. (D) Frequency histogram of the final orientation angles for the kinetochore pairs with stable (no KMT turnover) and unstable (KMT half-life τ1/2 = 3 min) MT attachments; N is the number of in silico experiments, each lasting 40 min. GC, results with geometric constraints. (E) Fraction of bioriented kinetochores as a function of the number of KMTs (per sister kinetochore) plotted on a logarithmic scale. Unless stated otherwise, the kinetochore pair is scored as bioriented when all KMTs are attached properly. Black line, analytical solution of Eq. 1; green, analytical solution of Eq. s14; red and blue symbols, results calculated with the model when the initial kinetochore position is random relative to the separating spindle poles. Bars are SEM. (F) Fraction of bioriented kinetochores plotted on a logarithmic scale for NMT = 18, as in human cells (Wendell et al., 1993; McEwen et al., 2001). Results with KMT turnover are for KMT half-life τ1/2 = 4 min, as in diploid human cells (Kabeche and Compton, 2013).
Several mechanisms have so far been identified that help the cells to minimize the formation of erroneous KMT attachments and to resolve these errors promptly. One of the most prominent mechanisms is based on the back-to-back arrangement of sister kinetochores, which can impose geometric constraints on MT binding to the kinetochore that faces away from the pole (Nicklas, 1997; Indjeian and Murray, 2007; Loncarek et al., 2007; Paul et al., 2009; Magidson et al., 2015). However, the stringency of this constraint and its relative role in achieving accurate chromosome segregation are not known. Importantly, it has been suggested that the primary role of kinetochore geometry is to limit the initial incorrect attachment of the KMTs (Nicklas, 1997). According to this view, if the initial chromosome position is favorable (i.e., midway between spindle poles with the sister kinetochores oriented along the spindle axis), the back-to-back kinetochore geometry is largely sufficient to promote successful biorientation. However, a less “lucky” sister kinetochore pair, which at the start of mitosis is positioned in such a way that the sister kinetochores are not shielded well from the improper KMTs, will require additional mechanisms to cope with the erroneous attachments.
The removal of improper MT attachments after they have formed is attributed largely to the continuous cycles of KMT attachment/detachment, which lead to the turnover of KMTs (Nicklas, 1997). In mammalian cells, the KMT attachments are most unstable during prometaphase. This instability is evident from the short half-life time of the attached KMTs (2–4 min), during which half of the KMTs detach (Zhai et al., 1995; Bakhoum et al., 2009; Kabeche and Compton, 2013). As chromosomes align at the metaphase plate, the rate of KMT turnover decreases, and the half-life of KMTs increases approximately twofold to reach 4–8 min (Zhai et al., 1995; Cimini et al., 2006; DeLuca et al., 2006; Kabeche and Compton, 2013). Because time from the nuclear envelope breakdown to anaphase in most mammalian cells is 20–40 min (Yang et al., 2008; Brito and Rieder, 2009), KMTs are replaced two to three times during mitosis. This dynamic exchange of KMTs has long been recognized as the essential error-correcting activity, consistent with the failure of cells to divide properly in the presence of low concentration of drugs that perturb KMT dynamics (Jordan and Kamath, 2007). Importantly, the dividing cells appear to benefit from the KMT turnover via two different mechanisms. In one, the rate of KMT turnover is thought to be regulated differently for the correct versus incorrect KMT attachments (Nicklas, 1997). Such discriminate, targeted regulation may operate via the centromere-localized Aurora B kinase, which stabilizes the correct attachments and/or destabilizes the wrong KMTs, thereby promoting biorientation (Lampson and Cheeseman, 2011). However, a global, indiscriminate regulation of KMT stability may have a significant error-correcting activity on its own (Bakhoum and Compton, 2012; Godek et al., 2015). Indeed, inappropriate KMT stabilization in normal cells is sufficient for creating chromosome segregation errors, while KMT destabilization reduces the chromosome mis-segregation rate in cancer cell lines with overly stable KMTs (Bakhoum et al., 2009; Kabeche and Compton, 2013).
The benefits of the indiscriminate instability of all KMTs, merotelic and amphitelic, for error correction can be understood intuitively, assuming that the improper KMTs are acquired during early stages of mitosis and that their subsequent release is the rate-limiting step for successful biorientation (Nicklas and Ward, 1994). In this view, after the kinetochore becomes oriented favorably (as in metaphase), all preformed KMTs can be released due to attachment instability, while stringent geometric constraints favor their replacement only with the proper, amphitelic KMTs. Thus a faster rate of KMT turnover should increase the rate of error correction and promote higher fidelity of chromosome segregation; such correlation is indeed observed in different cell lines (Bakhoum et al., 2009). However, the destabilization of KMTs through a fast turnover may have detrimental effects. For example, when KMTs are too unstable, the kinetochores may fail to establish the sufficient number of KMT connections, leading to a thinner kinetochore fiber (K-fiber) and triggering the checkpoint-dependent block of anaphase initiation (Bakhoum and Compton, 2012). This suggests the presence of competing restrictions on the rate of KMT turnover to balance the error correction and the number of KMTs, but theoretical analysis of such effects has been lacking. Here we use a mathematical model of kinetochore–MT interactions to systematically and quantitatively examine the roles of geometric constraints and KMT turnover in error correction at the mammalian kinetochore, seeking to determine how these activities are held in balance. Our work helps to define complex interrelationships between the kinetochore geometry and indiscriminate KMT turnover and to quantify their relative impact on the rate and accuracy of chromosome biorientation.
MATHEMATICAL MODEL
General framework and model assumptions
The model contains a highly simplified MT-based spindle confined to a 15 × 7 μm area, which roughly corresponds to the size of a mammalian cell (Figure 1A). Each pole nucleates 750 MTs, resulting in a spindle with a total of 1500 MTs, similar to spindles in HeLa cells (McIntosh and Landis, 1971). MTs can grow from two poles in random directions; the poles are initially positioned close to each other but then move apart. The plus ends of MTs are dynamically unstable, with parameters characteristic for a mitotic cell, and for simplicity, the MTs do not bundle or interact with each other. Unless specified otherwise, initially a single kinetochore pair is positioned randomly relative to the unseparated spindle poles; the MT-free kinetochore pair diffuses, changing its orientation relative to spindle poles. A pole-originated MT binds to a kinetochore if its tip is found anywhere within the kinetochore “corona” (see section Kinetochore-MT interface). Importantly, the attachment probability is the same for all MTs, regardless of whether they are correct or not. On attachment, the KMT begins to exert a pulling force toward the pole of its origin. During any stage of simulation, the KMT can detach from the kinetochore with the detachment rate kdet, leading to the turnover of KMTs, characterized by the half-life of KMT attachments (τ1/2). Importantly, the detachment probability is the same for all types of KMTs, correct or incorrect. Translational and rotational motions of the sister kinetochore pair that is free of MTs or as it moves under MT forces are described with Langevin equations of motion in viscous medium. Numerical calculations were carried out with a discrete time scheme, such that equations were solved at every time step, and the values of model parameters for the next time step were adjusted accordingly. For simplicity, all calculations were carried out using a two-dimensional (2D) representation of this model, but the obtained results were transformed to reflect the three-dimensional (3D) arrangement (Supplemental Figure S1). These and other details are provided in Supplement 1 and Supplemental Table S2.
Kinetochore–MT interface
The kinetochore is modeled based on the known structural features of mammalian sister chromatids (Figure 1B). In 3D, the primary chromosomal constriction is represented by two half-cylinders (Supplemental Video 1). To represent the interkinetochore tension, these structures are linked with a spring that can stretch in response to MT pulling forces. As a result, the distance between the kinetochores (Lk) varies from 0.8 μm (with no bound KMTs, such as in prophase) to 1.6 μm (fully stretched centromeres of bioriented sister kinetochores), similar to the interkinetochore stretching measured in mitotic cells (Loncarek et al., 2007; Wan et al., 2009). The MT-interacting kinetochore corona was modeled as a 100-nm-thick layer (Supplemental Video 1, semitransparent beige layer) localized on the outer surface of a half-cylinder (Cheeseman and Desai, 2008). The 2D cross-section of a kinetochore pair is schematized in Figure 1C. MT tips can attach anywhere within corona, but the maximum number of KMT attachments is limited by the kinetochore occupancy (parameter Nmax).
RESULTS
Geometric constraints are essential for accurate chromosome segregation
To establish a quantitative baseline for our study, we first analyzed the model’s behavior in the absence of any geometric restrictions on MT binding. In our stochastic in silico experiment, as in human cells, the kinetochore pair initially is oriented randomly relative to the spindle poles, as illustrated with Supplemental Video 2. Although the sister kinetochores are shown in the back-to-back orientation, the kinetochores in this simulation can bind MTs from both poles equally well. Initially, the unattached sister kinetochores exhibit thermal diffusion, and the pole-directed motion is initiated only after attachment of a first KMT. If the MT attachments are permanent (i.e., no KMT turnover), the number of KMTs increases gradually until the kinetochore becomes saturated and the number of KMTs reaches Nmax. The kinetochore pair then settles between two poles, while oriented at a certain angle with spindle axis. The predicted distribution of these final orientation angles is very broad (Figure 1, C and D), indicating a failure of the kinetochore pair with no geometric constraints to orient itself properly. From 111 simulations, none of the chromosomes achieved proper biorientation, implying that the probability (pbi) for the “transparent” kinetochore pair to form only proper KMT attachments is very low. To estimate pbi more accurately, we derived a simple analytical relationship between pbi and the final number of kinetochore-bound MTs, NMT (Supplement 2):
|
|
Thus the probability to biorient is an exponential function of NMT (Figure 1E, black curve). Because a lack of KMT turnover results in the kinetochore becoming fully saturated with KMTs, such that NMT = Nmax, the fraction of human kinetochores that can biorient fortuitously is predicted to be only 10−14 (Nmax = 24; Figure 1F). This means that, if the kinetochore attaches to correct and incorrect MTs with equal probability and there are no geometric constraints, only one chromosome in 1012 dividing human cells would segregate normally. For comparison, in human RPE-1 cells, chromosome mis-segregation is observed in one of 102 dividing cells (Thompson and Compton, 2008).
Strikingly, this outcome remains almost unchanged when KMT attachments are dynamic, that is, in the presence of KMT turnover, as seen from the corresponding analytical solution (Eq. s14 in Supplement 2). The analytical approach we developed for dynamic kinetochore–MT interactions provides accurate assessment of KMT binding stochasticity, as evidenced by a good match for the experimentally determined steady-state distribution of KMTs in different cells (Supplemental Figure S3C) as well as previous theoretical study (Zaytsev et al., 2014). According to Eq. s14, KMT turnover improves biorientation by five orders of magnitude, but it still remains very low: only one chromosome in 107 human cells is predicted to biorient properly (Figure 1, E and F). We conclude that, if the kinetochore geometry imposes no constraints on MT binding, the dynamic nature of KMT attachments brings little benefit. Without other auxiliary mechanisms, the indiscriminate turnover of KMTs is unable to provide the physiologically relevant degree of biorientation.
When KMT attachments are permanent but restricted by the back-to-back kinetochore geometry, the chances to biorient depend strongly on the initial kinetochore position
Next we examined a more realistic model, in which the back-to-back orientation of the sister kinetochore pair imposes geometric restrictions on the KMT attachments (Figure 1, B and C). Here the tip of growing MTs can bind to corona, but MT that touches chromatin is assumed to depolymerize, prohibiting it from reaching corona of the sister kinetochore that is not immediately accessible. To determine advantages provided by such geometry alone, we initially omitted the KMT turnover. First, we calculated the probability of biorientation for a kinetochore pair that was placed in a favorable configuration—midway between two fully separated poles and with each sister kinetochore facing directly toward one of the poles. In our model, and in a typical mammalian cell, such a sister kinetochore is shielded only partially from the erroneous MTs, which can still attach to this kinetochore’s periphery (Figure 1, A–C, and Supplemental Video 1). Thermal chromosome motions and the motions introduced by the pulling KMTs change chromosome orientation frequently, further promoting formation of merotelic attachments. In 50 simulations with no KMT turnover, the favorably positioned kinetochores acquired on average 1.4 merotelic MTs per kinetochore. Only 22 kinetochore pairs, or 44%, reached biorientation for NMT = 18 (Figure 1F); the results were only slightly worse with NMT = 25 (1.5 merotelic KMTs and 40% biorientation).
The chances to biorient were much lower if the kinetochore pair was positioned randomly, increasing the exposure to wrong MT ends at early stages of mitosis. Capturing the first MT induced the simulated kinetochore to rotate, as seen in live cells (Alexander and Rieder, 1990). Such motion can promote biorientation if the kinetochore completes its rotation before capturing a merotelic MT, as seen in the model by Paul et al. (2009). However, in live cells (Cimini et al., 2003) and in our model, the kinetochores frequently capture the inappropriate MTs before acquiring the favorable position (Supplemental Video 3). This often resulted in the simulated kinetochore orienting perpendicularly to the spindle axis. The newly attached MTs can then flip the kinetochore over, so the kinetochore pairs end up oriented coaxially (Figure 1D, red columns). However, ∼6% of kinetochores (i.e., three kinetochore pairs in a human cell) become trapped in the spindle-perpendicular orientation (Supplemental Video 4). This configuration is stable if approximately the same number of KMTs are attached to each sister kinetochore, pulling in opposite directions (Supplemental Figure S2C). On average, the resulting number of merotelic KMTs per kinetochore that started from a random position is 4.2 ± 0.2 (mean ± SEM, 50 simulations for NMT = 18). This is significantly worse than what is seen for the kinetochores with the favorable initial position, consistent with the results of a prior theoretical study examining impact of initial spindle configuration (Silkworth et al., 2012). Importantly, with random chromosome positioning, the probability to attach correctly is so small that none of our 50 simulations have led to biorientation, and even the kinetochores that orient along the spindle axis have many merotelic KMTs (Supplemental Video 3).
To estimate the probability to biorient for the randomly positioned kinetochores in the absence of KMT turnover, we derived Eq. 2 (Supplement 2). Using the ratio of the number of merotelic KMTs to the total number of KMTs, η, the probability that all KMTs attach correctly to both sister kinetochores can be calculated as follows:
|
|
For NMT = 18, η = (4.2 ± 0.2)/18 = 0.23 ± 0.01, so the probability of biorientation from a random kinetochore position is ∼10−4 (Figure 1F), corresponding to a proper segregation of one chromosome in ∼103 human cells. Similar calculations for PtK1 cells give η = (7 ± 1)/25 = 0.26 ± 0.03 and a biorientation probability of 10−6, corresponding to a proper segregation of one chromosome in ∼105 cells. These results demonstrate that the restrictive kinetochore geometry on its own cannot cope effectively with the large stochasticity of initial conditions, a hallmark feature of mammalian mitosis.
KMT turnover renders biorientation insensitive to the initial kinetochore orientation, but it does not improve biorientation of the favorably positioned kinetochores
The “memory” of initial kinetochore position vanishes when the KMT turnover is added to geometrically restricted kinetochores. A time course of the computational experiment, in which multiple kinetochore pairs were analyzed, illustrates the evolution of different KMT configurations (Figure 2A). At the beginning of each such simulation, the poles are unseparated, and the kinetochore pair has a random location and orientation. Initially, all kinetochores are free from the MTs, but they quickly become monotelic and then acquire numerous wrong connections to the separating spindle poles, so the model exhibits different types of KMT attachments seen during the first minutes of spindle separation in cells (Supplemental Figure S3D; Silkworth et al., 2012). Consistent with observations in cells (Roos, 1973; Cimini et al., 2003; Hauf et al., 2003), the syntelic configurations in these in silico experiments are rare, and the merotelic attachments occur more frequently (Figure 2A). When kinetochores assume position midway between two poles, they always orient coaxially with the spindle, as in normal mitosis, because the incorrect spindle-perpendicular orientation is destabilized in the presence of KMT turnover (Figure 1D, blue columns). Proper orientation is important because it enables a positive feedback, which helps to cope with the attachment errors: with indiscriminate turnover, all KMTs, correct or not, detach stochastically, but the kinetochore geometry favors attachment specifically of the correct MTs, as expected. As a result, the abundant merotelic KMTs are gradually replaced with the correct ones (Figure 2B), just as seen in cells (Cimini et al., 2003) and with a previous biorientation model that used the discriminatory attachment and detachment kinetics (Silkworth et al., 2012). The indiscriminate feedback mechanism of eliminating the improper attachments is powerful enough to cope with the most unfavorable situation, that is, when the poles separate after the kinetochores have already been saturated with randomly arranged KMTs (Figure 2C and Supplemental Video 5). In cells, this condition is achieved by treatment with monastrol, a drug that inhibits separation of spindle poles and locks kinetochores in erroneous configurations (Lampson et al., 2004). As in cells that were washed to remove monastrol, when spindle poles begin to separate in our model, the number of improperly attached KMTs drops significantly (Figure 2D). These data clearly show that the indiscriminate KMT turnover can provide strong error-correcting activity for the randomly positioned kinetochores with geometric constraints.
FIGURE 2:

Impact of the initial system configuration and KMT turnover rate. (A) KMT configurations for the geometrically constrained kinetochores. Data here and in B and E are average of 50 in silico experiments; error bars are SEMs. Two minutes after the beginning of mitosis in silico almost all kinetochores are merotelic, i.e., they have at least one KMT from a wrong pole. (B) Average number of merotelic KMTs per sister kinetochore as a function of time for different KMT half-lives in the presence of geometric constraints. When the kinetochore’s initial position is random, many merotelic KMTs attach during the first few minutes, but then their number peaks and declines gradually if KMT turnover is present. For comparison, the kinetochore pair oriented along spindle axis and positioned midway between two separated poles (favorable configuration) has on average 1.5 merotelic KMTs per sister kinetochore at all times (dashed horizontal line). (C) Screenshot from Supplemental Video 5, in which the initial configuration mimics monopolar spindles in monastrol-treated cells. This screenshot shows separating spindle poles and merotelic KMTs. Red and blue colors depict KMTs from different poles. (D) Quantification for simulations that start from monastrol-induced configuration. Same colors as on B; number of simulations is 10. Note the larger peak amplitudes. (E) Kinetics of biorientation for kinetochores that were positioned randomly in a nascent spindle (green and blue) or for the favorably positioned kinetochore in a fully formed spindle (red). Solid lines are exponential fits. (F) The steady-state fraction of bioriented kinetochore pairs for different KMT half-lives (50 simulations for each point; error bars are SEMs). Dashed line shows the model solution for favorably positioned kinetochores with no KMT turnover; horizontal gray bar shows SD range for the steady-state solutions.
We then compared the quantitative outcomes for biorientation of the kinetochore pairs positioned randomly with those in favorable configuration. When KMT turnover is present, both starting configurations lead to a 0.46 fraction of bioriented kinetochores (Figure 1F). Thus instability of KMT interactions with the back-to-back sister kinetochores renders biorientation insensitive to the initial kinetochore orientation. Together these results imply that a combination of the restrictive kinetochore geometry and indiscriminate KMT turnover could in principle enable proper segregation of 23 chromosomes in one dividing human cell, a dramatic improvement relative to the random kinetochores with stable KMT attachments. Interestingly, a faster rate of the KMT turnover brings no improvement to this result (Figure 2E). Indeed, we have varied the rate of KMT turnover, but the steady-state fraction of bioriented chromosomes did not change significantly (Figure 2F), demonstrating that when a mitotic system is given sufficient time, the final KMT attachment accuracy is defined by the system’s geometry and not by the rate of KMT turnover.
Stringent geometric constraints inhibit K-fiber formation
The above results suggest that more restrictive geometric constraints could in principle enable the cell to achieve a higher accuracy of biorientation. A typical mammalian kinetochore, however, has relatively relaxed geometric constraints (Supplemental Video 1). They do not prevent merotelic attachments completely, suggesting that very stringent geometry might have some drawbacks. To examine the impact of kinetochore geometry and mechanics, we varied different model parameters. Changes up to fourfold in the rigidity of the interkinetochore spring had little impact on the steady-state biorientation outcome (Supplemental Figure S3E). Varying the thickness of the kinetochore corona from 60 to 140 nm led to a moderate decrease in the fraction of bioriented kinetochores (Supplemental Figure S3F). A stronger effect on attachment accuracy was seen when the corona area was decreased. We have quantified this effect by introducing geometry parameter β (Figure 3A). When β = 0, the corona occupies the entire outer surface of a primary constriction, so the constraints are minimal; when β = 1, the corona is represented by a geometric point. Thus, for large values of β, the congressed and properly oriented kinetochore is almost entirely protected from the improper MT contacts, which nonetheless are still possible due to thermal kinetochore motions. We estimate that, for a kinetochore geometry shown in Figure 1B, β = 0.16–0.18; this range corresponds to the 6–7.5% probability that the newly attached KMT is merotelic. Figure 3B shows that increasing β from 0 to 0.5 improves the chances to biorient by approximately twofold. Interestingly, with a further increase in the stringency of geometric constraints, the chances to biorient begin to decline (Figure 3B). This decline takes place because the time to establish a first MT contact increases significantly when corona area is small (Figure 3C). Even more importantly, the number of KMTs in the K-fiber at steady state declines strongly with increasing β (Figure 3D). When β > 0.5, the number of bound KMTs is so low that some chromosomes remain mono-oriented, even though the kinetochore occupancy and the simulation time are not limited (Figure 3B, open circles). Because MTs attach with equal probability in our model regardless of whether they are merotelic or amphitelic, stringent geometry inhibits binding efficiency of all KMTs. We conclude that strong geometric constraints are not beneficial for mitotic cells because they prevent the establishment and maintenance of large K-fibers.
FIGURE 3:

Effect of the stringency of geometric constraints. (A) Schematics illustrating how the kinetochore radius (Lc) was varied to adjust corona’s size (in yellow), thereby achieving different stringency of geometric constraints (parameter β). See Figure 1C for more details. (B) Fraction of kinetochore pairs with different KMT configurations as a function of β. A decrease in bioriented kinetochores for β > 0.5 is due to the increase in mono-oriented kinetochore pairs, for which all KMT attachments are to the same pole. KMT half-life τ1/2 = 6 min here and in C and D. Number of simulations is 50 for each β. Here and in other panels, values are mean ± SEM. (C) Mean chromosome capture time (time from the beginning of the simulation to the binding of first KMT) for different geometric constraints. Number of calculations for each point is 200. (D) Steady-state number of KMTs as a function of geometric constraints. Number of calculations for each point is 50.
Slower KMT turnover boosts the K-fiber size and improves its “quality” but significantly delays biorientation
Data in the preceding paragraph suggest that the inability to reach a normal K-fiber size may be the main factor preventing cells from using very stringent geometric constraints. A reasonable strategy to compensate for this undesired consequence of the restrictive geometry is to increase the stability of KMT attachments. Indeed, when KMTs detach less frequently (longer KMT half-life and therefore slower turnover), the steady-state number of MTs in the K-fiber increases, and the K-fiber size becomes limited only by the maximal kinetochore occupancy (Figure 4A). Interestingly, the final size of the K-fiber does not depend on initial mitotic configuration: in simulations that started from monastrol-induced configuration, the steady-state number of KMTs was the same as from random configurations (Figure 4B).
FIGURE 4:

Effect of the KMT turnover rate on the kinetics of K-fiber formation and its final size and composition. (A) Steady-state number of KMTs (K-fiber size, left axis) increases when the attachments are more stable, gradually reaching the maximal kinetochore occupancy. The half-time for the formation of these K-fibers is shown with the right y-axis. When the KMT half-life is 4–6 min, the K-fiber with 18–25 MTs is acquired in ∼15 min, similar to dividing mammalian cells (McEwen et al., 1997). When τ1/2 = 1–3 min, the K-fiber reaches a plateau much faster (under 5 min), but it contains on average only 5–10 KMTs. (B) Example kinetics of K-fiber formation. Purple curve shows results for τ1/2 = 6 min starting from monastrol-induced configuration; all other curves are for regular spindles with randomly positioned kinetochores. (C) Distribution of the M/A ratios (number of merotelic to amphitelic KMTs at each kinetochore) for indicated KMT half-life. Each distribution is based on 50 simulations each lasting 3 h. (D) M/A ratio and the steady-state number of merotelic KMTs for chromosomes with different K-fiber size. The final number of merotelic KMTs does not depend on the K-fiber size, but the M/A ratio decreases with increasing total number of KMTs in the K-fiber. (E) Half-time for biorientation increases exponentially with increasing KMT half-life (left axis; line is exponential fitting). The maximum number of merotelic KMTs found at kinetochore during the time course for KMT attachment also increases with increasing KMT stability (right axis); these data represent peak values from the kinetic curves as shown in Figure 2B. Number of simulations for each KMT half-life is 50.
In addition to increasing the size of the K-fiber, a slower turnover also improves its “quality,” as judged by the ratio of the number of merotelic to amphitelic KMTs (M/A; Supplemental Figure S4D). As we have shown earlier in this study, for all KMT turnover rates (and therefore K-fiber sizes), about half of the kinetochore pairs can achieve biorientation (Figure 2F), so for these amphitelic chromosomes, M/A = 0. However, the remaining half of the chromosomes have on average 1.4–1.7 merotelic KMTs. The M/A ratios for these chromosomes are distributed broadly (Figure 4C). Interestingly, large K-fibers tend to have on average a lower M/A ratio, while in cells with thinner K-fibers, some kinetochores exhibit a very large M/A ratio (Figure 4D). This effect results directly from the cross-talk between the KMT dynamics and kinetochore geometry, which is characteristic of the error-correction mechanism that combines these two properties. Indeed, in a thin K-fiber, the detachment of any one of the KMTs, or the attachment of a new one, has a noticeable effect on the balance of forces and torques at this kinetochore pair. The spindle–axial orientation of the kinetochores with thin K-fibers is less stable, which promotes encounters with wrong MT ends, further destabilizing the orientation. Conversely, more robust K-fibers mechanically stabilize the spindle–axial kinetochore orientation, engaging a positive feedback for the error-correction mechanism. Consistent with this view, we find that the probability that the newly attached KMT is merotelic decreases with an increasing number of KMTs (Supplemental Figure S4A). A similar mechanism leads to the increase in the probability of acquiring merotelic KMTs by the kinetochores that already have merotelic KMTs, explaining why multiple merotelic attachments (high M/A ratio) slow the rate of correction (Cimini et al., 2003, 2006). Thus, increasing stability of KMT attachments has pronounced beneficial effects: it allows formation of robust K-fibers and improves the M/A ratio.
However, very stable KMT attachments also have negative consequences. First, we noticed that high stability is associated with the increase in the maximum number of merotelic KMTs found during the simulation time courses (Figure 2B). The number of merotelic KMTs peaks and then declines toward the steady-state values that do not depend on the rate of KMT turnover (Figure 4D). However, the peak values increase with increasing KMT stability. For example, there are almost threefold more merotelic KMTs when the KMT half-life increases from 2 to 16 min (Figure 4E). Although this effect is transient and has no consequences for the steady-state solution, it becomes important later in this paper when we consider model predictions in cases in which the duration of mitosis is limited. Second, the rate of KMT turnover significantly affects the kinetics with which cells can achieve the best possible (for a given kinetochore geometry) biorientation: when KMTs are more stable, the wrong KMTs are replaced more slowly, and the steady-state level for biorientation takes longer to achieve (Figure 4E). For example, for KMT half-lives of 6 and 16 min, the K-fibers reach their steady-state sizes similarly quickly (15–20 min), but the corresponding biorientation times differ more than fourfold. This dependency is highly nonlinear, so error correction with slow KMT turnover requires a significantly longer cell division time. Thus there are competing constraints on the rate of KMT turnover, and the negative effects we found from a slow KMT turnover may prevent cells from using more stable attachments.
Limiting time of mitosis renders the biorientation sensitive to initial chromosome configuration and to slow rate of KMT turnover
Our above analysis demonstrates that when the error-correction mechanism based on the kinetochore geometry and KMT turnover is given enough time to reach the steady-state levels for all system parameters, the final biorientation outcome is not dependent on the initial system configuration (Figures 1F and 2F). This contrasts experimental results with cell lines, where monastrol treatment has been shown to cause a significant increase in lagging chromosomes in anaphase and a higher chromosome mis-segregation rate (Thompson and Compton, 2008, 2011; Bakhoum and Compton, 2012; Kabeche and Compton, 2013; Silkworth et al., 2012). Interestingly, when the duration of mitosis is limited in our model and the biorientation outcome is evaluated before the steady state is reached, model predictions are more in tune with the results of experimental perturbations. Indeed, Figure 5A shows that the calculated fraction of biorientated chromosomes for τ1/2 = 4 min in cells starting from monastrol configuration drops from the steady-state value of 0.50 down to 0.24 and 0.36 (at 20 and 40 min from the beginning of the simulation, respectively). However, since time to achieve the steady state depends on the KMT turnover rate, this detrimental effect is stronger in cells with more stable KMTs (compare with monastrol configuration for τ1/2 = 16 min, Figure 5A). Similar interplay between the KMT stability and duration of mitosis is seen when simulations start from a normal configuration. When KMT turnover is slow (τ1/2 = 16 min, Figure 5A), only 14% of kinetochore pairs become bioriented during 20 min, and waiting an additional 20 min improves this result approximately twofold. However, when the KMT turnover is fast (τ1/2 = 4 min), waiting for 20 more min improves the outcome only slightly because the steady state for KMT configurations has nearly been reached during the first 20 min (Figure 5A, horizontal gray bar).
FIGURE 5:

Comparison between model and experiment. (A) Fraction of bioriented chromosomes calculated at 20 and 40 min from the beginning of simulations; most mammalian cells divide within this time range. Values are averages over 2-min intervals at indicated times; bars are SDs; horizontal gray bar shows SD range for the steady-state solutions (from Figure 2F), so variations within this bar are not statistically significant. Calculations for “+ monastrol” started from initial configuration similar to Figure 2C. (B) Percent of anaphases with lagging chromosomes in different human cell lines vs. KMT half-life at metaphase (data from Bakhoum et al., 2009; Kabeche and Compton, 2013). Duration of mitosis in these cells varies from 20 to 40 min (Brito and Rieder, 2009). Solid line is a linear fit to all points. Open circles are data for RPE1 cells (τ1/2 = 4 min) and RPE1 + MCAK RNAi (τ1/2 = 9 min) cells; open triangles are data for U2OS cells from two cited studies. (C) Percent of kinetochores with merotelic KMTs calculated at 20 and 40 min from the beginning of simulations. Our model does not describe anaphase events, but these data correspond to the percent of merotelic kinetochores that would have been observed at anaphase onset that started at these times. Kinetochore was called merotelic if, by the end of calculation, it had at least one merotelic KMT. Results for the steady state were recorded after 3-h simulations; horizontal gray bar shows the SD range for steady-state solutions. Solid lines are exponential fits for the values that exceed this range. (D) Lagging rate per chromosome (percent of divisions with lagging chromosomes normalized to the number of chromosomes in cell) was calculated under assumption that only the kinetochores with M/A > 0.5 become lagging. Lagging rate per chromosome is used to enable the comparison of biorientation accuracy in cells with different ploidy. (E) Lagging rate per chromosome was calculated under assumption that only the kinetochores with M > 4 become lagging.
Thus, when the simulation time course is interrupted to mimic the start of anaphase, the number of biorientated chromosomes becomes sensitive to both the initial spindle configuration and KMT turnover rate. Our model therefore suggests that in cell lines in which monastrol is found to have a strong adverse effect on chromosome segregation, anaphase initiation is triggered before the basic biorientation mechanism has reached its maximum effect. Normal cell lines, which tend to have faster KMT turnover (Bakhoum et al., 2009), are predicted to respond to perturbations in the initial spindle configurations less strongly because these cells receive the error-correcting benefits from the indiscriminate KMT turnover much sooner.
Chromosome lagging in anaphase is likely to be affected by the number of merotelic KMTs, but not by the ratio of merotelic to amphitelic KMTs
Next we applied our model to seek new insights into the mechanisms that cause chromosome lagging during anaphase. In cancer cell lines, the frequency of anaphases with lagging chromosomes correlates positively with the half-life of metaphase KMTs, such that more chromosomes are lagging in cells in which the KMTs turn over slowly (Bakhoum et al., 2009; Figure 5B). Because lagging chromosomes are likely to result from merotelic KMTs (Cimini et al., 2001), we calculated how the percent of kinetochores with merotelic KMTs depends on KMT stability. If calculations are carried out until the steady state is reached, the number of kinetochores with merotelic KMTs does not depend on the turnover rate (Figure 2F). When cell division time is shorter (20–40 min), the frequency of kinetochores with merotelic KMTs in the model tends to increase with increased KMT stability (Figure 5C). This increase is brought about by the slower rate of resolving erroneous KMTs (Figure 4E, black circles), and also by the larger number of merotelic KMTs acquired during early mitotic stages (Figure 4E, white circles).
To compare theoretical data in Figure 5C with the experimental dependency for lagging chromosomes (Figure 5B), we considered two specific hypotheses about how the merotelic KMTs can cause lagging. During anaphase, the merotelic KMTs are thought to engage in a tug-of-war with the opposing, amphitelic KMTs (Cimini et al., 2003, 2004), but what determines whether a merotelic kinetochore produces an anaphase lagging chromosome is not well understood. According to one hypothesis, lagging depends on the ratio of the merotelic to amphitelic KMTs (M/A) in the K-fiber, such that, when M/A > 0.5, the amphitelic KMTs cannot overpower the merotelic ones, and this chromosome lags behind the chromosomes with low or zero M/A ratio (Cimini et al., 2003, 2004). Interestingly, for the physiological KMT half-life (4–8 min), our model predicts that 2–8% of merotelic kinetochores have an M/A > 0.5 (Supplemental Figure S4B), which is in agreement with the observed frequency of chromosome lagging in PtK1 cells (7%; Cimini et al., 2003, 2004). However, when we calculate M/A ratio for different KMT half-life times, the lagging is predicted to decrease with increasing KMT stability (Figure 5D). This is in contrast with the experimental result in Figure 5B and is explained in the model by the low “quality” of K-fiber (high M/A ratio) when KMT turnover is fast (Figure 4C and Supplemental Figure S4D). A second hypothesis posits that the tug-of-war at the merotelic kinetochore is resolved successfully owing to a high absolute number of amphitelic KMTs. When the model assumes that a small number of merotelic KMTs does not cause chromosome lagging, the same trend is observed as in the experiment (Figure 5E). Additionally, the model predicts that, for the same KMT half-life, the lagging should be less pronounced in cells with longer mitotic time (Figure 5E, black vs. open circles). This contrasts with the high rate of anaphase lagging in U2OS cells (Figure 5B), in which mitosis lasts significantly longer than in RPE1 cells (30 vs. 18 min; Brito and Rieder, 2009), suggesting that the increased KMT stability is not the sole factor that explains higher frequency of chromosome lagging in cancer cells.
DISCUSSION
A basic mechanism of chromosome biorientation and error correction during mitosis
We report here the results of theoretical investigation of chromosome biorientation and error correction during mitosis. Our model contains a highly simplified bipolar spindle and one kinetochore pair, so this framework is not applicable to the analyses of all mitotic phenomena. Importantly, our model includes two critical kinetochore properties: the constraints on MT binding imposed by the back-to-back kinetochore geometry and the indiscriminate KMT turnover, that is, when the attachment and detachment of proper and improper connections take place with the same probability for all MTs. For the physiological KMT half-life at metaphase (4–8 min), despite its simplicity this model can reproduce well several important aspects of kinetochore–MT interactions in mammalian cells: the kinetics of acquisition of MTs by the kinetochore (10–15 min; Figure 4A), the biorientation time (20–40 min; Figure 4E), and the resulting size and MT distribution of the K-fiber (18–30 KMTs; Figure 4A and Supplemental Figure S3C) (Wendell et al., 1993; McEwen et al., 1997, 2001; Yang et al., 2008; Brito and Rieder, 2009). This situation has allowed us to evaluate the error-correction potential of the mechanism that includes only the geometric constraints and indiscriminate KMT instability. We quantify complex relationships that exist between these two features and show how they affect the overall behavior of the mitotic system.
Importantly, when the duration of mitosis in simulations is not limited and all kinetic processes reach their respective steady states, the geometric constraints fully determine the final accuracy of KMT attachments, as summarized in Figure 6. This conclusion is in contrast with a classic view of the biorientation mechanism, in which the primary role of steric constraints has been suggested to minimize the initial MT attachment errors (Nicklas, 1997). We demonstrate that avoiding the initial improper connections is not essential for achieving the best possible biorientation for a given set of model parameters (e.g., Figures 2E and 4E). If the system is given sufficient time, the improper MT attachments formed during prometaphase are reduced to a steady-state level via the indiscriminate turnover of KMTs. Thus the rate of KMT turnover determines the kinetics of achieving the best possible final state (Figure 4, A and E), while the resulting fraction of bioriented chromosomes is insensitive to the rate of KMT detachment and is determined exclusively by the system’s geometry (Figures 1F and 2F). We think that these major conclusions from our model are applicable to real cells because the calculated time to achieve the steady state for biorientation is similar to the kinetics of mitotic progression in mammalian cells, implying that the duration of unperturbed mitosis is sufficient to take full advantage of this mechanism. Moreover, prolonging mitosis in cells appears to elicit a relatively small decrease in chromosome lagging (2.7-fold; Cimini et al., 2003), suggesting that the mitotic clock matches closely the kinetics of achieving the steady state for the processes included in our model. We therefore propose that a combination of two features, the geometric constraints on KMT attachments and indiscriminate KMT turnover, constitute the basic biorientation mechanism in dividing mammalian cells.
FIGURE 6:
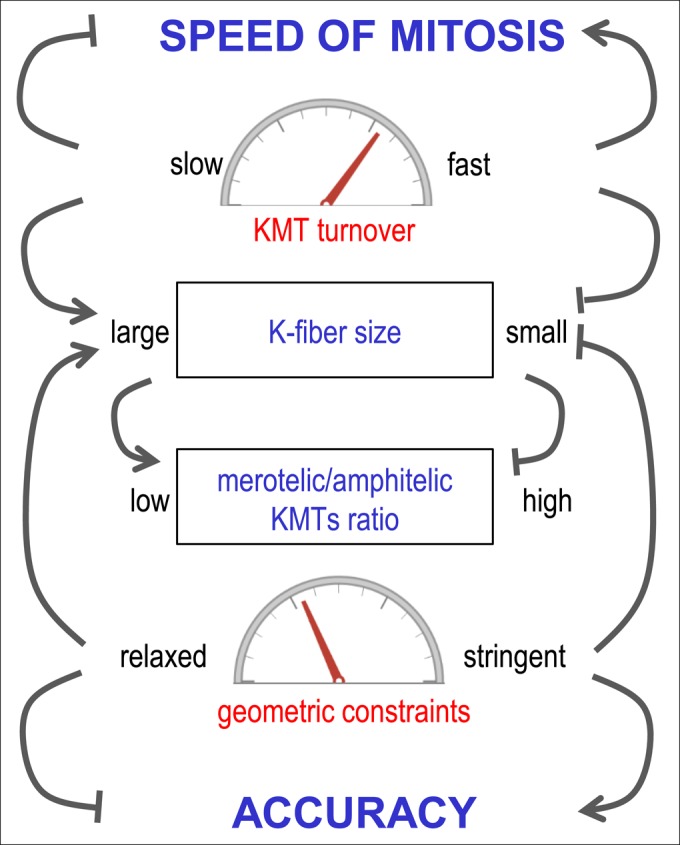
Major model findings about the roles of KMT turnover and geometric constraints. This diagram summarizes complex relationships between KMT turnover and geometric constraints and their impact on the accuracy and speed of chromosome segregation and on the size and M/A ratio of kinetochore MT-containing fiber. Arrow-headed lines correspond to positive effects; bar-headed lines correspond to inhibitory effects; see Discussion for details.
Complex interrelationships within the basic biorientation mechanism
The above analysis appears to suggest that it is advantageous for mitotic cells to employ very stringent geometric constraints (to improve accuracy) and to use very fast KMT turnover (to speed up mitosis). Figure 6, however, illustrates that these parameters cannot be changed significantly without affecting other aspects of kinetochore–MT interactions. For example, increasing the stringency of geometric constraints improves the accuracy of biorientation, but it also increases the time required to capture a KMT and reduces the final K-fiber size (Figure 3). Likewise, faster KMT turnover accelerates mitotic progression, but it also reduces the number of MTs that can be maintained at the kinetochore (Figure 4, A and E). Our data suggest that the typical mammalian kinetochore geometry and physiological lifetime of KMT attachments in cells are near optimal to enable formation of the K-fiber with 18–25 KMTs. It is not well understood why mammalian cells use such a large number of KMTs to segregate their chromosomes (Wendell et al., 1993; McEwen et al., 1997, 2001), given that, in theory, even a single depolymerizing KMT can overcome a viscous drag acting on a chromosome in anaphase (Nicklas, 1965; Grishchuk et al., 2012). Reaching the normal K-fiber size, however, appears to be highly important for cell division because failure to acquire a normal set of KMTs blocks anaphase initiation via a spindle assembly checkpoint mechanism (Musacchio and Salmon, 2007). Our model suggests that large K-fiber size is advantageous to chromosome segregation accuracy because it mechanically stabilizes chromosome orientation, reducing thermal chromosome rotations and enhancing the benefits of the basic mechanism. Also, the model shows that larger K-fibers tend to have better quality, that is, a lower M/A ratio. This is advantageous to mitotic cells because metaphase kinetochores with a high M/A ratio are more likely to bind improper KMTs (Supplemental Figure S4C), so the rate of error correction at such kinetochores is predicted to be slower. Also, the kinetochores with lower M/A appear to segregate more normally during anaphase (Cimini et al., 2003, 2004), so the segregation outcome for cells with larger K-fibers may be statistically better. However, when we took into account how the fraction of kinetochores with M/A < 0.5 changes as a function of both the KMT half-life and the duration of mitosis, the experiments with different cell lines (Bakhoum et al., 2009) could not be matched using the M/A ratio as a sole determining factor for anaphase lagging (Figure 5D and Supplemental Figure S4D). Thus the physiological importance of the M/A ratio for anaphase lagging remains to be determined.
Overall our results support the view that the stability of KMT attachments and geometric constraints must be balanced to optimize different mitotic features and that changing one such parameter may have multiple direct and indirect effects on mitotic progression (Figure 6). These relationships are not always intuitive, so caution should be taken when drawing direct correlations between a given mitotic feature and a specific phenotypic outcome. We hope that the quantitative relationships we have derived in this work will promote systematic analysis of these dependencies in different cell lines, deepening our understanding of the basic biorientation mechanism.
Optimization of the biorientation outcome using the basic mechanism: geometric constraints
Our model analysis offers new insights into how cells optimize their strategy for chromosome biorientation using a basic mechanism (Figure 7A). As discussed above, modeling predicts that preventing improper KMT attachments early in mitosis by stringent geometric restrictions is not entirely beneficial because strong restrictions impede the MT capture and end up costing significant time (Figure 6). Furthermore, minimizing the initial errors is not required for the basic biorientation mechanism if the duration of mitosis is matched well with the kinetics of KMT turnover. This leads us to propose that the optimal strategy for a mitotic outcome is to relax geometric constraints during the initial stages of kinetochore–MT interactions. Indeed, it appears that mammalian cells do not have very stringent geometric constraints in prometaphase because at this stage ∼10% of chromosomes have sister kinetochores in a side-by-side orientation (Loncarek et al., 2007), which is highly permissive to the formation of multiple merotelic attachments. This observation is explained by our calculations, which show that the rate of prometaphase KMT turnover (2–4 min) is fast enough to eliminate the initial MT attachment errors in 16–24 min (Figure 4E), which is comparable with the total duration of mitosis in normal cells (Brito and Rieder, 2009). Additional support for the idea that the kinetochore geometry early in mitosis should not be too restrictive comes from prior studies suggesting that MT capture by the kinetochore may be a rate-limiting factor for mitotic progression (Magidson et al., 2011). In this case, it would be highly advantageous for cells to promote MT capture by weak geometric restrictions despite the increased risk of binding a wrong KMT. Indeed, mammalian cells appear to have special mechanisms to relax geometric constraints, as evidenced by the increased curvature of the kinetochore and the enlargement of the kinetochore corona in prometaphase or when MT capture is impeded (Hoffman et al., 2001; Magidson et al., 2015).
FIGURE 7:
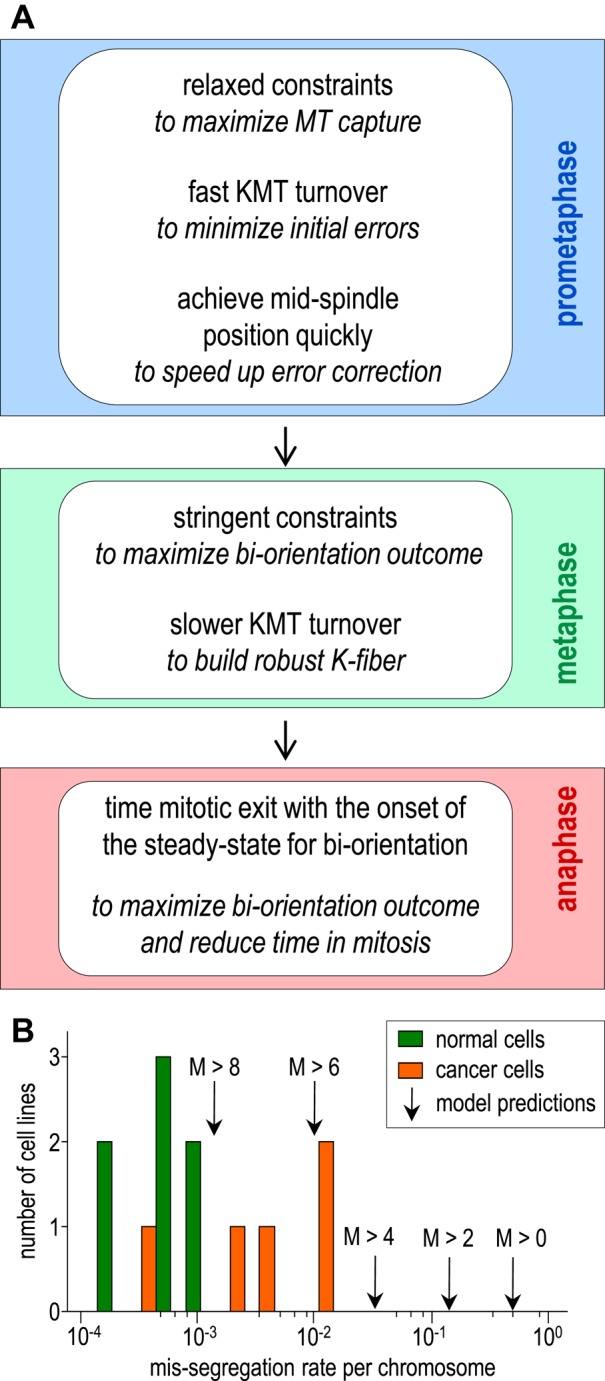
Predicted strategy to achieve optimal biorientation via the basic mechanism and the resulting rate of chromosome mis-segregation. (A) Optimization of the KMT stability and geometric constraints allows achieving multiple goals during mitotic progression; see Discussion for details. (B) Histogram of the mis-segregation rate per chromosome (logarithmic scale) for different cell lines (Supplemental Table S1). Model predictions are for different numbers of merotelic MTs (M); chromosomes are assumed to mis-segregate when M is larger than indicated. Mis-segregation rate is the highest when the model assumes that any number of merotelic KMTs (M > 0) cause a mis-segregation of this chromosome.
The same logic leads us to predict that the optimal mitotic strategy should include an expedient chromosome congression, enabling the kinetochore pair to assume the position midway between the poles as quickly as possible (Figure 7A). This is because the positive feedback for the basic error-correction mechanism operates at maximum when the kinetochore pair is positioned favorably, and achieving this position marks the start of a productive time toward the steady state with a minimal number of merotelic KMTs. We find support for this idea in the established ability of chromosomes to congress via different mechanisms and even without biorientation (Walczak et al., 2010). After the chromosome has congressed, the level of biorientation that can be achieved with the basic mechanism depends strongly on how well the sister kinetochores are shielded from wrong MT ends. In dividing mammalian cells, the improper MT attachments are formed even when the sister kinetochores face opposite poles (Cimini et al., 2003). Optimal biorientation strategy should therefore include imposing more stringent constraints on MT attachments later in mitosis, which is consistent with the observed decrease in kinetochore corona in metaphase (Magidson et al., 2015). Thus the dynamic changes in geometric constraints, expedient congression and any mechanical spindle features that stabilize the coalignment of the kinetochore and spindle axes, are the highly important factors that optimize operation of the basic mechanism.
Optimization of the biorientation outcome using the basic mechanism: the indiscriminate KMT turnover
Although the rate of KMT turnover does not affect the final biorientation outcome when the duration of mitosis matches the kinetics toward the steady state, the impact of the KMT turnover rate is significant if anaphase starts before the steady state is reached. In normal cells, the inappropriate MT stabilization is sufficient for creating chromosome segregation errors (Bakhoum et al., 2009). Modeling suggests that this effect stems from two separate problems. First, slow KMT turnover promotes formation of a larger number of MT attachment errors early in mitosis, as evidenced from the increase in improper KMTs on the kinetochores that have not yet fully oriented along the spindle axis (Figure 4E). This increase in erroneous attachments exacerbates the second problem: slower than normal KMT detachment during metaphase, when the KMT turnover works toward reducing the initial errors. The resulting mismatch between the longer time toward the steady state when KMT turnover is reduced and the normal (or insufficiently delayed) timing for anaphase initiation explains the negative effect of KMT stabilization on chromosome segregation in normal cells. Similar effects explain the benefits of KMT destabilization in cancer cell lines with overly stable KMTs (Kabeche and Compton, 2013), consistent with previous views (Godek et al., 2015).
In summary, our modeling predicts the following strategy to optimize the benefits of indiscriminate KMT turnover. During the first 3–6 min of mitosis, the relatively fast turnover is highly advantageous because it reduces the number of merotelic KMTs acquired before chromosome congression (Figure 4E). However, when KMT lifetime is only 1–3 min, the full-size K-fiber cannot be built, no matter how long the cell waits (Figure 4A). Thus the normal K-fiber requires increasing the KMT half-life to 4–8 min, even though such a stabilization delays the steady state by ∼15 min. It is of interest that, in many cells in culture, the KMT turnover slows down in metaphase in a manner quantitatively consistent with our calculations (Cimini et al., 2006; DeLuca et al., 2006; Bakhoum et al., 2009; Kabeche and Compton, 2013). This KMT stabilization seems contradictory to the previous proposal that indiscriminate KMT turnover works as a positive factor that reduces segregation errors (Bakhoum and Compton, 2012). Our model explains the KMT stabilization during normal metaphase as a necessary factor to counteract the negative impact of the fast KMT turnover on K-fiber size. Thus the overall change in KMT stability during mitotic progression, which appears to take place independently from the tension-induced KMT stabilization mechanism (Kabeche and Compton, 2013), may reflect a compromise caused by the multiple roles played by the KMT turnover during mitosis and the apparent need to balance these different outcomes.
Theoretical estimate of the accuracy of chromosome segregation via the basic mechanism
Importantly, the values of parameters that describe MT dynamics and spindle geometry in our model, and which we chose based on multiple experimental evidences, appear to provide optimal achievement of multiple mitotic goals. We therefore used this modeling tool to calculate the chromosome mis-segregation rate that can be achieved with the basic biorientation mechanism. When each kinetochore binds multiple MTs, the fraction of kinetochores that fortuitously form connections only with the correct MTs is negligible: for 13–24 KMTs, as in human cells, it is close to 10−8–10−14 (Figure 1E). The basic error-correction mechanism provides a vast improvement, leading to correct KMT attachments in ∼50% of mitotic chromosomes. If even a single merotelic KMT causes lagging and mis-segregation of chromosomes during anaphase, this mechanism would lead to a 5 × 10⁻¹ mis-segregation rate per chromosome. However, normal segregation has been reported for some merotelic kinetochores (Cimini et al., 2003, 2004; Thompson and Compton, 2011), which presumably happens when the number of merotelic KMTs is low. When the model assumes that up to two merotelic KMTs (from a total of 18) have no detrimental effects on anaphase segregation, the predicted mis-segregation rate improves 1.7-fold; if up to six merotelic KMTs are allowed, the rate improves 50-fold (Supplemental Figure S4E). If the chromosomes are mis-segregated only when their M/A ratio exceeds 0.5 (corresponds to six merotelic MTs in K-fiber with 18 MTs), the mis-segregation rate is 2 × 10⁻². It is interesting that these different assumptions do not change our estimates for chromosome segregation accuracy significantly, especially when compared with the dramatic decrease in accuracy in the absence of geometric constraints or KMT turnover (Figure 1F). Thus, although our model is simplified, we think that the mis-segregation rate in the 10−2–10−1 range reflects accurately the error-correcting potential of the basic mechanism.
Interestingly, the predicted chromosome segregation accuracy in our model differs by approximately two orders of magnitude from the chromosome loss in diploid human cells (Figure 7B and Supplemental Table S1). Our above estimate assumes that all chromosomes that are scored as lagging during anaphase would eventually become mis-segregated. However, in RPE-1 cells, the mis-segregated chromosomes have been reported to constitute only 15% of the lagging ones (Supplemental Table S1). Taking this factor into account improves our prediction for the basic mechanism to 10−3–10−2 (for M > 4). Even with this adjustment, the difference between this theoretical prediction and the experimental mis-segregation rate in RPE-1 cells (1.9 × 10⁻⁴) is significant, and it appears that it cannot be bridged by using only the processes included in our model (i.e., by varying its parameters). Therefore this study provides theoretical support for the existence of additional error-correction mechanisms in normal cells, which provide 10- to 100-fold improvement in the rate of chromosome miss-segregation on top of the basic mechanism. Interestingly, the chromosome mis-segregation rate in cancer cells is strikingly close to our theoretical estimates (Figure 7B and Supplemental Table S1). This similarly low chromosome segregation accuracy could arise if the cancer cells have lost some specialized biorientation mechanism(s) and their cell division relies only on the basic mechanism. Alternatively, mitosis in these cells may deviate in some significant way from the normal features of the basic mechanism, such as kinetochore geometry or KMT turnover rate. As additional quantitative data become available for different cell lines, the modeling tools we have developed will help to reveal the most likely causes of the pathologically high rate of chromosome mis-segregation that is a hallmark feature of cancer cells.
Supplementary Material
Acknowledgments
We are grateful to F. I. Ataullakhanov for help with mathematical modeling and S. Karamzin for help with Supplemental Video 1. We also thank M. A. Lampson, I. M. Cheeseman, J. G. DeLuca, B. E. Black, and B. Vitre for stimulating discussions and M. Godzi for technical assistance. This work was supported by National Institutes of Health grant GM083988 to E.L.G. and M. A. Lampson, and by Research Scholar Grant RGS-14-018—01-CCG from the American Cancer Society to E.L.G. A.V.Z. is supported in part by grants from the Russian Fund for Basic Research (13-04-40188-H and 13-04-40190-H) and from the Presidium of the Russian Academy of Sciences (“Mechanisms of the Molecular Systems Integration” and “Molecular and Cell Biology programs”) to F. I. Ataullakhanov.
Abbreviations used:
- 2D
two-dimensional
- 3D
three-dimensional
- K-fiber
kinetochore fiber
- KMT
kinetochore-associated microtubule
- MT
microtubule.
Footnotes
This article was published online ahead of print in MBoC in Press (http://www.molbiolcell.org/cgi/doi/10.1091/mbc.E15-06-0384) on September 30, 2015.
REFERENCES
- Alexander SP, Rieder CL. Kinetochores are transported poleward along a single astral microtubule during chromosome attachment to the spindle in newt lung cells. J Cell Biol. 1990;110:81–95. doi: 10.1083/jcb.110.1.81. [DOI] [PMC free article] [PubMed] [Google Scholar]
- Bakhoum SF, Compton DA. Kinetochores and disease: keeping microtubule dynamics in check! Curr Opin Cell Biol. 2012;24:64–70. doi: 10.1016/j.ceb.2011.11.012. [DOI] [PMC free article] [PubMed] [Google Scholar]
- Bakhoum SF, Genovese G, Compton DA. Deviant kinetochore microtubule dynamics underlie chromosomal instability. Curr Biol. 2009;19:1937–1942. doi: 10.1016/j.cub.2009.09.055. [DOI] [PMC free article] [PubMed] [Google Scholar]
- Bakhoum SF, Silkworth WT, Nardi IK, Nicholson JM, Compton DA, Cimini D. The mitotic origin of chromosomal instability. Curr Biol. 2014;24:R148–R149. doi: 10.1016/j.cub.2014.01.019. [DOI] [PMC free article] [PubMed] [Google Scholar]
- Brito DA, Rieder CL. The ability to survive mitosis in the presence of microtubule poisons differs significantly between human nontransformed (RPE-1) and cancer (U2OS, HeLa) cells. Cell Motil Cytoskeleton. 2009;66:437–447. doi: 10.1002/cm.20316. [DOI] [PMC free article] [PubMed] [Google Scholar]
- Cheeseman IM, Desai A. Molecular architecture of the kinetochore-microtubule interface. Nat Rev Mol Cell Biol. 2008;9:33–46. doi: 10.1038/nrm2310. [DOI] [PubMed] [Google Scholar]
- Cimini D. Merotelic kinetochore orientation, aneuploidy, and cancer. Biochim Biophys Acta. 2008;1786:32–40. doi: 10.1016/j.bbcan.2008.05.003. [DOI] [PubMed] [Google Scholar]
- Cimini D, Cameron LA, Salmon ED. Anaphase spindle mechanics prevent mis-segregation of merotelically oriented chromosomes. Curr Biol. 2004;14:2149–2155. doi: 10.1016/j.cub.2004.11.029. [DOI] [PubMed] [Google Scholar]
- Cimini D, Degrassi F. Aneuploidy: a matter of bad connections. Trends Cell Biol. 2005;15:442–451. doi: 10.1016/j.tcb.2005.06.008. [DOI] [PubMed] [Google Scholar]
- Cimini D, Fioravanti D, Salmon ED, Degrassi F. Merotelic kinetochore orientation versus chromosome mono-orientation in the origin of lagging chromosomes in human primary cells. J Cell Sci. 2002;115:507–515. doi: 10.1242/jcs.115.3.507. [DOI] [PubMed] [Google Scholar]
- Cimini D, Howell B, Maddox P, Khodjakov A, Degrassi F, Salmon ED. Merotelic kinetochore orientation is a major mechanism of aneuploidy in mitotic mammalian tissue cells. J Cell Biol. 2001;153:517–527. doi: 10.1083/jcb.153.3.517. [DOI] [PMC free article] [PubMed] [Google Scholar]
- Cimini D, Moree B, Canman JC, Salmon ED. Merotelic kinetochore orientation occurs frequently during early mitosis in mammalian tissue cells and error correction is achieved by two different mechanisms. J Cell Sci. 2003;116:4213–4225. doi: 10.1242/jcs.00716. [DOI] [PubMed] [Google Scholar]
- Cimini D, Wan X, Hirel CB, Salmon ED. Aurora kinase promotes turnover of kinetochore microtubules to reduce chromosome segregation errors. Curr Biol. 2006;16:1711–1718. doi: 10.1016/j.cub.2006.07.022. [DOI] [PubMed] [Google Scholar]
- Compton DA. Spindle assembly in animal cells. Annu Rev Biochem. 2000;69:95–114. doi: 10.1146/annurev.biochem.69.1.95. [DOI] [PubMed] [Google Scholar]
- DeLuca JG, Gall WE, Ciferri C, Cimini D, Musacchio A, Salmon ED. Kinetochore microtubule dynamics and attachment stability are regulated by Hec1. Cell. 2006;127:969–982. doi: 10.1016/j.cell.2006.09.047. [DOI] [PubMed] [Google Scholar]
- Duncan AW, Hanlon Newell AE, Smith L, Wilson EM, Olson SB, Thayer MJ, Strom SC, Grompe M. Frequent aneuploidy among normal human hepatocytes. Gastroenterology. 2012;142:25–28. doi: 10.1053/j.gastro.2011.10.029. [DOI] [PMC free article] [PubMed] [Google Scholar]
- Gascoigne KE, Cheeseman IM. Kinetochore assembly: if you build it, they will come. Curr Opin Cell Biol. 2011;23:102–108. doi: 10.1016/j.ceb.2010.07.007. [DOI] [PMC free article] [PubMed] [Google Scholar]
- Godek KM, Kabeche L, Compton DA. Regulation of kinetochore-microtubule attachments through homeostatic control during mitosis. Nat Rev Mol Cell Biol. 2015;16:57–64. doi: 10.1038/nrm3916. [DOI] [PMC free article] [PubMed] [Google Scholar]
- Grishchuk EL, McIntosh JR, Molodtsov MI, Ataullakhanov FI. Force generation by dynamic microtubule polymers. In: Goldman YE, Ostap EM, editors. In: Molecular Motors and Motility, Comprehensive Biophysics. vol. 4. Molecular Motors and Motility, Amsterdam: Elsevier; 2012. pp. 93–117. [Google Scholar]
- Hahnenberger KM, Baum MP, Polizzi CM, Carbon J, Clarke L. Construction of functional artificial minichromosomes in the fission yeast Schizosaccharomyces pombe. Proc Natl Acad Sci USA. 1989;86:577–581. doi: 10.1073/pnas.86.2.577. [DOI] [PMC free article] [PubMed] [Google Scholar]
- Hartwell LH, Smith D. Altered fidelity of mitotic chromosome transmission in cell cycle mutants of S. cerevisiae. Genetics. 1985;110:381–395. doi: 10.1093/genetics/110.3.381. [DOI] [PMC free article] [PubMed] [Google Scholar]
- Hauf S, Cole RW, LaTerra S, Zimmer C, Schnapp G, Walter R, Heckel A, van Meel J, Rieder CL, Peters JM. The small molecule Hesperadin reveals a role for Aurora B in correcting kinetochore-microtubule attachment and in maintaining the spindle assembly checkpoint. J Cell Biol. 2003;161:281–94. doi: 10.1083/jcb.200208092. [DOI] [PMC free article] [PubMed] [Google Scholar]
- Hoffman DB, Pearson CG, Yen TJ, Howell BJ, Salmon ED. Microtubule-dependent changes in assembly of microtubule motor proteins and mitotic spindle checkpoint proteins at PtK1 kinetochores. Mol Biol Cell. 2001;12:1995–2009. doi: 10.1091/mbc.12.7.1995. [DOI] [PMC free article] [PubMed] [Google Scholar]
- Indjeian VB, Murray AW. Budding yeast mitotic chromosomes have an intrinsic bias to biorient on the spindle. Curr Biol. 2007;17:1837–1846. doi: 10.1016/j.cub.2007.09.056. [DOI] [PubMed] [Google Scholar]
- Jordan MA, Kamath K. How do microtubule-targeted drugs work? An overview. Curr Cancer Drug Targets. 2007;7:730–742. doi: 10.2174/156800907783220417. [DOI] [PubMed] [Google Scholar]
- Kabeche L, Compton DA. Cyclin A regulates kinetochore microtubules to promote faithful chromosome segregation. Nature. 2013;502:110–113. doi: 10.1038/nature12507. [DOI] [PMC free article] [PubMed] [Google Scholar]
- Lampson MA, Cheeseman IM. Sensing centromere tension: Aurora B and the regulation of kinetochore function. Trends Cell Biol. 2011;21:133–140. doi: 10.1016/j.tcb.2010.10.007. [DOI] [PMC free article] [PubMed] [Google Scholar]
- Lampson MA, Renduchitala K, Khodjakov A, Kapoor TM. Correcting improper chromosome-spindle attachments during cell division. Nat Cell Biol. 2004;6:232–237. doi: 10.1038/ncb1102. [DOI] [PubMed] [Google Scholar]
- Leach NT, Rehder C, Jensen K, Holt S, Jackson-Cook C. Human chromosomes with shorter telomeres and large heterochromatin regions have a higher frequency of acquired somatic cell aneuploidy. Mech Ageing Dev. 2004;125:563–573. doi: 10.1016/j.mad.2004.06.006. [DOI] [PubMed] [Google Scholar]
- Loncarek J, Kisurina-Evgenieva O, Vinogradova T, Hergert P, La Terra S, Kapoor TM, Khodjakov A. The centromere geometry essential for keeping mitosis error free is controlled by spindle forces. Nature. 2007;450:745–749. doi: 10.1038/nature06344. [DOI] [PMC free article] [PubMed] [Google Scholar]
- Magidson V, O’Connell CB, Loncˇarek J, Paul R, Mogilner A, Khodjakov A. The spatial arrangement of chromosomes during prometaphase facilitates spindle assembly. Cell. 2011;146:555–567. doi: 10.1016/j.cell.2011.07.012. [DOI] [PMC free article] [PubMed] [Google Scholar]
- Magidson V, Paul R, Yang N, Ault JG, O’Connell CB, Tikhonenko I, McEwen BF, Mogilner A, Khodjakov A. Adaptive changes in the kinetochore architecture facilitate proper spindle assembly. Nat Cell Biol. 2015;17:1134–1144. doi: 10.1038/ncb3223. [DOI] [PMC free article] [PubMed] [Google Scholar]
- McEwen BF, Chan GK, Zubrowski B, Savoian MS, Sauer MT, Yen TJ. CENP-E is essential for reliable bioriented spindle attachment, but chromosome alignment can be achieved via redundant mechanisms in mammalian cells. Mol Biol Cell. 2001;12:2776–2789. doi: 10.1091/mbc.12.9.2776. [DOI] [PMC free article] [PubMed] [Google Scholar]
- McEwen BF, Heagle AB, Cassels GO, Buttle KF, Rieder CL. Kinetochore fiber maturation in PtK1 cells and its implications for the mechanisms of chromosome congression and anaphase onset. J Cell Biol. 1997;137:1567–1580. doi: 10.1083/jcb.137.7.1567. [DOI] [PMC free article] [PubMed] [Google Scholar]
- McIntosh JR, Landis SC. The distribution of spindle microtubules during mitosis in cultured human cells. J Cell Biol. 1971;49:468–497. doi: 10.1083/jcb.49.2.468. [DOI] [PMC free article] [PubMed] [Google Scholar]
- Musacchio A, Salmon ED. The spindle-assembly checkpoint in space and time. Nat Rev Mol Cell Biol. 2007;8:379–393. doi: 10.1038/nrm2163. [DOI] [PubMed] [Google Scholar]
- Nicholson JM, Cimini D. Link between aneuploidy and chromosome instability. Int Rev Cell Mol Biol. 2015;315:299–317. doi: 10.1016/bs.ircmb.2014.11.002. [DOI] [PubMed] [Google Scholar]
- Nicklas RB. Chromosome velocity during mitosis as a function of chromosome size and position. J Cell Biol. 1965;25:119–135. doi: 10.1083/jcb.25.1.119. [DOI] [PMC free article] [PubMed] [Google Scholar]
- Nicklas RB. How cells get the right chromosomes. Science. 1997;275:632–637. doi: 10.1126/science.275.5300.632. [DOI] [PubMed] [Google Scholar]
- Nicklas RB, Ward SC. Elements of error correction in mitosis: microtubule capture, release, and tension. J Cell Biol. 1994;126:1241–1253. doi: 10.1083/jcb.126.5.1241. [DOI] [PMC free article] [PubMed] [Google Scholar]
- Paul R, Wollman R, Silkworth WT, Nardi IK, Cimini D, Mogilner A. Computer simulations predict that chromosome movements and rotations accelerate mitotic spindle assembly without compromising accuracy. Proc Natl Acad Sci USA. 2009;106:15708–15713. doi: 10.1073/pnas.0908261106. [DOI] [PMC free article] [PubMed] [Google Scholar]
- Rieder CL, Salmon ED. The vertebrate cell kinetochore and its roles during mitosis. Trends Cell Biol. 1998;8:310–318. doi: 10.1016/s0962-8924(98)01299-9. [DOI] [PMC free article] [PubMed] [Google Scholar]
- Ris H, Witt PL. Structure of the mammalian kinetochore. Chromosoma. 1981;82:153–170. doi: 10.1007/BF00286101. [DOI] [PubMed] [Google Scholar]
- Roos UP. Light and electron microscopy of rat kangaroo cells in mitosis. II. Kinetochore structure and function. Chromosoma. 1973;41:195–220. doi: 10.1007/BF00319696. [DOI] [PubMed] [Google Scholar]
- Salmon ED, Cimini D, Cameron LA, DeLuca JG. Merotelic kinetochores in mammalian tissue cells. Philos Trans R Soc Lond B Biol Sci. 2005;360:553–568. doi: 10.1098/rstb.2004.1610. [DOI] [PMC free article] [PubMed] [Google Scholar]
- Santaguida S, Musacchio A. The life and miracles of kinetochores. EMBO J. 2009;28:2511–2531. doi: 10.1038/emboj.2009.173. [DOI] [PMC free article] [PubMed] [Google Scholar]
- Silkworth WT, Nardi IK, Paul R, Mogilner A, Cimini D. Timing of centrosome separation is important for accurate chromosome segregation. Mol Biol Cell. 2012;23:401–411. doi: 10.1091/mbc.E11-02-0095. [DOI] [PMC free article] [PubMed] [Google Scholar]
- Thompson SL, Compton DA. Examining the link between chromosomal instability and aneuploidy in human cells. J Cell Biol. 2008;180:665–672. doi: 10.1083/jcb.200712029. [DOI] [PMC free article] [PubMed] [Google Scholar]
- Thompson SL, Compton DA. Chromosome missegregation in human cells arises through specific types of kinetochore-microtubule attachment errors. Proc Natl Acad Sci USA. 2011;108:17974–17978. doi: 10.1073/pnas.1109720108. [DOI] [PMC free article] [PubMed] [Google Scholar]
- Walczak CE, Cai S, Khodjakov A. Mechanisms of chromosome behaviour during mitosis. Nat Rev Mol Cell Biol. 2010;11:91–102. doi: 10.1038/nrm2832. [DOI] [PMC free article] [PubMed] [Google Scholar]
- Wan X, O’Quinn RP, Pierce HL, Joglekar AP, Gall WE, DeLuca JG, Carroll CW, Liu ST, Yen TJ, McEwen BF, et al. Protein architecture of the human kinetochore microtubule attachment site. Cell. 2009;137:672–684. doi: 10.1016/j.cell.2009.03.035. [DOI] [PMC free article] [PubMed] [Google Scholar]
- Weaver BA, Cleveland DW. Does aneuploidy cause cancer. Curr Opin Cell Biol. 2006;18:658–667. doi: 10.1016/j.ceb.2006.10.002. [DOI] [PubMed] [Google Scholar]
- Wendell KL, Wilson L, Jordan MA. Mitotic block in HeLa cells by vinblastine: ultrastructural changes in kinetochore-microtubule attachment and in centrosomes. J Cell Sci. 1993;104:261–274. doi: 10.1242/jcs.104.2.261. [DOI] [PubMed] [Google Scholar]
- Yang Z, Loncarek J, Khodjakov A, Rieder CL. Extra centrosomes and/or chromosomes prolong mitosis in human cells. Nat Cell Biol. 2008;10:748–751. doi: 10.1038/ncb1738. [DOI] [PMC free article] [PubMed] [Google Scholar]
- Zaytsev AV, Sundin LJ, DeLuca KF, Grishchuk EL, DeLuca JG. Accurate phosphoregulation of kinetochore-microtubule affinity requires unconstrained molecular interactions. J Cell Biol. 2014;206:45–59. doi: 10.1083/jcb.201312107. [DOI] [PMC free article] [PubMed] [Google Scholar]
- Zhai Y, Kronebusch PJ, Borisy GG. Kinetochore microtubule dynamics and the metaphase-anaphase transition. J Cell Biol. 1995;131:721–734. doi: 10.1083/jcb.131.3.721. [DOI] [PMC free article] [PubMed] [Google Scholar]
Associated Data
This section collects any data citations, data availability statements, or supplementary materials included in this article.