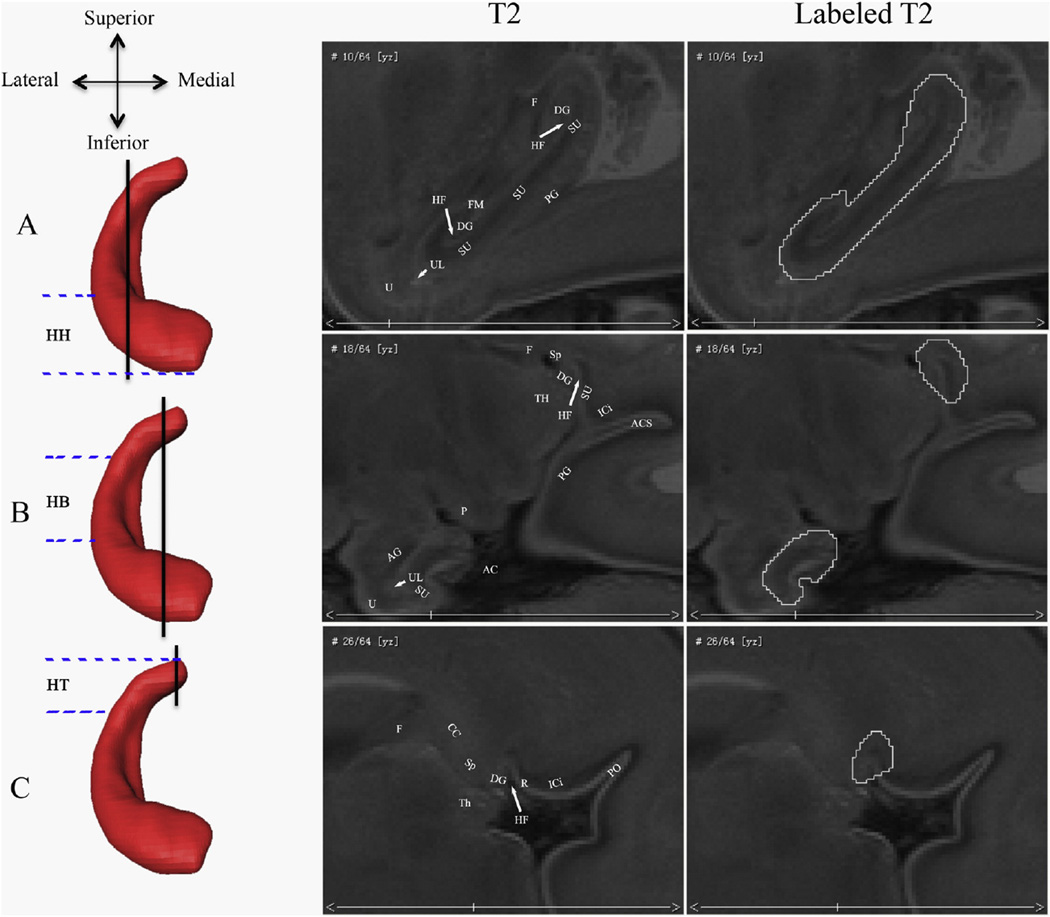
Fig. 2.
Borders of the fetal hippocampal formation in the sagittal plane. The rows show different sagittal levels of the hippocampal formation (HF). The vertical black lines on the left 3D coronal hippocampal renderings indicate where the corresponding sagittal slices are along the lateral–medial axis. The parallel blue imaginary lines indicate the approximate ranges of the HH, HB, and HT. The right two columns of T2 images show the sagittal view of the fetal hippocampal formation and its segmentations. Abbreviations show different brain structures: (AC) ambient cistern; (UL) uncal recess of the temporal horn of the lateral ventricle; (ICi) isthmus of the cingulate gyrus; (PG) parahippocampal gyrus; (HF) hippocampal fissure; (Sp) splenium of the corpus callosum; (F) fornix; (R) retrosplenial cortex; (FM) fimbria; (SU) subiculum; (P) cerebral peduncle; (Th) thalamus; (DG) dentate gyrus; (AG) amgydala; (CC) corpus callosum; (ACS) anterior calcarine sulcus; (PO) parietooccipital sulcus; and (U) uncus.

