Abstract
Epinephrine is one of the major hormones involved in glucose counter-regulation and gluconeogenesis. However, little is known about its importance in energy homeostasis during fasting.
Our objective is to study the specific role of epinephrine in glucose and lipid metabolism during starvation.
In our experiment, we subject regular mice and epinephrine-deficient mice to a 48-h fast then we evaluate the different metabolic responses to fasting.
Our results show that epinephrine is not required for glucose counter-regulation: epinephrine-deficient mice maintain their blood glucose at normal fasting levels via glycogenolysis and gluconeogenesis, with normal fasting-induced changes in the peroxisomal activators: peroxisome proliferator activated receptor γ coactivator α (PGC-1α), fibroblast growth factor 21 (FGF-21), peroxisome proliferator activated receptor α (PPAR-α), and sterol regulatory element binding protein (SREBP-1c). However, fasted epinephrine-deficient mice develop severe ketosis and hepatic steatosis, with evidence for inhibition of hepatic autophagy, a process that normally provides essential energy via degradation of hepatic triglycerides during starvation.
We conclude that, during fasting, epinephrine is not required for glucose homeostasis, lipolysis or ketogenesis. Epinephrine may have an essential role in lipid handling, possibly via an autophagy-dependent mechanism.
Keywords: Brown adipose tissue, Epinephrine, Autophagy, Fasting, Steatosis, Metabolism
1. Introduction
Multiple hormones are involved in glucose counter-regulation: insulin, glucagon epinephrine, growth hormone, and glucocorticoid (cortisol in humans and corticosterone in rodents) (Schwartz et al., 1987; Mitrakou et al., 1991). Epinephrine has been implicated in many physiological responses through its actions on the different adrenergic receptors including its unique affinity for the β2 receptor. Early studies described epinephrine administration as causing hyperglycemia and glycosuria (Cannon, 1929) and noted its elevation during insulin-induced hypoglycemia (Duner, 1953). In 1958, Sutherland found that epinephrine and glucagon mediate their gluconeogenic and glycogenolytic effects on liver via signaling through cAMP (Sutherland and Rall, 1958) but the downstream mechanisms of epinephrine action in the liver remain unclear.
The majority of circulating epinephrine is synthesized from norepinephrine in the adrenal medulla by a methylation step catalyzed by the enzyme, phenylethanolamine N-methyltransferase (Pnmt).
Epinephrine was previously described to be essential in counter-regulation of glucose after insulin-induced hypoglycemia in sympathectomized dogs with or without the adrenal medulla (Brouha et al., 1939). However, other reports demonstrated that epinephrine in humans was not essential for glucose counter-regulation except in the setting of concomitant glucagon deficiency (Cryer et al., 1984; Cryer, 1993a,b). In these studies, the role of epinephrine was examined only in the setting of adrenergic blockade that also prevented norepinephrine action (De Feo et al., 1991). Similar results were described by Boyle et al. (1989); epinephrine was shown not to be critical in glucose counter-regulation; plasma epinephrine levels did not increase after an overnight fast in humans except when glucagon was deficient. Epinephrine levels rose after a 3-day fast (more so when glucagon was deficient) likely secondary to hypoglycemia. Norepineprhine was found to have a similar response.
Recently, lipid trafficking through autophagy was shown to be essential in the stress response to starvation (Singh et al., 2009). Autophagy delivers a lipid-laden cellular organelle to lysosomes during starvation for use as an alternate energy source (Levine and Kroemer, 2008). Glucagon is a major activator of autophagy during hepatic gluconeogenesis (Deter and De Duve, 1967; Deter et al., 1967). Epinephrine also has been shown to stimulate autophagy in the liver (Kondomerkos et al., 2005), although its role in lipid metabolism is not known.
To further define the specific role of epinephrine in the metabolic response to starvation, we used a Pnmt knock out (Pnmt −/−) mouse model in which the Pnmt locus was mutated by insertion of Cre-recombinase in exon 1 to cause disruption of the coding region of the endogenous gene (Ebert et al., 2004). These mice are completely deficient in epinephrine, but have normal norepinephrine production and secretion. We examined the role of epinephrine in the setting of chronic fasting and the metabolic adaptation to the fasting state, particularly in glucose counter-regulation, lipid oxidation, and hepatic lipid accumulation.
In agreement with other studies, we found that epinephrine is not required for normal fasting-induced glycogenolysis, lipolysis, or ketogenesis. Surprisingly, we found that epinephrine deficiency is associated with abnormal hepatic fasting-induced lipid metabolism, possibly consistent with a defect in hepatic autophagy.
2. Materials and methods
2.1. Animals
12-Week-old male Pnmt −/− (strain 129) were compared to WT mice on the same background. The Pnmt −/− mouse line was created by insertion of Cre-recombinase in exon 1 into the Pnmt locus, making Cre-recombinase expression dependent on Pnmt regulatory sequences. This allows for expression of Cre-recombinase and disruption of Pnmt in adrenergic cells (Ebert et al., 2004). The presence of the Pnmt −/− allele was verified by PCR of tail DNA, as well as by the absence of intra-adrenal epinephrine (data not shown) and Pnmt mRNA. These mice appear similar to their littermates and are able to breed normally. Animals were maintained on a 12-h light–dark cycle with lights on at 07:00 h. All mice were given unlimited access to drinking water and the fed groups had ad libitum access to food. The fasting animals had ad libitum access to food until 08:00 h on the day of the experiment. Animals were individually housed 3 days prior to the start of the experiment. The Animal Care and Use Committee of Children’s Hospital Boston approved all animal experiments.
2.2. DEXA
2 weeks prior to the initiation of fasting, animals were anesthetized with 85 mg/kg of ketamine and 8.5 mg/kg of xylazine. Nose to anus length was measured, and body composition by DEXA (PIX-IMus II, GE Medical Systems Luna, Madison, WI) was performed.
2.3. Sample collection
On day zero, at t = 0 (08:00 h), all animals were weighed and tail blood was obtained for initial blood glucose and ketone levels. Animals were fasted for 48 h, weighed, tail blood glucose and blood ketones were measured, and retro-orbital phlebotomy was performed at 08:00 h on day two. Plasma was collected and stored at −80 °C. After decapitation, the livers were collected, immediately frozen on dry ice, and stored at −80 °C until assayed. Blood glucose and ketones were measured with the One Touch Ultra (Lifescan, Milpitas, CA) and Precision Xtra (Abbott, Alameda, CA) meters, respectively.
The glucose tolerance test was performed on all animals a week prior to the experiment; following a 14 h fast, tail blood glucose was measured, and then an intraperitoneal injection of 2 g/kg of 20% D-glucose was given. Tail blood glucose was then measured at t = 15, 30, 60 and 120 min.
2.4. Hormone analysis
Insulin and glucagon were measured by ELISA (Kulkarni et al., 2002; Ueki et al., 2006) and RIA (Michael et al., 2000), respectively in the Specialized Assay Core, Joslin Diabetes Center, Boston, MA. Plasma catecholamine analysis was performed using HPLC with a C-18 reverse phase column in combination with an electrochemical detector (Goldstein et al., 1984).
2.5. Quantitative RT-PCR for mRNA
qRT-PCR of mRNA was performed with total RNA purified from the livers and adrenal glands using Trizol (Sigma Inc., Saint Louis, MO). Reverse transcription was done using 1 μg of total RNA, with oligo d(T)16 primer and iScript reverse transcriptase (Biorad, Hercules, CA), yielding 20 μl of cDNA. Real-time PCR utilizing a Biorad iCycler with Sybr Green (1× Sybr green master mix; Biorad, Hercules, CA) was performed using 2 mL of cDNA. All reactions were performed in duplicate with a negative water control and a standard curve with over 95% efficiency. Actin and 18S rRNA were used as reference genes. The primer sequences were derived from murine sequences obtained from the National Center for Biotechnology Information (NCBI) and are listed in Table 1. mRNA was quantified relative to the reference gene (Bustin et al., 2009) with results normalized to fed WT mRNA value.
Table 1.
Primer sequences for mRNA reverse-transcription qPCR.
| Gene | Forward sequence (5′–3′) | Reverse sequence (5′–3′) |
|---|---|---|
| Actin | ATGGATGACGATATCGCTGCGCTGGTCGTCGACAA | CTAGAAGCACTTGCGGTGCACGATGGAGGGGCCG |
| 18S | CGATCCGAGGGCCTCACTA | AGTCCCTGCCCTTTGTACACA |
| Pepck | ATCATCTTTGGTGGCCGTAG | TGATGATCTTGCCCTTGTGT |
| PPARα | TCTGGAAGCTTTGGTTTTGC | TTCGACACTCGATGTTCAGG |
| PGC-1a | GCATGAGTGTGTGCTGTGTG | TCAGGAAGATCTGGGCAAAG |
| FGF-21 | ACCTGGAGATCAGGGAGGAT | CACCCAGGATTTGAATGACC |
| SREBP-1c | GAACTGGACACAGCGGTTTT | GTTGTTGATGAGCTGGAGCA |
2.6. Biochemical assays
Glycogen
Liver glycogen content was determined by the colorimetric assay according to Lo et al. (1970). Small liver sections were weighed and solubilized in 30% KOH in a boiling bath for 20–30 min. 95% ethanol was used to precipitate the glycogen pellet. After cold centrifugation at 7500 × g for 30 min, the pellet was dissolved in water. An aliquot was mixed with 5% phenol and 98% sulfuric acid solutions. Absorbance was measured at 490 μm in triplicate. The standard curve was generated from serial dilution of a 5 mg/mL glycogen solution. Blank solution was prepared by using water instead of glycogen.
Free fatty acids were measured by ELISA by the Specialized Assay Core, Joslin Diabetes Center, Boston, MA. For hepatic triglyceride analysis (Sutherland and Rall, 1958), liver sections were weighed and homogenized in chloroform/methanol. The samples were then centrifuged at 10,000 × g at 4 °C and the lower layer collected, dried and dissolved in isopropanol/Triton X Bligh and Dyer (1959). Liver triglyceride content was determined by the enzymatic hydrolysis method (Sigma, Saint Louis, MO).
2.7. Lipid staining
Liver sections were placed in OCT (Sakura, Torrance, CA) and immediately frozen on dry ice and stored at −80 °C. Thin sections (5 μm) were stained with Oil-Red-O.
2.8. Western blot
Mouse liver was homogenized in tissue lysis buffer (50 mM Tris, pH 7.5; 150 mM NaCl; 100 mM NaF; 10 mM Na4P2O7; 1 mM Na3VO4; 1% Nonidet P-40; 2 mM EGTA; 10 μg/mL aprotinin; 10 μg/mL leupeptin; 20 nM okadaic acid) and centrifuged at 13,200 rpm, 4 °C for 20 min. Tissue extracts were mixed with Laemmli Buffer and boiled at 100 °C for 5 min. Sixty micrograms of protein for each sample was loaded for SDS-PAGE and electro-transferred onto PVDF membrane (Millipore, Billerica, MA). After blocking in 10% blocking buffer (Roche, Indianapolis, IN) at room temperature for 1 h, membranes were incubated with primary antibody at 4 °C overnight and then with horseradish peroxidase-conjugated secondary antibody at room temperature for 1 h. The following antibodies and dilutions were used: anti-Atg5 at 1:1000 (Novus Biologicals, Littleton, CO); anti-Atg7 at 1:800 (Cell Signaling, Danvers, MA); anti-Actin at 1:1000 (Santa Cruz Biotechnologies, Santa Cruz, CA); Goat anti-rabbit or anti-mouse antibody at 1:5000 (Santa Cruz). Immunoblots were detected using the enhanced chemiluminescence assay (Roche, Indianapolis, IN). Densitometry with software Image J was used for protein quantification of immunoblots. For comparisons between fed and fasted states, the fed state Atg5 amount was normalized to 1. For comparisons between fasted WT and Pnmt −/− levels, WT fasted values were normalized to 1.
2.9. Data analysis
Analysis of variance (ANOVA, SAS 9.1, Cary, NC) was used to compare mean measurements between multiple groups (WT fed, WT fasted, Pnmt −/− fed and Pnmt −/− fasted). The Tukey procedure was used for post hoc pair-wise comparisons. The t test was used to compare the difference in both fed and fasting blood glucose levels between WT and Pnmt −/− mice. A p value of less than 0.05 was considered statistically significant. In all figures, *p < 0.05, **p < 0.01. All data are presented as the mean ± standard error of the mean. Only statistically significant means are noted in the figures.
3. Results
3.1. Epinephrine-deficient mice have a normal response to a glucose load and normal fasting glucose
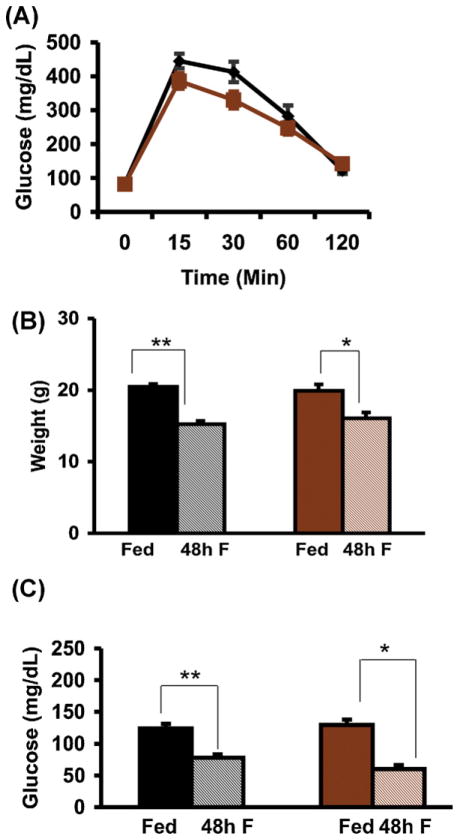
Wildtype (WT) and Pnmt −/− mice had similar baseline weights (Fig. 1B) and body fat percentages (12.1% and 13.3%, respectively) as determined by DEXA. WT mice were significantly shorter than Pnmt −/− mice (nose-to-anus length: 8.9 ± 0.1 cm vs. 9.3 ± 0.1 cm, p < 0.05). WT and Pnmt −/− mice had similar food intake when followed over a period of 12 weeks (data not shown). Mice in both groups had comparable glucose tolerance (Fig. 1A).
Fig. 1.
Glucose and weight responses to fasting in Pnmt −/− mice. (A) Glucose tolerance testing in WT (n = 11) and Pnmt −/− (n = 17) mice was not different between the two groups. Weight after 48 h (B) of fasting in WT (n = 5) and Pnmt −/− (n = 5) mice. There was no difference in pre- or post-fasting weights between the two groups. Plasma glucose levels fell significantly after 48 h (C, n = 5) of fasting. Values are mean ± SEM. *p < 0.05; **p < 0.01. Black, WT; brown, Pnmt −/−; solid, fed; shaded, fasted. (For interpretation of the references to color in this figure legend, the reader is referred to the web version of this article.)
Following 48 h of fasting, all animals survived, and both WT and Pnmt −/− mice lost a similar degree of weight (Fig. 1B). However, Pnmt −/− mice lost 27% of their fat mass vs. 10% in WT mice (p < 0.05), suggesting that they sustained more active lipolysis despite epinephrine deficiency. After the 48 h of fasting, Pnmt −/− and WT mice became hypoglycemic to a similar extent (Fig. 1C). Insulin, which was already low in WT and Pnmt −/− fed mice (obtained at 08:00 h), did not decrease further with 48 h of fasting (Fig. 2A). Glucagon levels tended to rise in the fasted WT group and to fall in the fasted Pnmt −/− group (Fig. 2B), such that in the absence of epinephrine, the insulin/glucagon ratio after 48 h of fasting was lower in WT mice (2.3 ± 0.3) compared with that in Pnmt −/− mice (6.4 ± 1.5), p = 0.03.
Fig. 2.
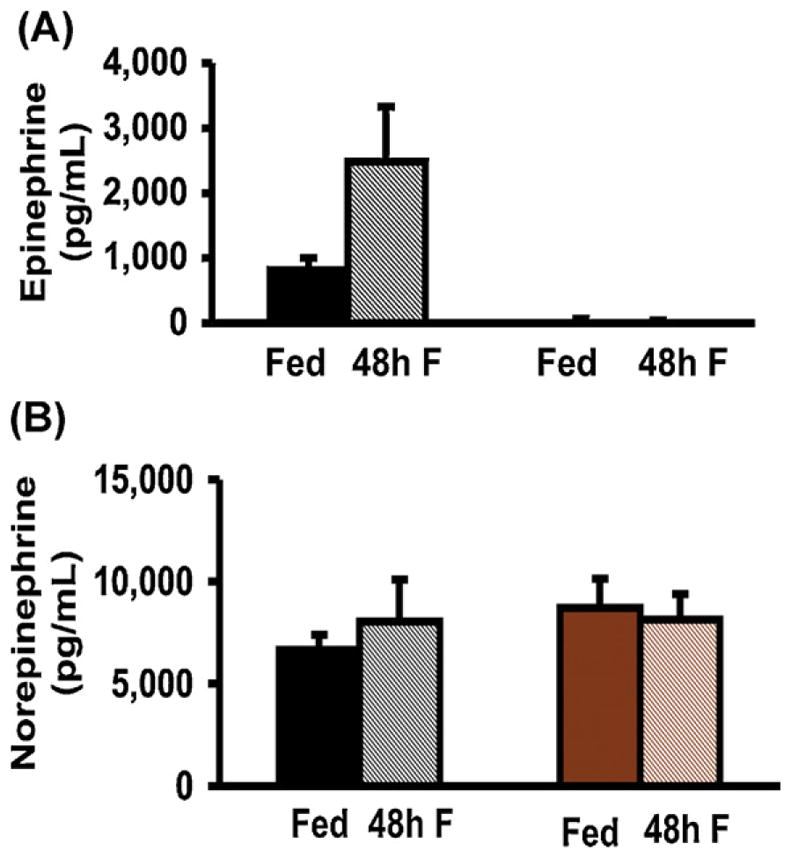
Hormonal responses to 48 h of fasting in Pnmt −/− mice. (A) Insulin levels after 48 h of fasting tended to decrease in WT mice and to increase in Pnmt −/− mice (n = 6 and n = 15 respectively). (B) Glucagon levels tended to increase after 48 h of fasting in WT mice but tended to decrease in Pnmt −/− mice (n = 6 and n = 15 respectively). (C) Plasma epinephrine levels tended to increase after 48 h of fasting in WT mice (n = 6) but were undetectable in Pnmt −/− mice (n = 15). (D) Plasma norepinephrine levels before and after 48 h of fasting in WT (n = 6) and Pnmt −/−(n = 15) mice were not different in either group with fasting. *p < 0.05; **p < 0.01. Color legend as in Fig. 1. (For interpretation of the references to color in this figure legend, the reader is referred to the web version of this article.)
3.2. Pnmt −/− mice have undetectable epinephrine with fasting
To confirm that deletion of Pnmt −/− results in no inducible epinephrine secretion under the stress of starvation, plasma epinephrine levels were obtained. As expected in WT mice, plasma epinephrine levels tended to increase in the fasted compared to the fed state, whereas Pnmt −/− mice had virtually undetectable levels under both conditions (Fig. 2A). Norepinephrine levels were similar in all groups (Fig. 2B) suggesting that the stress of anesthesia and/or mode of sample collection resulted in the release of stored norepinephrine from the sympathetic nerve terminals irrespective of feeding state.
3.3. Epinephrine-deficient mice have enhanced glycogenolysis
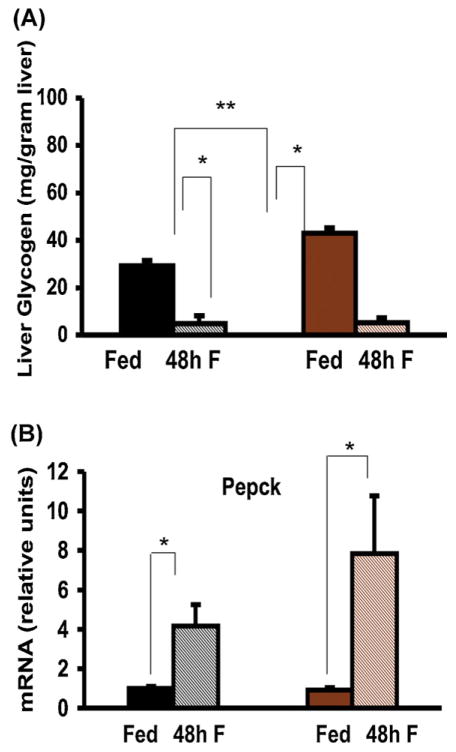
To evaluate the role of epinephrine in glycogenolysis during fasting, we measured hepatic glycogen content. In Pnmt −/− mice, fed glycogen content was significantly higher than in WT mice (43.07 ± 3.33 mg/g liver vs. 29.23 ± 2.33 mg/g liver, p = 0.009). In WT mice, glycogen decreased more than 5-fold after a 48-h fast (Fig. 3A). Despite epinephrine deficiency, 48 h of fasting stimulated brisk glycogenolysis in Pnmt −/− mice, as seen by the more than 10-fold decrease in hepatic glycogen content (Fig. 3A). The mRNA encoding phosphoenolpyruvate carboxykinase (Pepck), one of the major enzymes of gluconeogenesis, was similar in both fed genotypes, and significantly increased in both genotypes after 48 h of fasting (Fig. 3B).
Fig. 3.
Glycogenolysis and Pepck synthesis in fasted Pnmt −/− mice. Glycogen levels in the fed state are significantly higher in Pnmt −/− than in WT mice. (A) Hepatic glycogen level after 48 h of fasting decreased significantly in WT (n = 5) and Pnmt −/− (n = 5) mice. (B) Pepck mRNA levels after 48 h of fasting rose significantly in WT (n = 5) and Pnmt −/− (n = 5) groups. *p < 0.05; **p < 0.01. Color legend as in Fig. 1. (For interpretation of the references to color in this figure legend, the reader is referred to the web version of this article.)
3.4. Epinephrine-deficient mice have normal lipolysis and accelerated ketogenesis
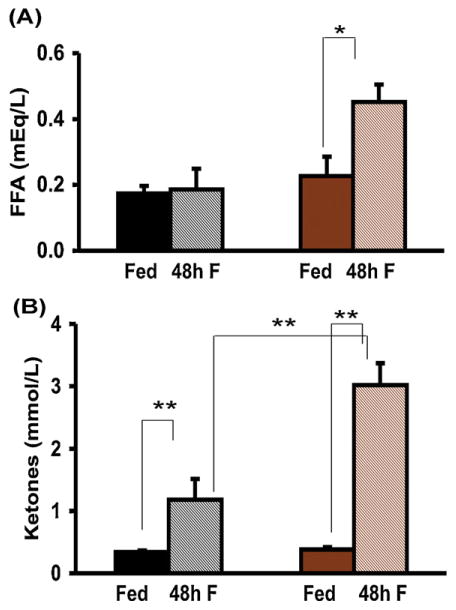
After the depletion of glycogen stores, the production of fatty acids, glycerol and ketones by lipolysis of fat normally ensues to maintain energy production during fasting. We hence determined plasma free fatty acid and ketone levels after 48 h of fasting. Free fatty acids were no different between the 2 fed groups. After 48 h of fasting, free fatty acid levels rose significantly in Pnmt −/− mice but did not change in WT mice (Fig. 4A). Plasma ketones increased in both genotypes after 48 h of fasting, but significantly more so in Pnmt −/− mice (Fig. 4B).
Fig. 4.
Lipolytic responses to fasting in Pnmt −/− mice. (A) Plasma FFA levels after 48 h of fasting in WT (n = 5) and Pnmt −/− (n = 5) mice increased significantly only in Pnmt −/− mice. (C) After 48 h of fasting, ketones rose significantly in both WT (n = 5) and Pnmt −/− (n = 5) mice and were significantly higher in fasted Pnmt −/− than WT mice. *p < 0.05; **p < 0.01. Color legend as in Fig. 1. (For interpretation of the references to color in this figure legend, the reader is referred to the web version of this article.)
3.5. Epinephrine is not required for induction of peroxisomal regulators during fasting
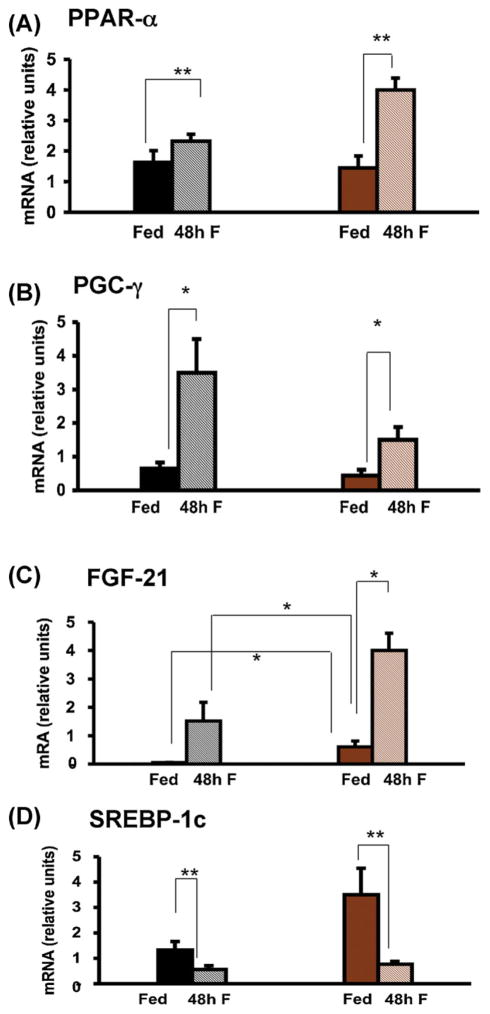
In order to further investigate the effects of epinephrine deficiency on fatty acid oxidation, we evaluated the regulation of several of the major components of this pathway: peroxisome proliferator activated receptor α (PPAR-α), peroxisome proliferator activated receptor γ coactivator α (PGC-1α), fibroblast growth factor 21 (FGF-21) and sterol regulatory element binding protein (SREBP-1c). PPAR-α mRNA levels were not different between fed WT and Pnmt −/− mice but rose significantly more in knockout mice fasted for 48 h (Fig. 5A). PGC-1α mRNA rose significantly and to the same extent in both genotypes after 48 h of fasting (Fig. 5B). FGF-21 mRNA was significantly higher in fed Pnmt −/− vs. WT mice increased significantly in Pnmt −/− mice after 48 h of fasting (Fig. 5C). SREBP-1c mRNA levels were not different between fed WT and Pnmt −/− mice, but decreased significantly in both genotypes after 48 h of fasting (Fig. 5D).
Fig. 5.
Hepatic gene expression responses to fasting in Pnmt −/− mice. Hepatic PPAR-α (A), PGC-1α (B), FGF-21 (C) and SREBP-1c (D) mRNA content after 48 h of fasting in WT and Pnmt −/− mice. PPAR-α mRNA levels but increased significantly after 48 h of fasting (A) in Pnmt −/− mice (n = 5) and were significantly higher than mRNA levels in WT mice. PGC-1α mRNA levels were significantly higher after 48 h of fasting (B) in both genotypes (n = 5 for each group). (C) After 48 h of fasting FGF-21 mRNA levels tended to increase in WT mice but increased significantly in Pnmt −/− mice (n = 15 and 5, respectively) and were significantly higher than fasted WT FGF-21 mRNA levels. (D) After 48 h of fasting, SREBP-1c decreased significantly in both genotypes (n = 5 for both genotypes). *p < 0.05; **p < 0.01. Color legend as in Fig. 1. (For interpretation of the references to color in this figure legend, the reader is referred to the web version of this article.)
3.6. Epinephrine deficiency results in severe hepatic steatosis with fasting
To evaluate the hepatic disposition of lipid in WT and Pnmt −/− mice during the evolution of the fasting state, we examined hepatic triglyceride content after 24 of fasting, a time point halfway between the fed and 48 h fasted state (Fig. 5). In fed mice, Pnmt −/− animals had significantly greater triglyceride content than did WT mice (p < 0.005) (Fig. 5A). After 24 h of fasting, Pnmt −/− mice had significantly greater accumulation of hepatic triglycerides compared with WT mice (Fig. 5A). Direct histological examination and semiquantification of Oil-red-O staining confirmed that fasted Pnmt −/− mice sustained more severe hepatic steatosis that did WT mice (Fig. 5B and C).
3.7. Epinephrine is required for normal hepatic lipid trafficking and autophagy during fasting
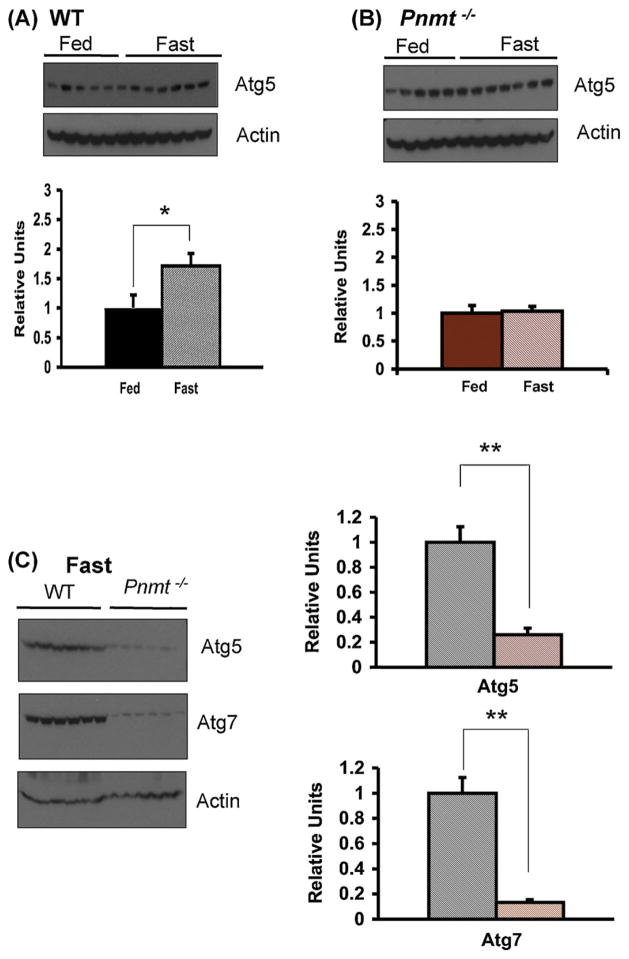
In order to evaluate the significantly greater degree of hepatic steatosis noted in the Pnmt −/− compared with WT mice after 24 h of fasting, we investigated the process of autophagy (Fig. 6). Autophagy is a cellular response to fasting in which a cell digests some of its own organelles, including lipid stores, for energy production in the setting of starvation (Levine and Kroemer, 2008). Autophagy is required for the hepatic disposition of lipid during fasting. We measured the hepatic content of Atg5 and Atg7 (Fig. 7), two of the autophagy related homologue proteins normally increased during the autophagic process (Levine and Kroemer, 2008). In WT mice, there was a significant increase in Atg5 levels with starvation (p < 0.05) (Fig. 7A) whereas in Pnmt −/− mice, Atg5 levels did not change (Fig. 7B). When 24 h fasted WT and Pnmt −/− mice were directly compared, Atg5 levels were four-fold lower, and Atg7 levels were seven-fold lower in the setting of epinephrine deficiency (Fig. 7C).
Fig. 6.
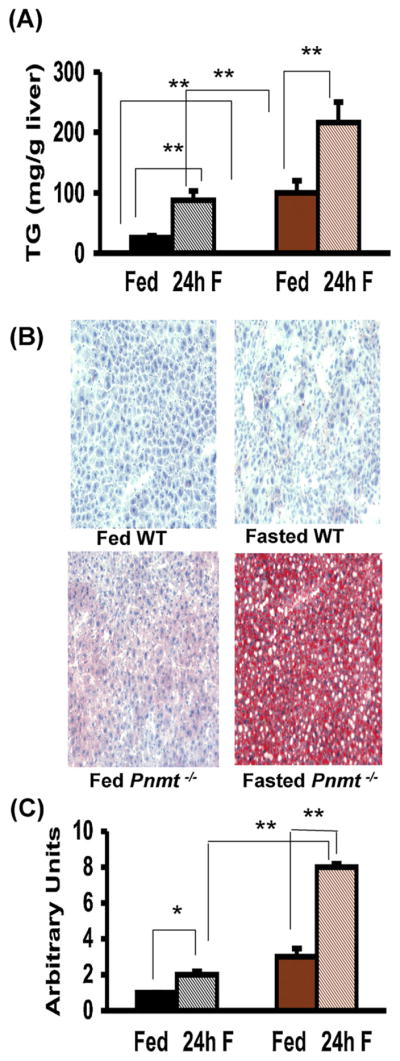
Hepatic triglyceride responses to fasting in Pnmt −/− mice. Hepatic triglycerides (TG) content after 24 h of fasting in WT and Pnmt −/− mice. There was a significant increase in hepatic TG content after a 24 h fast (A) in WT and Pnmt −/−(n = 6 and n = 15 respectively) mice. Pnmt −/− hepatic triglyceride content was significantly higher than WT both in fed and fasted states (A). (B) Fat staining of liver sections (20× magnification) in WT and Pnmt −/− mice in fed state and after 24 h of fasting. (C) Semiquantitative analysis of fat-stained liver sections after 24 h (WT n = 6, Pnmt −/− n = 15) of fasting. There was significantly more hepatic lipid staining at 24 h of fasting in WT and Pnmt −/− mice. There was significantly more lipid staining in fasting Pnmt −/− mice at 24 h compared to WT mice. *p < 0.05; **p < 0.01. Color legend as in Fig. 1. (For interpretation of the references to color in this figure legend, the reader is referred to the web version of this article.)
Fig. 7.
Autophagy in Pnmt −/− mice. Western blot of Atg5 in WT (A) and Pnmt −/− (B) mice without and with 24 h of fasting normalized to actin. There was a significant increase in Atg5 levels with fasting in WT mice (A). Atg5 levels in Pnmt −/− mice (B) were unchanged after fasting. (C) Western blot and quantification of Atg5 and Atg7 levels normalized to actin after 24 h of fasting in WT and Pnmt −/− mice. Fasted Atg5 and Atg7 levels in Pnmt −/− mice were respectively 4-fold and 8-fold lower than fasted WT levels. *p < 0.05; **p < 0.01. Color legend as in Fig. 1. (For interpretation of the references to color in this figure legend, the reader is referred to the web version of this article.)
4. Discussion
Our results show that epinephrine is not required for glucose counter-regulation in mice fasting for 48 h. Furthermore, epinephrine is not needed for hypoglycemia prevention, glycogenolysis, gluconeogenesis, ketosis, lipolysis and the induction of peroxisomal regulators during fasting. However, epinephrine deficiency results in severe hepatic steatosis with fasting. Epinephrine therefore has an essential role in hepatic triglyceride mobilization and lipid trafficking, likely by inducing the fasting autophagy response.
Glucose homeostasis requires an intact counter-regulatory system consisting of insulin, glucagon, epinephrine (from sympathetic adrenal medullary stimulation), corticosterone and growth hormone. Epinephrine has been thought to have a secondary role in metabolic regulation in the presence of an intact glucagon response (Cryer, 1993a,b). In humans, epinephrine infusion results in enhanced lipolysis and a rise in free fatty acids, glycerol and ketone levels independently of insulin and glucagon (Bahnsen et al., 1984), an effect blocked by propranolol (Rizza et al., 1980). Propranolol is a non-selective adrenergic antagonist that blocks the effect of both epinephrine and norepinephrine. Human subjects maintained normoglycemia during propranolol infusion and prolonged fast, signaling that catecholamines’ role in glucose counter-regulation after a prolonged fast is probably redundant (Boyle et al., 1989).
In our study, we asked whether epinephrine is essential for glucose counter-regulation, fatty acid oxidation and the adaptation to the fasting state in the setting of starvation for 24–48 h. We noted that Pnmt −/− mice are longer than WT mice and tend to have more adipose tissue despite similar food intake, suggesting that epinephrine may have a role in processes regulating metabolism and growth. In fact, Fto−/− mice, which have significantly higher levels of norepinephrine and epinephrine compared with WT litter-mates, exhibit growth retardation and decreased adiposity (Fischer et al., 2009).
The unanticipated insulin and glucagon responses seen in Pnmt −/− mice after 48 h of fasting, with a higher insulin/glucagon ratio in fasted Pnmt −/− mice, might be explained by the fact that epinephrine normally inhibits insulin release through its effects on α-2 adrenergic receptors and stimulates glucagon release through its effects on α-1 and β adrenergic receptors (Vieira et al., 2004). Despite this, fasted Pnmt −/− mice defended their blood sugar as well as did WT mice, suggesting that their glucose production and/or utilization were similar to those in WT mice. During fasting, amino acids break down and enter the citric acid cycle producing oxalacetate. Pepck is the enzyme that catalyzes the conversion of oxalacetate to phosphoenol pyruvate eventually producing glucose. The regulation of Pepck is likely glucocorticoid-dependent (Schoneveld et al., 2004). Indeed, liver glycogen breakdown and Pepck induction within 48 h of fasting were enhanced in Pnmt −/− mice, suggesting that the induction of glycogenolysis and gluconeogenesis is epinephrine-independent. Lipolysis and partial β-oxidation were also enhanced despite epinephrine deficiency, as demonstrated by elevated levels of free fatty acids and β-hydroxybutyrate in fasted Pnmt −/− mice at 48 h. Thus, epinephrine is not required for these processes. In fact, glycogenolysis, lipolysis and ketogenesis were much more pronounced in Pnmt −/− vs. WT mice after 48 h of fasting, as manifested by a more rapid depletion of glycogen stores, a more pronounced loss of fat mass, and much higher ketone and free fatty acid levels. The higher levels of fatty acids and ketones in fasted Pnmt −/− mice could be due to either excessive lipolysis or decreased uptake of fatty acids into the beta-oxidation pathway.
In our study, both genotypes had triglyceride deposition in the liver with fasting. Although WT mice are known to have mild lipid accumulation during fasting, probably due to deposition of lipid mobilized from peripheral stores (Chakravarthy et al., 2009), this was much more pronounced in Pnmt −/− mice. Excessive lipolysis could result in triglyceride deposition in the liver if mobilization exceeded the capacity of fatty acids to be oxidized, since these excess fatty acids would be re-esterified in the liver and deposited as triglycerides (Hashimoto et al., 2000).
To further investigate the possibility that fatty acid oxidation might have been incomplete in Pnmt −/− mice, we measured the levels of mRNAs encoding several proteins involved in this pathway: PPAR-α, PGC-1α, FGF-21 and SREBP-1c. These proteins respond to fasting and are paramount for mitochondrial oxidative phosphorylation (Lin, 2009). PPAR-α-null mice develop severe hepatic steatosis with fasting (Lee et al., 1995). Recently, a natural phosphatidylcholine ligand for PPAR-α, 16:0/18:1-GPC, has been identified (Chakravarthy et al., 2009). As catecholamines are needed for the synthesis of some phosphatidylcholines (Weismuller et al., 2004), it is intriguing to consider that epinephrine deficiency might cause hepatic steatosis by inhibiting the formation of 16:0/18:1-GPC and thus interfere with PPAR-α function. However, after 48 h of fasting, all these regulators responded normally (and were enhanced in the case of PPAR-α and FGF-21 mRNA levels after 48 h of fasting) in epinephrine-deficient mice, indicating that their regulation is independent of epinephrine. However, despite normal stimulation, the more pronounced ketosis and hepatic steatosis noted in Pnmt −/− mice with fasting suggest another defect in hepatic lipid metabolism.
Incomplete uptake of fatty acids into the beta-oxidation pathway could also be due to defective utilization of hepatic lipid via autophagy pathways (Singh et al., 2009) in fasted Pnmt −/− mice. Autophagy is an adaptive response to nutrient deprivation that generates alternate sources of energy via digestion of intracellular organelles and fuel stores including lipids (Levine and Kroemer, 2008; Hotchkiss et al., 2009; Singh et al., 2009). Atg5 and Atg7 are among the many proteins that regulate autophagy (Yang et al., 2010). Atg5 is present on the outer side of the autophagosome. It is an acceptor molecule for a ubiquitin-like modifier (Atg12) and it is required for the elongation of the isolation membrane (Mizushima and Klionsky, 2007). Atg7 encodes a ubiquitin-activating enzyme-like enzyme, and is central for Atg12–Atg5 conjugation and autophagosome formation (Yang et al., 2010). Atg5 and Atg7 are induced during fasting and regulate vesicle elongation, a key step in the autophagic process (Levine and Kroemer, 2008). Epinephrine was first suggested to induce hepatic autophagy over 35 years ago (Rosa, 1971), but this has been studied solely in the context of glycogenolysis (Kondomerkos et al., 2005). Recently, Yang et al. (2010) showed that Atg7 downregulation at the protein level resulted in defective autophagy and insulin sensitivity in obese mice. To investigate a role for epinephrine in fasting-induced autophagy, we measured hepatic Atg5 and Atg7 protein content in WT and Pnmt −/− mice during fasting. We found that in Pnmt −/− mice did not show the normal increase in Atg5 and Atg7 levels with fasting, consistent with the proposed role for epinephrine in the induction of autophagy and providing an explanation for the hepatic steatosis seen during the fasting state in Pnmt −/− mice. Steatosis was evaluated at 24 h, at which time autophagy peaks during fasting (Mizushima et al., 2008).
In conclusion, our results support prior studies that in mice, epinephrine is not required for normal glucose counter-regulation during chronic fasting of 48 h duration. In the setting of starvation, epinephrine is also not required for lipolysis, but may be important for efficient fatty acid oxidation. Finally, we show that epinephrine has an important role in lipid metabolism, and possibly in the induction of hepatic autophagy during starvation. The presented data could be important for human metabolism if epinephrine has the same role in fatty acid oxidation and in induction of hepatic autophagy during fasting. Hepatic steatosis has been reported in normal fasting men (Gan and Watts, 2008). Future studies are required to further elucidate the mechanism through which epinephrine regulates hepatic autophagy during fasting.
Acknowledgments
Funding
The research was supported by the Timothy Murphy Fund.
We thank Maria Joachim for providing help with sample collection and tissue harvesting, and the Rodent Histopathology Core Facility at the Dana Farber Cancer Institute, Harvard Medical School, Boston, MA for histological processing.
Footnotes
Conflict of interest
There is no conflict of interest that could be perceived as prejudicing the impartiality of the research reported.
Ethical approval
The Animal Care and Use Committee of Children’s Hospital Boston approved all animal experiments.
References
- Bahnsen M, Burrin JM, Johnston DG, Pernet A, Walker M, Alberti KG. Mechanisms of catecholamine effects on ketogenesis. Am J Physiol. 1984;247:E173–80. doi: 10.1152/ajpendo.1984.247.2.E173. [DOI] [PubMed] [Google Scholar]
- Bligh EG, Dyer WJ. A rapid method of total lipid extraction and purification. Can J Biochem Physiol. 1959;37:911–7. doi: 10.1139/o59-099. [DOI] [PubMed] [Google Scholar]
- Boyle PJ, Shah SD, Cryer PE. Insulin, glucagon, and catecholamines in prevention of hypoglycemia during fasting. Am J Physiol. 1989;256:E651–61. doi: 10.1152/ajpendo.1989.256.5.E651. [DOI] [PubMed] [Google Scholar]
- Brouha L, Cannon WB, Dill DB. Blood-sugar variations in normal and in sympathectomized dogs. J Physiol. 1939;95:431–8. doi: 10.1113/jphysiol.1939.sp003740. [DOI] [PMC free article] [PubMed] [Google Scholar]
- Bustin SA, Benes V, Garson JA, Hellemans J, Huggett J, Kubista M, et al. The MIQE guidelines: minimum information for publication of quantitative real-time PCR experiments. Clin Chem. 2009;55:611–22. doi: 10.1373/clinchem.2008.112797. [DOI] [PubMed] [Google Scholar]
- Cannon WB. Pharmacological injections and physiological inferences. Science. 1929;70:500–1. doi: 10.1126/science.70.1821.500-a. [DOI] [PubMed] [Google Scholar]
- Chakravarthy MV, Lodhi IJ, Yin L, Malapaka RR, Xu HE, Turk J, et al. Identification of a physiologically relevant endogenous ligand for PPARalpha in liver. Cell. 2009;138:476–88. doi: 10.1016/j.cell.2009.05.036. [DOI] [PMC free article] [PubMed] [Google Scholar]
- Cryer PE, Tse TF, Clutter WE, Shah SD. Roles of glucagon and epinephrine in hypoglycemic and nonhypoglycemic glucose counterregulation in humans. Am J Physiol. 1984;247:E198–205. doi: 10.1152/ajpendo.1984.247.2.E198. [DOI] [PubMed] [Google Scholar]
- Cryer PE. Glucose counterregulation: prevention and correction of hypoglycemia in humans. Am J Physiol. 1993a;264:E149–55. doi: 10.1152/ajpendo.1993.264.2.E149. [DOI] [PubMed] [Google Scholar]
- Cryer PE. Adrenaline: a physiological metabolic regulatory hormone in humans? Int J Obes Relat Metab Disord. 1993b;17(Suppl 3):S43–6. discussion S68. [PubMed] [Google Scholar]
- De Feo P, Perriello G, Torlone E, Fanelli C, Ventura MM, Santeusanio F, et al. Contribution of adrenergic mechanisms to glucose counterregulation in humans. Am J Physiol. 1991;261:E725–36. doi: 10.1152/ajpendo.1991.261.6.E725. [DOI] [PubMed] [Google Scholar]
- Deter RL, De Duve C. Influence of glucagon, an inducer of cellular autophagy, on some physical properties of rat liver lysosomes. J Cell Biol. 1967;33:437–49. doi: 10.1083/jcb.33.2.437. [DOI] [PMC free article] [PubMed] [Google Scholar]
- Deter RL, Baudhuin P, De Duve C. Participation of lysosomes in cellular autophagy induced in rat liver by glucagons. J Cell Biol. 1967;35:C11–6. doi: 10.1083/jcb.35.2.c11. [DOI] [PMC free article] [PubMed] [Google Scholar]
- Duner H. Influence of the blood glucose-level on the secretion of adrenalin and noradrenalin from the suprarenal medulla. Nature. 1953;171:481–2. doi: 10.1038/171481b0. [DOI] [PubMed] [Google Scholar]
- Ebert SN, Rong Q, Boe S, Thompson RP, Grinberg A, Pfeifer K. Targeted insertion of the Cre-recombinase gene at the phenylethanolamine n-methyltransferase locus: a new model for studying the developmental distribution of adrenergic cells. Dev Dyn. 2004;231:849–58. doi: 10.1002/dvdy.20188. [DOI] [PubMed] [Google Scholar]
- Fischer J, Koch L, Emmerling C, Vierkotten J, Peters T, Bruning JC, et al. Inactivation of the Fto gene protects from obesity. Nature. 2009;458(7240):894–8. doi: 10.1038/nature07848. [DOI] [PubMed] [Google Scholar]
- Gan SK, Watts GF. Is adipose tissue lipolysis always an adaptive response to starvation?: implications for non-alcoholic fatty liver disease. Clin Sci. 2008;114:543–5. doi: 10.1042/CS20070461. [DOI] [PubMed] [Google Scholar]
- Goldstein DS, Stull R, Zimlichman R, Levinson PD, Smith H, Keiser HR. Simultaneous measurement of DOPA, DOPAC, and catecholamines in plasma by liquid chromatography with electrochemical detection. Clin Chem. 1984;30:815–6. [PubMed] [Google Scholar]
- Hashimoto T, Cook WS, Qi C, Yeldandi AV, Reddy JK, Rao MS. Defect in peroxisome proliferator-activated receptor alpha-inducible fatty acid oxidation determines the severity of hepatic steatosis in response to fasting. J Biol Chem. 2000;275:28918–28. doi: 10.1074/jbc.M910350199. [DOI] [PubMed] [Google Scholar]
- Hotchkiss RS, Strasser A, McDunn JE, Swanson PE. Cell death. NEJM. 2009;361:1570–83. doi: 10.1056/NEJMra0901217. [DOI] [PMC free article] [PubMed] [Google Scholar]
- Kondomerkos DJ, Kalamidas SA, Kotoulas OB, Han AC. Glycogen autophagy in the liver and heart of newborn rats. The effects of glucagon, adrenalin or rapamycin. Histol Histopathol. 2005;20:689–96. doi: 10.14670/HH-20.689. [DOI] [PubMed] [Google Scholar]
- Kulkarni RN, Holzenberger M, Shih DQ, Ozcan U, Stoffel M, Magnuson MA, et al. Beta-cell-specific deletion of the Igf1 receptor leads to hyperinsulinemia and glucose intolerance but does not alter beta-cell mass. Nat Genet. 2002;31:111–5. doi: 10.1038/ng872. [DOI] [PubMed] [Google Scholar]
- Lee SS, Pineau T, Drago J, Lee EJ, Owens JW, Kroetz DL, et al. Targeted disruption of the alpha isoform of the peroxisome proliferator-activated receptor gene in mice results in abolishment of the pleiotropic effects of peroxisome proliferators. Mol Cell Biol. 1995;15:3012–22. doi: 10.1128/mcb.15.6.3012. [DOI] [PMC free article] [PubMed] [Google Scholar]
- Levine B, Kroemer G. Autophagy in the pathogenesis of disease. Cell. 2008;132:27–42. doi: 10.1016/j.cell.2007.12.018. [DOI] [PMC free article] [PubMed] [Google Scholar]
- Lin J. Minireview: the PGC-1 coactivator networks: chromatin-remodeling and mitochondrial energy metabolism. Mol Endocrinol. 2009;23:2–10. doi: 10.1210/me.2008-0344. [DOI] [PMC free article] [PubMed] [Google Scholar]
- Lo S, Russell JC, Taylor AW. Determination of glycogen in small tissue samples. J Appl Physiol. 1970;28:234–6. doi: 10.1152/jappl.1970.28.2.234. [DOI] [PubMed] [Google Scholar]
- Michael MD, Kulkarni RN, Postic C, Previs SF, Shulman GI, Magnuson MA, et al. Loss of insulin signaling in hepatocytes leads to severe insulin resistance and progressive hepatic dysfunction. Mol Cell. 2000;6:87–97. [PubMed] [Google Scholar]
- Mitrakou A, Ryan C, Veneman T, Mokan M, Jenssen T, Kiss I, et al. Hierarchy of glycemic thresholds for counterregulatory hormone secretion, symptoms, and cerebral dysfunction. Am J Physiol. 1991;260:E67–74. doi: 10.1152/ajpendo.1991.260.1.E67. [DOI] [PubMed] [Google Scholar]
- Mizushima N, Klionsky D. Protein turnover via autophagy: implications for metabolism. Annu Rev Nutr. 2007;27:19–40. doi: 10.1146/annurev.nutr.27.061406.093749. [DOI] [PubMed] [Google Scholar]
- Mizushima N, Levine B, Cuervo AM, Klionsky DJ. Autophagy fights disease through cellular self-digestion. Nature. 2008;451:1069–75. doi: 10.1038/nature06639. [DOI] [PMC free article] [PubMed] [Google Scholar]
- Rizza RA, Cryer PE, Haymond MW, Gerich JE. Adrenergic mechanisms for the effects of epinephrine on glucose production and clearance in man. J Clin Invest. 1980;65:682–9. doi: 10.1172/JCI109714. [DOI] [PMC free article] [PubMed] [Google Scholar]
- Rosa F. Ultrastructural changes produced by glucagon, cyclic 3′5′-AMP and epinephrine on perfused rat livers. J Ultrastruct Res. 1971;34:205–13. doi: 10.1016/s0022-5320(71)80068-0. [DOI] [PubMed] [Google Scholar]
- Schoneveld OJ, Gaemers IC, Lamers WH. Mechanisms of glucocorticoid signaling. Biochim Biophys Acta. 2004;1680:114–28. doi: 10.1016/j.bbaexp.2004.09.004. [DOI] [PubMed] [Google Scholar]
- Schwartz NS, Clutter WE, Shah SD, Cryer PE. Glycemic thresholds for activation of glucose counterregulatory systems are higher than the threshold for symptoms. J Clin Invest. 1987;79:777–81. doi: 10.1172/JCI112884. [DOI] [PMC free article] [PubMed] [Google Scholar]
- Singh R, Kaushik S, Wang Y, Xiang Y, Novak I, Komatsu M, et al. Autophagy regulates lipid metabolism. Nature. 2009;458:1131–5. doi: 10.1038/nature07976. [DOI] [PMC free article] [PubMed] [Google Scholar]
- Sutherland EW, Rall TW. Fractionation and characterization of a cyclic adenine ribonucleotide formed by tissue particles. J Biol Chem. 1958;232:1077–91. [PubMed] [Google Scholar]
- Ueki K, Okada T, Hu J, Liew CW, Assmann A, Dahlgren GM, et al. Total insulin and IGF-I resistance in pancreatic beta cells causes overt diabetes. Nat Genet. 2006;38:583–8. doi: 10.1038/ng1787. [DOI] [PubMed] [Google Scholar]
- Vieira E, Liu YJ, Gylfe E. Involvement of alpha1 and beta-adrenoceptors in adrenaline stimulation of the glucagon-secreting mouse alpha-cell. Naunyn Schmiedebergs Arch Pharmacol. 2004;369:179–83. doi: 10.1007/s00210-003-0858-5. [DOI] [PubMed] [Google Scholar]
- Weismuller T, Klein J, Loffelholz K. Effects of norepinephrine and cardiotrophin-1 on phospholipase D activity and incorporation of myristic acid into phosphatidylcholine in rat heart. J Pharmacol Sci. 2004;95:335–40. doi: 10.1254/jphs.fpe04001x. [DOI] [PubMed] [Google Scholar]
- Yang L, Li P, FUS, Calay ES, Hotamisligil GS. Defective hepatic autophagy in obesity promotes ER stress and causes insulin resistance. Cell Metabol. 2010;11:467–78. doi: 10.1016/j.cmet.2010.04.005. [DOI] [PMC free article] [PubMed] [Google Scholar]


