

Abstract
Background
The health effects of suspended particulate matter (PM) may depend on its chemical composition. Associations between maternal exposure to chemical constituents of PM and newborn’s size have been little examined.
Objective
We aimed to investigate the associations of exposure to elemental constituents of PM with term low birth weight (LBW; weight < 2,500 g among births after 37 weeks of gestation), mean birth weight, and head circumference, relying on standardized fine-scale exposure assessment and with extensive control for potential confounders.
Methods
We pooled data from eight European cohorts comprising 34,923 singleton births in 1994–2008. Annual average concentrations of elemental constituents of PM ≤ 2.5 and ≤ 10 μm (PM2.5 and PM10) at maternal home addresses during pregnancy were estimated using land-use regression models. Adjusted associations between each birth measurement and concentrations of eight elements (copper, iron, potassium, nickel, sulfur, silicon, vanadium, and zinc) were calculated using random-effects regression on pooled data.
Results
A 200-ng/m3 increase in sulfur in PM2.5 was associated with an increased risk of LBW (adjusted odds ratio = 1.36; 95% confidence interval: 1.17, 1.58). Increased nickel and zinc in PM2.5 concentrations were also associated with an increased risk of LBW. Head circumference was reduced at higher exposure to all elements except potassium. All associations with sulfur were most robust to adjustment for PM2.5 mass concentration. All results were similar for PM10.
Conclusion
Sulfur, reflecting secondary combustion particles in this study, may adversely affect LBW and head circumference, independently of particle mass.
Citation
Pedersen M, Gehring U, Beelen R, Wang M, Giorgis-Allemand L, Andersen AM, Basagaña X, Bernard C, Cirach M, Forastiere F, de Hoogh K, Gražulevičienė R, Gruzieva O, Hoek G, Jedynska A, Klümper C, Kooter IM, Krämer U, Kukkonen J, Porta D, Postma DS, Raaschou-Nielsen O, van Rossem L, Sunyer J, Sørensen M, Tsai MY, Vrijkotte TG, Wilhelm M, Nieuwenhuijsen MJ, Pershagen G, Brunekreef B, Kogevinas M, Slama R. 2016. Elemental constituents of particulate matter and newborn’s size in eight European cohorts. Environ Health Perspect 124:141–150; http://dx.doi.org/10.1289/ehp.1409546
Introduction
Low birth weight (LBW; birth weight < 2,500 g) is a predictor of infant morbidity and mortality. The evidence for associations between exposure to airborne particulate matter (PM) and LBW is growing (Fleischer et al. 2014; Pedersen et al. 2013a; Stieb et al. 2012). Recent meta-analyses show heterogeneity across studies conducted in different areas (Dadvand et al. 2013; Sapkota et al. 2012; Stieb et al. 2012). Many of these studies have also examined continuous birth weight, and some point toward an association between PM and mean birth weight adjusted for gestational age (Pedersen et al. 2013a; Stieb et al. 2012).
PM is a complex mixture of solid matter and liquid droplets made up of a number of components, including elemental carbon, metals, organic chemicals, acids, and soil material, which vary in composition by place and time (Bell et al. 2007). The health effects of PM may depend on its origin and chemical composition (Kelly and Fussell 2012; Stanek et al. 2011).
Associations of the composition of PM with an aerodynamic diameter of ≤ 2.5 μm (PM2.5) with LBW and/or birth weight were investigated in four large study populations from the United States (Basu et al. 2014; Bell et al. 2010, 2012; Darrow et al. 2011; Ebisu and Bell 2012) with mixed findings for birth weight in particular. For example, nickel (Ni) has been found to be associated with a reduction in birth weight in two of these studies (Basu et al. 2014; Bell et al. 2010), but not in a third study (Ebisu and Bell 2012). Because the elemental composition of PM differs by location, studies of PM constituents and LBW in other study areas are warranted. Moreover, these previous studies relied on exposure estimates based on data from the nearest regulatory air quality monitor, which do not capture within-city exposure contrasts adequately, possibly resulting in misclassification of exposure and reduced risk estimates (Woodruff et al. 2009). None of these studies examined associations between particulate constituents and birth head circumference, which has been associated with cognitive ability (Heinonen et al. 2008) and may, as we have shown, be influenced by PM2.5 and PM with an aerodynamic diameter ≤ 10 μm (PM10) mass concentration (Pedersen et al. 2013a).
Recently, land use regression (LUR) models have also been developed for eight a priori selected elements in both PM2.5 and PM10 in 20 study areas across Europe (de Hoogh et al. 2013) where birth cohorts had been conducted (Pedersen et al. 2013a), providing the opportunity to study the impact of PM composition on offspring measurements at birth in European populations. A high content of PM in each of these elements is to some extent characteristic of a different source. For example, brake linings tend to increase copper (Cu) and iron (Fe) concentrations; tire wear, zinc (Zn); residual oil combustion associated with areas with shipping, oil heating, and/or sizable industries is associated with Ni and vanadium (V) concentrations; biomass burning with potassium (K); secondary combustion pollution in long-range transport with sulfur (S), and crustal materials with silicon (Si) (Viana et al. 2008).
In the present study, we estimated the impact of exposures to these eight PM constituents on term LBW, birth weight, and birth head circumference in a large European study population with standardized fine-scale exposure assessment and extensive control for potential confounders.
Methods
Study population. We pooled data from eight European mother–child cohorts conducted in areas where exposure to elemental composition of PM was assessed as part of the TRANSPHORM (Transport-related Air Pollution and Health impacts—Integrated Methodologies for Assessing Particulate Matter) project (de Hoogh et al. 2013): BAMSE–Sweden (Child, Allergy, Environment, Stockholm, Epidemiology; four centers close to Stockholm), DNBC–Denmark (Danish National Birth Cohort; Copenhagen), KANC–Lithuania (Kaunas neonatal cohort; Kaunas), ABCD (Amsterdam Born Children and their Development; Amsterdam), and PIAMA (Prevention and Incidence of Asthma and Mite Allergy; three centers)–the Netherlands, DUISBURG–Germany (Duisburg), GASPII–Italy (Gene and Environment: Prospective Study on Infancy in Italy; Rome), and INMA–Spain (INfancia y Medio Ambiente; Childhood and Environment; Sabadell). The cohorts, which were all part of the ESCAPE (European Study of Cohorts for Air Pollution Effects) project, have been previously described (Pedersen et al. 2013a). Four of the cohorts that were included in our previous study (Pedersen et al. 2013a)—namely MoBa (Norwegian Mother and Child Cohort Study)–Norway, Generation R–the Netherlands, APREG–Hungary (Air pollution and Pregnancy outcomes), and Rhea–Greece—were not included in the present analysis because exposure modeling and/or exposure assignment to the participants’ addresses was not performed in these study areas.
The study population included 34,923 singleton deliveries between 1994 and 2008. Detailed information on individual characteristics was obtained through interviews of the mother and self-administrated questionnaires during the pregnancy in most cohorts. Data from each cohort were harmonized and pooled centrally. Further information on the study design and the specific eligibility criteria applied in the baseline cohorts for the participation of mothers is summarized in Supplemental Material, Table S1. Ethical approval was obtained from the ethics committee in each country. Written informed consent was obtained from all participating women.
Birth outcomes. We defined term LBW among births occurring after 37 weeks of gestation as weight < 2,500 g. We also studied mean birth weight among term births and birth head circumference among all births as in our previous study (Pedersen et al. 2013a). Gestational age, birth weight, birth head circumference, sex, and mode of delivery were obtained from birth records or, for the PIAMA cohort, parental reports.
Gestational age (weeks) was defined as the interval between the start of the last menstrual period and delivery when possible (53% of births) (Slama et al. 2008). Ultrasound-based estimation (10%) was used only if last menstrual period was unavailable; when this was not possible, we used the estimates from the obstetrician (37%), which is usually ultrasound based.
Air pollution exposure assessment. We estimated exposure to PM elements in two size fractions (PM2.5 and PM10), using standardized methods developed within the ESCAPE and TRANSPHORM projects and relying on a LUR approach (de Hoogh et al. 2013).
Briefly, PM2.5 and PM10 concentrations in outdoor air were measured during three 2-week periods in summer, winter, and an intermediate season within 1 year at multiple sites (20–40) within each study area. Sites were selected to represent spatial variation of air pollution in the residential areas of the participants. Measurements were performed during 2008–2011 (see Supplemental Material, Table S1). PM2.5 and PM10 filters were weighed before and after each measurement centrally at IRAS (Institute for Risk Assessment Sciences), Utrecht University, and were then sent to Cooper Environmental Services (Portland, OR, USA) to detect elements. All filters were analyzed for elemental composition using X-ray Fluorescence (XRF) (de Hoogh et al. 2013). The three measurements were then averaged, adjusting for temporal trends using data from a continuous reference site (de Hoogh et al. 2013). The selected elements had a high percentage of well-detected samples, and a good precision of measurements (de Hoogh et al. 2013).
Annual mean concentrations of ambient elemental concentrations, PM2.5, and PM10 were estimated at the maternal home addresses during pregnancy with area-specific LUR models (de Hoogh et al. 2013; Eeftens et al. 2012). If no significant predictors could be included in a LUR model, we did not estimate cohort exposures, because the center-specific estimates would be the same for all cohort members from the area. For this reason, there were no Fe PM25, K PM10, Ni PM2.5, S PM2.5, S PM10, or Zn PM2.5 exposures estimated for the participants from the KANC cohort; K PM2.5 could not be estimated for the DUISBURG cohort, and Ni PM2.5 was missing for the BAMSE cohort. Because of lack of elemental data from routine monitoring stations in the study areas, we were unable to back-extrapolate the annual average elemental concentrations estimated by the LUR models to the time period of each individual pregnancy. Data from routine monitoring stations were used to temporally adjust the annual PM2.5 and PM10 LUR estimates to the periods corresponding to each individual pregnancy (Pedersen et al. 2013a). We accounted for changes of home address during pregnancy when the date of moving was known and mass concentration estimates was available at the new address.
Statistical analysis. We followed the same analysis plan as in our previous study (Pedersen et al. 2013a). Pooled analyses were conducted using mixed models including a random effect for center. Odds ratios (ORs) with 95% confidence intervals (CIs) for associations between exposure to air pollution and term LBW were estimated for fixed exposure increments using logistic regression models (i.e., xtlogit function in Stata S.E. version 12.1; StataCorp, College Station, TX, USA). Linear regression models were used for birth weight (grams) and birth head circumference (centimeters; xtmixed function).
Crude and adjusted models were examined. Adjustment variables were selected a priori; these were gestational age (weeks, continuous and quadratic terms), sex, parity (0, 1, ≥ 2), maternal height (centimeters), prepregnancy weight (broken stick model with a knot at 60 kg), mean number of cigarettes smoked during second trimester of gestation (cigarettes/day), maternal age (years), maternal education (cohort-specific definition of low, middle, high), and season of conception (January–March, April–June, July–September, October–December).
Each exposure variable was entered separately as a continuous variable in regression models.
Because of the correlations between some elemental constituents and particle mass, associations with elements may be biased and instead reflect relationships with particle mass. We therefore also performed analyses with two-pollutant models for each element adjusted for particle mass (PM2.5, PM10), other elements or traffic density on nearest street (vehicles per day), separately. We used variance inflation factors (VIF) diagnostics to assess collinearity problems, low values of VIF (< 5) being considered to be indicative that collinearity concerns are minor. We report two-pollutant models for pairs of pollutants selected from the results of the one-pollutant models.
Sensitivity analyses included a) restriction to women who did not change home address during pregnancy (assuming that residential mobility could result in exposure misclassification); b) restriction to areas where exposure models had the highest predictive value (defined as a cross-validation R2 for the LUR exposure model above 0.6); c) restriction to women from cohorts other than the DNBC, which accounted for half of the overall study population; d) restriction to women who participated with one pregnancy only (n = 34,088); e) further adjustment for maternal nationality (native vs. other) and self-reported maternal exposure to secondhand smoke (SHS) during pregnancy (no, yes); f) analyses stratified on maternal nationality (defined as above), maternal age (< 25, 25–35, > 35 years), sex, parity (0, ≥ 1), maternal active smoking (no, yes), maternal education (low, middle, high), or season of conception, to examine potential effect measure modification; and finally, we repeated analyses on term LBW and birth weight for the smaller study population with information on birth head circumference.
We tested for the effect of meteorological factors (ambient temperature, humidity, and atmospheric pressure, averaged over the full pregnancy and each trimester) on the birth outcomes of interest to decide whether adjustment was warranted; both linear and restricted cubic spline coding were considered. In sensitivity analyses, LBW and birth weight models were additionally adjusted for atmospheric pressure averaged over the full pregnancy, and head circumference was adjusted for average temperature (both fitted as a restricted cubic spline); we did not adjust for other meteorological factors because there were no evidence of associations (p > 0.05) between these factors and the outcomes assessed in the present study population.
We created exposure variables to estimate between-center and within-center exposure effects (Jerrett et al. 2008). To determine whether exposures could be assessed at the individual level across the entire range, we tested for significant differences between the estimated effects of center-aggregated means (referred to as between-center effects) and the estimated effects of the individually assigned exposures deviated from those center means (within-center effects).
Finally, we applied a false discovery rate (FDR) correction to correct for multiple testing (Benjamini and Yekutieli 2001) and chose an alpha level of 5% (two-sided) to define statistical significance.
Results
Air pollution exposure was estimated for 34,923 mother–child pairs from eight cohorts in seven European countries (Table 1). Demographic and other characteristics are given in Table 1; see also Supplemental Material, Figure S1. Most of the participating women were born in the country of the cohort in which they participated (ranging from 100% in DNBC to 62.2% in ABCD). The prevalence of term LBW was 1.2%, mean birth weight was 3,531 g, and mean head circumference was 40.0 cm.
Table 1.
Study population characteristics (total N = 34,923).
| Variable | n (%) | Mean ± SD |
|---|---|---|
| Country, city, cohort | ||
| Sweden, Stockholm, BAMSE | 3,860 (11.1) | |
| Denmark, Copenhagen, DNBC | 17,550 (50.3) | |
| Lithuania, Kaunas, KANC | 633 (1.8) | |
| The Netherlands, Amsterdam, ABCD; multiple sites, PIAMA | 11,430 (32.7) | |
| Germany, Duisburg, DUISBURG | 194 (0.6) | |
| Italy, Rome, GASPII | 684 (2.0) | |
| Spain, Sabadell, INMA | 572 (1.6) | |
| Maternal nationality (n = 34,030)a | ||
| Born in country of cohort | 30,491 (89.6) | |
| Born elsewhere | 3,539 (10.4) | |
| Maternal age (years, n = 34,905) | 30.4 ± 4.5 | |
| Maternal education (n = 33,719) | ||
| Low | 6,609 (19.6) | |
| Middle | 15,336 (45.5) | |
| High | 11,774 (34.9) | |
| Parity (n = 34,874) | ||
| No children | 18,074 (51.8) | |
| 1 child | 12,520 (35.9) | |
| ≥ 2 children | 4,280 (12.3) | |
| Maternal prepregnancy weight (kg; n = 33,822) | 65.2 ± 11.5 | |
| Maternal height (cm; n = 34,334) | 168.5 ± 6.6 | |
| Maternal smoking during 2nd trimester (n = 34,895) | ||
| No | 29,689 (85.1) | |
| Yes | 5,206 (14.9) | |
| No. of cigarettes per day among smokers (n = 5,206) | 7.2 ± 5.3 | |
| Exposure to secondhand smoke (n = 30,900) | ||
| No | 16,460 (53.3) | |
| Yes | 14,440 (46.7) | |
| Moved residence during pregnancy (n = 34,868) | ||
| No | 29,357 (84.2) | |
| Yes | 5,511 (15.8) | |
| Season of conception | ||
| January–March | 7,612 (21.8) | |
| April–June | 7,265 (20.8) | |
| July–September | 9,477 (27.1) | |
| October–December | 10,569 (30.3) | |
| Gestational ambient temperature (°C; n = 34,277) | 9.0 ± 2.6 | |
| Gestational ambient humidity (%) | 78.0 ± 4.1 | |
| Gestational atmospheric pressure (mBar; n = 34,290)b | 1,010 ± 6 | |
| Sex | ||
| Boy | 17,752 (50.8) | |
| Girl | 17,171 (49.2) | |
| Birth weight (g) among term births (> 37 weeks; n = 33,416) | 3,531 ± 550 | |
| Term low birth weight (< 2,500 g in term births) | 409 (1.2) | |
| Birth head circumference (cm; n = 23,840)c | 35.2 ± 1.7 | |
| Gestational age (weeks; n = 33,416) | 40.0 ± 1.8 | |
| < 37 weeks | 1,507 (4.3) | |
| aTotal in specific variables may be < 34,923 because of missing values. Of the women, 2.4% who participated had more than one pregnancy. bNot available from KANC. cNot available from all and from KANC, ABCD, and DUISBURG. | ||
Exposure levels. Air pollution pregnancy exposure levels were on average 17.0 μg/m3 for PM2.5 and 26.9 μg/m3 for PM10 (Table 2; see also Supplemental Material, Figure S1). Distributions of estimated particle constituents varied between and within each cohort (Figure 1). The ratio of the between-center variance to within-center variance differed among the constituents, and for S in PM2.5 and PM10 the between/within area variance were 63 and 31, respectively (see Supplemental Material, Table S2). The highest concentrations and exposure gradients of Cu and Fe were observed for the Italian cohort (Figure 1). The Swedish and Danish cohorts were estimated to have the lowest mean exposure to S. As shown in Table 2, S, K, Fe, and Si contributed most to the mass of each particle mass fraction. Some elements were contained mainly in PM2.5 (S, Ni, V, Zn), others (Cu, Fe, Si) mainly in the coarse fraction (PM10–PM2.5). The eight selected elements represented 6% and 7% of the total mass of PM2.5 and PM10, respectively. Exposure to particle mass and particle constituents did not differ by maternal nationality (results not shown).
Table 2.
Particle constituent concentrations and correlations between the elemental and total mass concentrations.
| Exposure | PM2.5 | PM10 | ||||
|---|---|---|---|---|---|---|
| na | Mean ± SD | rb | n | Mean ± SD | rb | |
| Mass concentration (μg/m3) | 33,882 | 17.0 ± 4.7 | 33,882 | 26.9 ± 7.8 | ||
| Elemental concentration (ng/m3) | ||||||
| Copper (Cu) | 34,923 | 3.4 ± 2.1 | 0.43 | 34,923 | 14.0 ± 10.6 | 0.54 |
| Iron (Fe) | 34,290 | 104.0 ± 57.4 | 0.17 | 34,923 | 435.3 ± 276.0 | 0.59 |
| Potassium (K) | 34,096 | 116.7 ± 27.4 | 0.20 | 34,290 | 224.3 ± 72.2 | 0.31 |
| Nickel (Ni) | 30,430 | 1.6 ± 0.8 | 0.67 | 34,923 | 1.8 ± 1.2 | 0.71 |
| Sulfur (S) | 34,290 | 753.9 ± 129.5 | 0.84 | 34,290 | 858.1 ± 171.7 | 0.84 |
| Silicon (Si) | 34,923 | 83.1 ± 54.4 | 0.02 | 34,923 | 489.7 ± 338.1 | 0.27 |
| Vanadium (V) | 34,923 | 2.8 ± 1.2 | 0.62 | 34,923 | 3.4 ± 1.5 | 0.66 |
| Zinc (Zn) | 34,290 | 14.8 ± 4.9 | 0.60 | 34,923 | 25.1 ± 10.9 | 0.61 |
| aThe numbers of participants are smaller for particle mass concentrations than for elemental concentrations because particle mass concentrations are pregnancy averages, and in some cases the routine monitoring data used to back-extrapolate particle mass concentrations were missing. Particle constituents are annual averages, and the numbers differ among particle constituents because we could not estimate all exposures in each study area. bAll Pearson correlations had a p-value < 0.001. | ||||||
Figure 1.
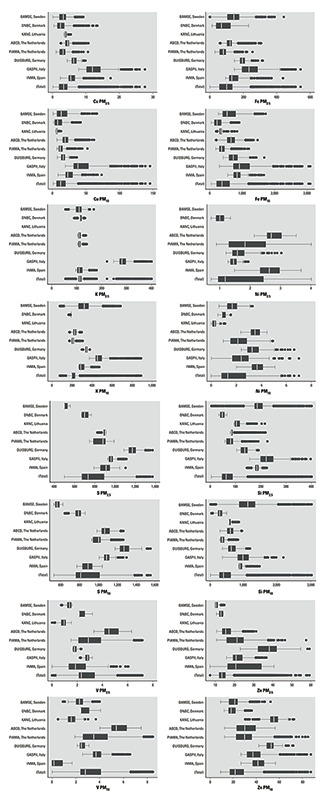
Distributions of exposure to PM constituents (ng/m3) by cohorts and for the pooled study population. Upper box plots for each element are for PM2.5 and the lower ones for PM10. The line in the middle of the box represents the median value, the ends of the box represent the 25th and 75th percentiles, and the whiskers indicate the variability outside the upper and lower quartiles (i.e., within 1.5 interquartile range of the lower quartile and upper quartile). Outliers are plotted as individual dots. Because no significant predictors could be included in the LUR models for a few study areas and pollutants, we were unable to estimate exposure to Fe PM25, K PM10, Ni PM2.5, S PM2.5, S PM10, and Zn PM2.5 for the participants from the KANC cohort; K PM2.5 was missing for the DUISBURG cohort; and Ni PM2.5 could not be estimated for the BAMSE cohort.
Particle mass concentrations were correlated with some elemental concentrations as shown in Table 2, the correlation being highest between particle mass and S, lowest between particle mass and Si.
The correlation coefficients between PM constituents varied from –0.001 to 0.97 (see Supplemental Material, Table S3). The correlations between elemental and particle mass concentrations varied between cohorts, and the within-area correlations between mass and elements were smaller in each individual cohort than in the pooled sample (see Supplemental Material, Table S4).
PM constituents and term low birth weight. Significant ORs of term LBW were estimated for particle mass, S, and Ni in the PM2.5 fraction, and for particle mass and S in PM10 (Table 3). In two-pollutant models, the association of LBW with S in PM2.5 (OR = 1.24; p = 0.10) was stronger than the association with PM2.5 mass concentration (OR = 1.08; p = 0.42). This was also the case for S in PM10 (OR for S = 1.27; 95% CI: 1.03, 1.56; p = 0.02 vs. OR for PM10 = 1.00; 95% CI: 0.80, 1.25; p = 0.99) and Ni in PM2.5 (OR for Ni = 1.11; 95% CI: 0.94, 1.31; p = 0.21 vs. OR for PM2.5 = 1.05; 95% CI: 0.88, 1.24; p = 0.61). All VIFs were < 5 in the presented two-pollutant models.
Table 3.
Adjusted associations between exposure to PM constituents and term LBW.
| Model | PM2.5 | PM10 | ||||
|---|---|---|---|---|---|---|
| Na | nb | OR (95% CI)c | Na | nb | OR (95% CI)c | |
| Single-pollutant models | ||||||
| Mass | 30,313 | 381 | 1.21 (1.08, 1.36) | 30,313 | 381 | 1.22 (1.03, 1.45) |
| Cu | 31,173 | 390 | 1.08 (0.81, 1.44) | 31,173 | 390 | 1.13 (0.92, 1.39) |
| Fe | 30,576 | 381 | 1.14 (0.92, 1.41) | 31,173 | 390 | 1.06 (0.83, 1.36) |
| K | 30,382 | 375 | 1.05 (0.82, 1.33) | 30,576 | 381 | 0.90 (0.73, 1.11) |
| Ni | 27,339 | 351 | 1.14 (1.00, 1.29) | 31,173 | 390 | 1.29 (0.96, 1.75) |
| S | 30,576 | 381 | 1.36 (1.17, 1.58) | 30,576 | 381 | 1.27 (1.13, 1.43) |
| Si | 31,173 | 390 | 0.83 (0.62, 1.12) | 31,173 | 390 | 0.89 (0.71, 1.13) |
| V | 31,173 | 390 | 1.12 (0.86, 1.44) | 31,173 | 390 | 1.00 (0.72, 1.38) |
| Zn | 30,576 | 381 | 1.23 (0.98, 1.54) | 31,173 | 390 | 1.23 (0.98, 1.53) |
| Two-pollutant models | ||||||
| S adjusted for mass | 29,716 | 372 | 1.24 (0.96, 1.61) | 29,716 | 372 | 1.27 (1.03, 1.56) |
| Mass adjusted for S | 29,716 | 372 | 1.08 (0.90, 1.30) | 29,716 | 372 | 1.00 (0.80, 1.25) |
| Ni adjusted for mass | 27,337 | 350 | 1.11 (0.94, 1.31) | 30,313 | 381 | 1.14 (0.90, 1.43) |
| Mass adjusted for Ni | 27,337 | 350 | 1.05 (0.88, 1.24) | 30,313 | 381 | 1.15 (0.97, 1.37) |
| Zn adjusted for mass | 29,716 | 372 | 1.11 (0.88, 1.40) | 30,313 | 381 | 1.13 (0.90, 1.42) |
| Mass adjusted for Zn | 29,716 | 372 | 1.19 (1.01, 1.40) | 30,313 | 381 | 1.17 (0.97, 1.42) |
| S adjusted for Ni | 27,339 | 351 | 1.08 (0.80, 1.46) | 30,576 | 381 | 1.10 (0.83, 1.44) |
| Ni adjusted for S | 27,339 | 351 | 1.10 (0.91, 1.33) | 30,576 | 381 | 1.07 (0.85, 1.35) |
| S adjusted for Zn | 30,576 | 381 | 1.39 (1.13, 1.70) | 30,576 | 381 | 1.26 (1.10, 1.45) |
| Zn adjusted for S | 30,576 | 381 | 0.96 (0.75, 1.23) | 30,576 | 381 | 1.02 (0.82, 1.27) |
| aThe number of subjects in each model. bThe number of term LBW cases in each model. cOdds ratio (OR) and 95% confidence interval (CIs) for LBW (< 2,500 g) among term births (≥ 37 weeks of gestation) from pooled analyses using logistic regression models with random effect of center adjusted for gestational age, sex, parity, maternal height, prepregnancy weight, maternal active smoking during 2nd trimester, maternal age, maternal education, and season of conception per increments of 5 μg/m3 for PM2.5 mass; 5 ng/m3 for Cu PM2.5; 100 ng/m3 for Fe PM2.5; 50 ng/m3 for K PM2.5; 1 ng/m3 for Ni PM2.5; 200 ng/m3 for S PM2.5; 100 ng/m3 for Si PM2.5; 2 ng/m3 for V PM2.5; 10 ng/m3 for Zn PM2.5; 10 μg/m3 for PM10; 5 ng/m3 for Cu PM2.5; 10 μg/m3 for PM10; 20 ng/m3 for Cu PM10; 500 ng/m3 for Fe PM10; 100 ng/m3 for K PM10; 2 ng/m3 for Ni PM10; 200 ng/m3 for S PM10; 500 ng/m3 for Si PM10; 3 ng/m3 for V PM10; and 20 ng/m3 for Zn PM10. | ||||||
Sensitivity analyses supported an association between S and LBW both for the PM2.5 and PM10 fractions (see Supplemental Material, Table S5). The ORs changed very little after exclusion of the DNBC, of women who moved, and of women who participated with more than one pregnancy, and after additional adjustment for nationality and SHS. Excluding areas in which the LUR exposure models had the lowest R2 attenuated associations, but OR remained elevated and significant for PM10. Stratified analyses showed that the adjusted ORs for S (PM2.5 and PM10) were somewhat higher for women born elsewhere than in the country of the cohort, women who smoked, and women who gave birth for the first time, but none of these differences were significant. No significant differences (interaction p > 0.05) were seen by maternal education level, sex, maternal age, and season of conception. There was no consistent pattern of PM components having greater effects in boys or in girls (see Supplemental Material, Table S6).
The ORs remained elevated and significant for S in both PM2.5 and PM10 after further adjustment for atmospheric pressure (see Supplemental Material, Table S7).
The ORs for the association of LBW with the overall exposure to Cu, Ni, S, V, and Zn in both PM2.5 and PM10 (Table 3) were similar to the ORs for the association with the between-center exposure, but larger than ORs for the association with the within-center exposure (see Supplemental Material, Table S8). However, estimates for overall and within-center exposures were not significantly different according to the Wald test of equality of coefficients. For particle mass, especially for PM2.5, the within-center and between-center ORs were similar.
PM constituents and mean birth weight. In the analysis with birth weight as a continuous outcome, only PM2.5 mass and PM2.5 S were significantly associated with reduced birth weight; here, too, the association with PM2.5 S was stronger than with PM2.5 mass concentration (Table 4). Further adjustment for atmospheric pressure did not change the associations for S in PM2.5 considerably (mean change in birth weight: –40 g vs. –47 g in models further adjusted for atmospheric pressure; see Supplemental Material, Table S9). Opposite to the findings for LBW, the change in birth weight associated with the between-center exposures to particle mass, Ni, S, and Zn in both PM2.5 and PM10 were statistically significantly larger than the change associated with within-center exposures (see Supplemental Material, Table S10). There was no consistent pattern of the PM components having greater effects on birth weight or head circumference in boys than in girls (see Supplemental Material, Table S11).
Table 4.
Adjusted associations between PM constituents and mean birth weight (g) in term births.
| Model | PM2.5 | PM10 | ||
|---|---|---|---|---|
| Na | β(95% CIs)b | Na | β(95% CIs)b | |
| Single-pollutant models | ||||
| Mass | 30,313 | –16 (–29, –3) | 30,313 | –11 (–25, 2) |
| Cu | 31,173 | 10 (–8, 27) | 31,173 | 8 (–4, 19) |
| Fe | 30,576 | 6 (–5, 16) | 31,173 | 14 (1, 28) |
| K | 30,382 | 11 (–11, 33) | 30,576 | 14 (2, 27) |
| Ni | 27,339 | 4 (–15, 22) | 31,173 | 1 (–22, 24) |
| S | 30,576 | –40 (–64, –16) | 30,576 | –2 (–21, 17) |
| Si | 31,173 | 26 (5, 48) | 31,173 | 13 (–1, 27) |
| V | 31,173 | 5 (–13, 23) | 31,173 | 13 (–8, 35) |
| Zn | 30,576 | –4 (–21, 12) | 31,173 | 8 (–6, 21) |
| Two-pollutant models | ||||
| S adjusted for mass | 29,716 | –35 (–64, –7) | 29,716 | 5 (–17, 27) |
| Mass adjusted for S | 29,716 | –6 (–22, 9) | 29,716 | –11 (–27, 5) |
| Ni adjusted for mass | 27,337 | 7 (–13, 26) | 30,313 | –6 (–33, 20) |
| Mass adjusted for Ni | 27,337 | –8 (–23, 7) | 30,313 | 7 (–26, 39) |
| Zn adjusted for mass | 29,716 | –1 (–18, 16) | 30,313 | 14 (–1, 29) |
| Mass adjusted for Zn | 29,716 | –13 (–27, 1) | 30,313 | –18 (–34, –2) |
| Fe adjusted for mass | 29,716 | 11 (–1, 22) | 30,313 | 33 (16, 51) |
| Mass adjusted for Fe | 29,716 | –19 (–34, –5) | 30,313 | –34 (–52, –16) |
| Si adjusted for mass | 30,313 | 36 (13, 60) | 30,313 | 31 (14, 49) |
| Mass adjusted for Si | 30,313 | –20 (–34, –7) | 30,313 | –29 (–45, –13) |
| K adjusted for mass | 29,522 | 12 (–11, 35) | 29,716 | 24 (9, 39) |
| Mass adjusted for K | 29,522 | –14 (–28, 1) | 29,716 | –21 (–37, –6) |
| Fe adjusted for S | 30,576 | 15 (4, 26) | 30,576 | 19 (5, 33) |
| S adjusted for Fe | 30,576 | –56 (–80, –32) | 30,576 | –15 (–35, 6) |
| Si adjusted for S | 30,576 | 33 (12, 54) | 30,576 | 16 (2, 30) |
| S adjusted for Si | 30,576 | –45 (–69, –22) | 30,576 | –11 (–30, 8) |
| K adjusted for S | 30,382 | 12 (–7, 30) | 30,576 | 15 (2, 27) |
| S adjusted for K | 30,382 | –62 (–85, –37) | 30,576 | –5 (–24, 14) |
| S adjusted for Ni | 27,339 | –17 (–50, 16) | 30,576 | –6 (–33, 20) |
| Ni adjusted for S | 27,339 | 7 (–50, 16) | 30,576 | 7 (–26, 39) |
| S adjusted for Zn | 30,576 | –43 (–69, –16) | 30,576 | –1 (–21, 19) |
| Zn adjusted for S | 30,576 | 4 (–14, 22) | 30,576 | –4 (–22, 13) |
| aThe number of subjects in each model. bChange in birth weight (in g) among term births (≥ 37 weeks of gestation) associated with exposure from pooled analyses using linear regression models with random effect of center. See Table 3 for adjustment factors. The following increments were used: 5 μg/m3 for PM2.5 mass; 5 ng/m3 for Cu PM2.5; 100 ng/m3 for Fe PM2.5; 50 ng/m3 for K PM2.5; 1 ng/m3 for Ni PM2.5; 200 ng/m3 for S PM2.5; 100 ng/m3 for Si PM2.5; 2 ng/m3 for V PM2.5; 10 ng/m3 for Zn PM2.5; 10 μg/m3 for PM10; 5 ng/m3 for Cu PM2.5; 10 μg/m3 for PM10; 20 ng/m3 for Cu PM10; 500 ng/m3 for Fe PM10; 100 ng/m3 for K PM10; 2 ng/m3 for Ni PM10; 200 ng/m3 for S PM10; 500 ng/m3 for Si PM10; 3 ng/m3 for V PM10; and 20 ng/m3 for Zn PM10. | ||||
PM constituents and birth head circumference. The correlation coefficient between birth weight and head circumference is 0.60 in full-term infants (n = 23,024), which means that indeed birth weight does not explain all the variation in head circumference. All pollutants but K (PM2.5 and PM10) were associated with significant reductions in birth head circumference (Table 5).
Table 5.
Adjusted associations between PM constituents and mean head circumference at birth (cm).
| Model | PM2.5 | PM10 | ||
|---|---|---|---|---|
| Na | βb (95% CIs) | Na | βb (95% CIs) | |
| Single-pollutant models | ||||
| Mass | 21,053 | –0.25 (–0.30, –0.19) | 21,053 | –0.24 (–0.29, –0.18) |
| Cu | 21,346 | –0.31 (–0.37, –0.24) | 21,346 | –0.16 (–0.20, –0.12) |
| Fe | 21,346 | –0.19 (–0.23, –0.16) | 21,346 | –0.18 (–0.24, –0.13) |
| K | 21,346 | 0.31 (0.23, 0.40) | 21,346 | 0.04 (0.00, 0.09) |
| Ni | 18,604 | –0.60 (–0.71, –0.49) | 21,346 | –0.46 (–0.57, –0.36) |
| S | 21,346 | –0.79 (–0.92, –0.66) | 21,346 | –0.56 (–0.66, –0.47) |
| Si | 21,346 | –0.18 (–0.26, –0.09) | 21,346 | –0.12 (–0.17, –0.06) |
| V | 21,346 | –0.46 (–0.57, –0.36) | 21,346 | –0.49 (–0.60, –0.37) |
| Zn | 21,346 | –0.14 (–0.22, –0.05) | 21,346 | –0.27 (–0.34, –0.19) |
| Two-pollutant models | ||||
| S adjusted for mass | 21,053 | –0.73 (–0.89, –0.57) | 21,053 | –0.51 (–0.63, –0.39) |
| Mass adjusted for S | 21,053 | –0.05 (–0.14, 0.02) | 21,923 | –0.05 (–0.13, 0.02) |
| Ni adjusted for mass | 18,602 | –0.49 (–0.61, –0.36) | 21,053 | –0.34 (–0.45, –0.22) |
| Mass adjusted for Ni | 18,602 | –0.14 (–0.22, –0.06) | 21,053 | –0.16 (–0.22, –0.10) |
| Zn adjusted for mass | 21,053 | 0.03 (–0.06, 0.12) | 21,053 | –0.09 (–0.19, 0.01) |
| Mass adjusted for Zn | 21,053 | –0.26 (–0.32, –0.19) | 21,053 | –0.20 (–0.27, –0.13) |
| S adjusted for Ni | 18,604 | –0.64 (–0.80, –0.47) | 21,346 | –0.53 (–0.65, –0.41) |
| Ni adjusted for S | 18,604 | –0.31 (–0.44, –0.19) | 21,346 | –0.05 (–0.20, 0.09) |
| S adjusted for Zn | 21,346 | –0.92 (–1.06, –0.77) | 21,346 | –0.55 (–0.65, –0.44) |
| Zn adjusted for S | 21,346 | 0.18 (0.08, 0.28) | 21,346 | –0.03 (–0.12, 0.06) |
| aThe number of subjects in each model. Birth head circumference is not available from KANC, ABCD, and DUISBURG. bChange in birth head circumference (cm) associated with exposure from pooled analyses using linear regression models with random effect of center adjusted for gestational age, sex, parity, maternal height, prepregnancy weight, maternal active smoking during 2nd trimester, maternal age, maternal education, season of conception, and pregnancy mean temperature. The following increments were used: 5 μg/m3 for PM2.5 mass; 5 ng/m3 for Cu PM2.5; 100 ng/m3 for Fe PM2.5; 50 ng/m3 for K PM2.5; 1 ng/m3 for Ni PM2.5; 200 ng/m3 for S PM2.5; 100 ng/m3 for Si PM2.5; 2 ng/m3 for V PM2.5; 10 ng/m3 for Zn PM2.5; 10 μg/m3 for PM10; 5 ng/m3 for Cu PM2.5; 10 μg/m3 for PM10; 20 ng/m3 for Cu PM10; 500 ng/m3 for Fe PM10; 100 ng/m3 for K PM10; 2 ng/m3 for Ni PM10; 200 ng/m3 for S PM10; 500 ng/m3 for Si PM10; 3 ng/m3 for V PM10; and 20 ng/m3 for Zn PM10. | ||||
In two-pollutant models for head circumference, the associations with S (in both PM2.5 and PM10) and Ni (PM2.5 only) were stronger than the associations with PM mass concentration. Also the association for Ni PM2.5 remained statistically significant in two-pollutant models after adjustment for S PM2.5. The association with Ni in PM10 was null after adjustment for S in PM10, whereas associations with S in PM10 and PM2.5 persisted after adjustment for Ni.
For all outcomes, the effects estimates of both S and Zn in PM2.5 do not change much after adjustment for traffic density (results not shown). Further adjustment for temperature and atmospheric pressure averaged during the full pregnancy did not change any of the associations (see Supplemental Material, Table S12). The effects of between- and within-center exposures on head circumference were significantly different for some but not all pollutants (see Supplemental Material, Table S13). For this outcome, the overall effects reflected more the effects of the within-center variations in exposures. The within-center effects on head circumference were significantly larger than the between-center effects for particle mass, Ni, S, and V in PM2.5 as well as S and V in PM10. For Zn, the between-center effects were stronger than the within-center effects. For K in PM2.5, there was a stronger positive association within-center.
The study population for head circumference analyses was smaller than the population for birth weight analyses (Table 1); in terms of S in PM2.5, the OR for term LBW in the full study population was 1.36 (95% CI: 1.17, 1.58), which was slightly smaller than the OR of 1.43 (95% CI: 1.14, 1.79) in the restricted study population with head circumference information. There was no difference in the associations of S in PM2.5 with birth weight (full population: –41 g; 95% CI: –69, –12 vs. restricted population: –40 g; 95% CI: –64, –16).
After we applied an FDR correction, the effects of Ni and Zn in PM2.5 lost their statistical significance for term LBW (FDR-corrected p-values, 0.35 and 0.55, respectively), but the effects of mass (PM2.5) and S (both PM fractions) remained significant. For birth weight, only the effect estimates of S in PM2.5 remained statistically significant, whereas for head circumference, all effects were significant, except for K in PM10 (results not shown).
Discussion
We examined associations of eight elemental constituents in PM2.5 and PM10 with newborn’s size in eight cohorts from seven European countries. S in both PM2.5 and PM10 and Ni in PM2.5 were associated with an increased risk of term LBW, reduced birth weight, and smaller birth head circumference. The association between S and LBW was robust to adjustment for co-pollutants including particle mass as well as FDR correction. The particle mass effect estimates were reduced and became statistically nonsignificant after adjustment for S.
S in PM2.5 has been associated with increased ORs for LBW in two studies from the United States (Basu et al. 2014; Bell et al. 2010). The estimated 36% increase in LBW at term associated with a 200 ng/m3 for S in PM2.5 in our study is, however, larger than those reported by the previous studies; the recalculated ORs for a 200-ng/m3 increase in pregnancy mean exposure to S in PM2.5 were 1.05 (95% CI: 0.97, 1.13) (Bell et al. 2010) and 1.02 (95% CI: 1.00, 1.04) (Basu et al. 2014). Previous findings also support a reduction in mean birth weight associated with S in PM2.5; Basu et al. (2014) reported a statistical significant reduction, and Bell et al. (2010) reported a nonsignificant reduction in birth weight (the recalculated reduction for a 200-ng/m3 increase in pregnancy mean exposure to S in PM2.5 were –8 g (95% CI: –10, –7) and –2 g (95% CI: –7, 3), respectively, compared to –40 g (95% CI: –64, –16) in our study). The differences between ours and previous studies may be explained by differences in study design and the fact that the previous U.S. studies on elemental composition of PM relied on exposure estimates based on data from the nearest regulatory air quality monitor, which do capture temporal trends (which our model did not capture), but less efficiently capture within-city exposure contrasts, and may have resulted in misclassification of exposure. Moreover, we were able to estimate both the effects of between-center and within-center variations in air pollution concentrations. The nonsignificant differences of the effects of between center and within center exposure on LBW may be seen as indicating that both regional and local pollution contribute to the associations with LBW. Previous studies were not always able to consider known and suspected risk factors of LBW such as maternal stature, smoking, parity, atmospheric pressure, humidity, and season of conception. This is not a purely theoretical concern; as an illustration, in our study most elemental components were statistically significantly associated with birth weight in crude models and in models without adjustment for parity, but not in the most comprehensive models we used, which included parity.
Our comparison of between-center and within-center effects indicates that between-center differences in exposure contribute more to the reductions in mean birth weight than within-center exposure contrasts. These findings could reflect the smaller exposure contrasts within each center compared with the larger exposure contrasts derived from the pooled population (Figure 1) and perhaps also residual confounding by unmeasured factors.
Our findings on head circumference indicate that the within-center variation of these elements is important and that the reductions in head circumference were driven by within-center exposure contrasts for most pollutants except for K and Zn (see Supplemental Material, Table S13).
Head circumference has been associated with cognitive ability (Heinonen et al. 2008) and child intellectual quotient (Eriksen et al. 2013). No previous study has examined the associations between PM2.5 components and birth head circumference. In our study all the elemental components except K were significantly associated with smaller head circumference.
Previous birth outcome studies of PM components (Basu et al. 2014; Bell et al. 2010; Ebisu and Bell 2012) did not report results of two-pollutant models adjusted for particle mass. Disentangling the effects of some elements from the effects of particle mass and disentangling the effects of various elemental components is challenging because of the correlations among predicted concentrations, due to partly similar patterns and sources. However, we found no clear indication of co-linearity in the presented two-pollutant models. Results for S adjusted for particle mass concentration did not differ from those from the single-pollutant models. We also investigated whether the previously observed associations with PM2.5 (Pedersen et al. 2013a) were robust to adjustment for S, Ni, and Zn. The findings of the present study suggest that the effect estimates associated with particle mass for LBW, birth weight, and head circumference were reduced and became less significant in two-pollutant models, both for PM2.5 and PM10, after adjustment for either S or Ni, whereas the associations for particle mass were robust for adjustment for other elements (Tables 3–5). Zn, described as a marker for tire wear (Viana et al. 2008), was associated with LBW, suggesting that that non-exhaust component of traffic-related air pollution was associated with LBW, whereas Cu and Fe, other components of non-exhaust traffic elements, were not associated with LBW.
In our study, most of the variability in S exposure occurred between (rather than within) the study areas, and the spatial variation of S within areas was explained mostly by various traffic, land use, and residential density variables (de Hoogh et al. 2013). In Europe, a minor fraction of S in particulate form is part of vehicle exhausts, but particulate sulfate is determined mostly by secondary aerosol formation (Viana et al. 2008). Sulfate is mostly formed in the atmosphere by oxidation of gaseous sulfur dioxide (SO2) emissions [U.S. Environmental Protection Agency (EPA) 2004]. In our study, the between-area variation of sulfur concentrations is more likely to depend on sources such as energy production and distribution rather than traffic, given the small contribution of traffic to the overall sulfur emissions (European Environmental Agency 2014). Sulfate in PM can be transported over regional- or continental-scale distances, resulting in a regional background with typically small spatial variation in metropolitan areas (U.S. EPA 2004). However, the exposure to S in both PM2.5 and PM10 varied less within centers than between centers (Figure 1), and the ratio between-center variance divided by the within-center variance of exposure was higher than the ratio values of all other components and particle mass (see Supplemental Material, Table S2).
Maternal exposure to ambient PM and combustion-related air pollutant gases such as nitrogen dioxide (NO2) and SO2 has been associated with risk of LBW (Pedersen et al. 2013a; Stieb et al. 2012), although it is unclear whether the association with NO2 is explained partly by the association with PM (which is correlated with NO2) and LBW. Mechanisms for the association between air pollution exposure and pregnancy outcomes are not well understood, but several hypotheses exist (Kannan et al. 2006). Inhalation of particles can trigger maternal oxidative stress, lipid peroxidation, inflammation, changes in the blood system; damage vascular endothelium; and thereby decrease placental blood flow, disrupt transplacental oxygenation, cause placental oxidative stress and inflammation, and lead to intrauterine growth restriction (Kannan et al. 2006). Metals such as lead and cadmium have been found to be embryotoxic and teratogenic in a variety of animal species and may also influence human intrauterine growth (Bellinger 2005; Kippler et al. 2012). Genotoxic and epigenetic effects of air pollutants are also possible and may entail effects on fetal growth (Janssen et al. 2013; Pedersen et al. 2013b). Data on humans are limited, and more mechanistic studies on PM components are needed.
In addition to the ability to specify two-pollutant models and to estimate the between-center and within-center effects, the main strengths of our study are the standardized, comprehensive exposure assessment of multiple elements with a high percentage of detected samples (> 75%), and good precision of measurements in all eight cohorts; the harmonized and detailed information on potential confounders; and the large population spread over a large geographical area. Detailed information on individual characteristics (e.g., maternal stature, parity, nationality, education, active and passive smoking during pregnancy) was collected prospectively in a manner that enabled us to reduce potential biases through adjustment.
Studies on temporal stability for elemental PM concentrations in our study areas are yet to be performed. Spatial contrasts of NO2 have been shown to be stable over time in a study, which covered the Italian study area included in the present study (Cesaroni et al. 2012); but because we used annual LUR estimates to assess pregnancy exposures occurring 2–15 years earlier (with most birth cohorts starting in the early 2000s), we recognize the potential for exposure misclassification. The finding of NO2 stability over time may be applicable to traffic-related constituents such as Cu, Fe, and Zn, whereas there is no quantitative evidence for the other constituents, which derive in part from other sources. No evidence of significant differences among seasons has been found for PM10 Cu (de Hoogh et al. 2013), but seasonal variation has not been tested for the other components in our study areas. A higher mean concentration of S in summer compared with the winter mean concentration has been reported in the United States (Bell et al. 2007), whereas no clear seasonal variation was observed for S in either PM2.5 or PM10 in Barcelona, Spain (Minguillón et al. 2014). The performance of the LUR models varied between the study areas and was poor in certain areas for some constituents (de Hoogh et al. 2013). Excluding areas with lowest R2 of LUR attenuated associations, but ORs remained elevated and significant for PM10 (see Supplemental Material, Table S5). The adjusted OR for LBW associated with PM2.5 was 1.21 (95% CI: 1.08, 1.36) in the present study, which is similar to the OR of 1.18 (95% CI: 1.06, 1.33) from our previous study (Pedersen et al. 2013a). The corresponding reductions in birth weight and head circumference were slightly larger in the current study as compared with our previous study. These differences are attributable to the different study population, that is, the current study is based on 30,313 of the 50,151 (60.4%) mother–child pairs included in our previous study.
Our exposure assessment was limited to home address(es), and exposures elsewhere such as at work or during commuting were not estimated, because detailed information on time–activity patterns or personal measures were not available. We had information on work status during pregnancy for five out of the eight cohorts, but we did not perform sensitivity analyses restricted to nonworking women (n = 7,608) because nonworking women differed from the working group of women (n = 18,159) in terms of nationality, age, parity, smoking habits, and other risk factors (results not shown), and it was unknown whether these nonworking women spend more time at home than the working women. Incomplete information on residential mobility may introduce exposure misclassification. Most women (84%), however, did not move residence during pregnancy, and analyses restricted to women who did not change home address during pregnancy gave very similar results to those reported for the full study population.
We used a simple measure to identify infants with suboptimal growth as we restricted the analyses of LBW and change in birth weight to full-term infants (born after 37 completed weeks) in order to separate effects on fetal growth from effects on inadequate time to growth (preterm delivery). In our study we chose not to study small-for-gestational-age because different country-specific reference growth curves were applied in the different centers. Moreover, it is not straightforward to apply a common growth curve for quantification of the deviation in birth weight relative to the expected weight at birth to a study population enrolled from a large heterogeneous study area because fetal growth not only differs by gestational age but also by, for example, nationality, sex, parity, and maternal stature. For this reason we choose to focus on simple measures of newborn’s size at birth.
Finally, we acknowledge that because low birth weight is associated with altered growth patterns in childhood, it would be relevant to consider effects of air pollution on child weight and height at other time points in and after pregnancy, as done in a few studies (Fleisch et al. 2015; Jerrett et al. 2014; Ritz et al. 2014).
We investigated eight a priori selected elements in both the PM2.5 and PM10 fraction, so there might be issues related to multiple comparisons, and the correlation between different elements and the extent to which they can act as surrogate for the exposures causing the effect. Associations with S remained after applying an FDR, though other associations weakened. One should keep in mind that correction for multiple testing in situations like the present one, with several (related) end points and correlations between exposures, is complex (Bender and Lange 2001) and that the FDR approach that we have used assumes independence between covariates. We therefore rather interpreted results on the basis of consistency of effect estimates across elements and PM size fractions.
We conclude that S, reflecting secondary combustion particles in this study, may adversely affect LBW and birth head circumference, independent of particle mass.
Supplemental Material
Acknowledgments
We thank all the participants and collaborators of the participating cohort studies.
Footnotes
The research leading to these results was funded by the European Community’s Seventh Framework Program (FP7/2007-2011) projects ESCAPE (grant agreement 211250) and TRANSPHORM (ENV.2009.1.2.2.1). M.P. holds a Juan de la Cierva postdoctoral fellowship awarded from the Spanish Ministry of Science and Innovation (JCI-2011-09479).
The authors declare they have no actual or potential competing financial interests.
References
- Basu R, Harris M, Sie L, Malig B, Broadwin R, Green R. Effects of fine particulate matter and its constituents on low birth weight among full-term infants in California. Environ Res. 2014;128:42–51. doi: 10.1016/j.envres.2013.10.008. [DOI] [PubMed] [Google Scholar]
- Bell ML, Belanger K, Ebisu K, Gent JF, Leaderer BP. Relationship between birth weight and exposure to airborne fine particulate potassium and titanium during gestation. Environ Res. 2012;117:83–89. doi: 10.1016/j.envres.2012.05.004. [DOI] [PMC free article] [PubMed] [Google Scholar]
- Bell ML, Belanger K, Ebisu K, Gent JF, Lee HJ, Koutrakis P, et al. Prenatal exposure to fine particulate matter and birth weight: variations by particulate constituents and sources. Epidemiology. 2010;21:884–891. doi: 10.1097/EDE.0b013e3181f2f405. [DOI] [PMC free article] [PubMed] [Google Scholar]
- Bell ML, Dominici F, Ebisu K, Zeger SL, Samet JM.2007Spatial and temporal variation in PM2.5 chemical composition in the United States for health effects studies. Environ Health Perspect 115989–995.; doi: 10.1289/ehp.9621 [DOI] [PMC free article] [PubMed] [Google Scholar]
- Bellinger DC. Teratogen update: lead and pregnancy. Birth Defects Res A Clin Mol Teratol. 2005;73:409–420. doi: 10.1002/bdra.20127. [DOI] [PubMed] [Google Scholar]
- Bender R, Lange S. Adjusting for multiple testing—when and how? J Clin Epidemiol. 2001;54:343–349. doi: 10.1016/s0895-4356(00)00314-0. [DOI] [PubMed] [Google Scholar]
- Benjamini Y, Yekutieli D. The control of the false discovery rate in multiple testing under dependency. Ann Stat. 2001;29:1165–1188. [Google Scholar]
- Cesaroni G, Porta D, Badaloni C, Stafoggia M, Eeftens M, Meliefste K, et al. 2012Nitrogen dioxide levels estimated from land use regression models several years apart and association with mortality in a large cohort study. Environ Health 1148; doi: 10.1186/1476-069X-11-48 [DOI] [PMC free article] [PubMed] [Google Scholar]
- Dadvand P, Parker J, Bell ML, Bonzini M, Brauer M, Darrow LA, et al. 2013Maternal exposure to particulate air pollution and term birth weight: a multi-country evaluation of effect and heterogeneity. Environ Health Perspect 121267–373.; doi: 10.1289/ehp.1205575 [DOI] [PMC free article] [PubMed] [Google Scholar]
- Darrow LA, Klein M, Strickland MJ, Mulholland JA, Tolbert PE.2011Ambient air pollution and birth weight in full-term infants in Atlanta, 1994–2004. Environ Health Perspect 119731–737.; doi: 10.1289/ehp.1002785 [DOI] [PMC free article] [PubMed] [Google Scholar]
- de Hoogh K, Wang M, Adam M, Badaloni C, Beelen R, Birk M, et al. Development of land use regression models for particle composition in twenty study areas in Europe. Environ Sci Technol. 2013;47:5778–5786. doi: 10.1021/es400156t. [DOI] [PubMed] [Google Scholar]
- Ebisu K, Bell ML.2012Airborne PM2.5 chemical components and low birth weight in the northeastern and mid-Atlantic regions of the United States. Environ Health Perspect 1201746–1752.; doi: 10.1289/ehp.1104763 [DOI] [PMC free article] [PubMed] [Google Scholar]
- Eeftens M, Beelen R, de Hoogh K, Bellander T, Cesaroni G, Cirach M, et al. Development of land use regression models for PM 2.5, PM2.5 absorbance, PM10 and PMcoarse in 20 European study areas; results of the ESCAPE project. Environ Sci Technol. 2012;46:11195–11250. doi: 10.1021/es301948k. [DOI] [PubMed] [Google Scholar]
- Eriksen HL, Kesmodel US, Underbjerg M, Kilburn TR, Bertrand J, Mortensen EL. 2013Predictors of intelligence at the age of 5: family, pregnancy and birth characteristics, postnatal influences, and postnatal growth. PLoS One 13:8e79200; doi: 10.1371/journal.pone.0079200 [DOI] [PMC free article] [PubMed] [Google Scholar]
- European Environmental Agency. Sulphur Dioxide (SO2) Emmisions. Indicator Assessment. 2014 Available: http://www.eea.europa.eu/data-and-maps/indicators/eea-32-sulphur-dioxide-so2-emissions-1/assessment-3 [accessed 2 October 2014]
- Fleisch AF, Rifas-Shiman SL, Koutrakis P, Schwartz JD, Kloog I, Melly S, et al. Prenatal exposure to traffic pollution: associations with reduced fetal growth and rapid infant weight gain. Epidemiology. 2015;26:43–50. doi: 10.1097/EDE.0000000000000203. [DOI] [PMC free article] [PubMed] [Google Scholar]
- Fleischer NL, Merialdi M, van Donkelaar A, Vadillo-Ortega F, Martin RV, Betran AP, et al. 2014Outdoor air pollution, preterm birth, and low birth weight: analysis of the World Health Organization Global Survey on Maternal and Perinatal Health. Environ Health Perspect 122425–430.; doi: 10.1289/ehp.1306837 [DOI] [PMC free article] [PubMed] [Google Scholar]
- Heinonen K, Räikkönen K, Pesonen AK, Kajantie E, Andersson S, Eriksson JG, et al. Prenatal and postnatal growth and cognitive abilities at 56 months of age: a longitudinal study of infants born at term. Pediatrics. 2008;121:e1325–e1333. doi: 10.1542/peds.2007-1172. [DOI] [PubMed] [Google Scholar]
- Janssen BG, Godderis L, Pieters N, Poels K, Kiciński M, Cuypers A, et al. 2013Placental DNA hypomethylation in association with particulate air pollution in early life. Part Fibre Toxicol 722; doi: 10.1186/1743-8977-10-22 [DOI] [PMC free article] [PubMed] [Google Scholar]
- Jerrett M, McConnell R, Wolch J, Chang R, Lam C, Dunton G, et al. 2014Traffic-related air pollution and obesity formation in children: a longitudinal, multilevel analysis. Environ Health 1349; doi: 10.1186/1476-069X-13-49 [DOI] [PMC free article] [PubMed] [Google Scholar]
- Jerrett M, Shankardass K, Berhane K, Gauderman WJ, Künzli N, Avol E, et al. 2008Traffic-related air pollution and asthma onset in children: a prospective cohort study with individual exposure measurement. Environ Health Perspect 1161433–1438.; doi: 10.1289/ehp.10968 [DOI] [PMC free article] [PubMed] [Google Scholar]
- Kannan S, Misra DP, Dvonch JT, Krishnakumar A.2006Exposures to airborne particulate matter and adverse perinatal outcomes: a biologically plausible mechanistic framework for exploring potential effect modification by nutrition. Environ Health Perspect 1141636–1642.; doi: 10.1289/ehp.9081 [DOI] [PMC free article] [PubMed] [Google Scholar]
- Kelly FJ, Fussell JC. Size, source and chemical composition as determinants of toxicity attributable to ambient particulate matter. Atmos Environ. 2012;60:504–526. [Google Scholar]
- Kippler M, Tofail F, Gardner R, Rahman A, Hamadani JD, Bottai M, et al. 2012Maternal cadmium exposure during pregnancy and size at birth: a prospective cohort study. Environ Health Perspect 120284–289.; doi: 10.1289/ehp.1103711 [DOI] [PMC free article] [PubMed] [Google Scholar]
- Minguillón MC, Cirach M, Hoek G, Brunekreef B, Tsai M, de Hoogh K, et al. Spatial variability of trace elements and sources for improved exposure assessment in Barcelona. Atmos Environ. 2014;89:268–281. [Google Scholar]
- Pedersen M, Giorgis-Allemand L, Bernard C, Aguilera I, Andersen AM, Ballester F, et al. Ambient air pollution and low birthweight: a European cohort study (ESCAPE). Lancet Respir Med. 2013a;1:695–704. doi: 10.1016/S2213-2600(13)70192-9. [DOI] [PubMed] [Google Scholar]
- Pedersen M, Schoket B, Godschalk RW, Wright J, von Stedingk H, Törnqvist M, et al. 2013bBulky DNA adducts in cord blood, maternal fruit-and-vegetable consumption, and birth weight in a European mother-child study (NewGeneris). Environ Health Perspect 1211200–1206.; doi: 10.1289/ehp.1206333 [DOI] [PMC free article] [PubMed] [Google Scholar]
- Ritz B, Qiu J, Lee PC, Lurmann F, Penfold B, Erin Weiss R, et al. Prenatal air pollution exposure and ultrasound measures of fetal growth in Los Angeles, California. Environ Res. 2014;130:7–13. doi: 10.1016/j.envres.2014.01.006. [DOI] [PMC free article] [PubMed] [Google Scholar]
- Sapkota A, Chelikowsky AP, Nachman KE, Cohen AJ, Ritz B. Exposure to particulate matter and adverse birth outcomes: a comprehensive review and meta-analysis. Air Qual Atmos Health. 2012;5:369–381. [Google Scholar]
- Slama R, Khoshnood B, Kaminski M.2008How to control for gestational age in studies involving environmental effects on fetal growth [Letter]. Environ Health Perspect 116A284; doi: 10.1289/ehp.11105 [DOI] [PMC free article] [PubMed] [Google Scholar]
- Stanek LW, Sacks JD, Dutton SJ, Dubois JJB. Attributing health effects to apportioned components and sources of particulate matter: an evaluation of collective results. Atmos Environ. 2011;45:5655–5663. [Google Scholar]
- Stieb DM, Chen L, Eshoul M, Judek S. Ambient air pollution, birth weight and preterm birth: a systematic review and meta-analysis. Environ Res. 2012;117:100–111. doi: 10.1016/j.envres.2012.05.007. [DOI] [PubMed] [Google Scholar]
- U.S. EPA (U.S. Environmental Protection Agency). Washington, DC: U.S. EPA; 2004. Air Quality Criteria for Particulate Matter (Final Report, October 2004). [Google Scholar]
- Viana M, Kuhlbusch TAJ, Querol X, Alastuey A, Harrison RM, Hopke PK, et al. Source apportionment of particulate matter in Europe: a review of methods and results. J Aerosol Sci. 2008;39:827–849. [Google Scholar]
- Woodruff TJ, Parker JD, Darrow LA, Slama R, Bell ML, Choi H, et al. Methodological issues in studies of air pollution and reproductive health. Environ Res. 2009;109:311–320. doi: 10.1016/j.envres.2008.12.012. [DOI] [PMC free article] [PubMed] [Google Scholar]
Associated Data
This section collects any data citations, data availability statements, or supplementary materials included in this article.