

Abstract
Disruption of iron homeostasis as a consequence of aging is thought to cause iron levels to increase, potentially promoting oxidative cellular damage. Therefore, understanding how this process evolves through the lifespan could offer insights into both the aging process and the development of aging-related neurodegenerative brain diseases. This work aimed to map, in vivo for the first time with an unbiased whole-brain approach, age-related iron changes using quantitative susceptibility mapping (QSM)—a new postprocessed MRI contrast mechanism. To this end, a full QSM standardization routine was devised and a cohort of N = 116 healthy adults (20–79 years of age) was studied. The whole-brain and ROI analyses confirmed that the propensity of brain cells to accumulate excessive iron as a function of aging largely depends on their exact anatomical location. Whereas only patchy signs of iron scavenging were observed in white matter, strong, bilateral, and confluent QSM–age associations were identified in several deep-brain nuclei—chiefly the striatum and midbrain—and across motor, premotor, posterior insular, superior prefrontal, and cerebellar cortices. The validity of QSM as a suitable in vivo imaging technique with which to monitor iron dysregulation in the human brain was demonstrated by confirming age-related increases in several subcortical nuclei that are known to accumulate iron with age. The study indicated that, in addition to these structures, there is a predilection for iron accumulation in the frontal lobes, which when combined with the subcortical findings, suggests that iron accumulation with age predominantly affects brain regions concerned with motor/output functions.
SIGNIFICANCE STATEMENT This study used a whole-brain imaging approach known as quantitative susceptibility mapping (QSM) to provide a novel insight into iron accumulation in the brain across the adult lifespan. Validity of the method was demonstrated by showing concordance with ROI analysis and prior knowledge of iron accumulation in subcortical nuclei. We discovered that, beyond these regions, there is extensive involvement of the frontal lobes that has been missed by past ROI analyses. Broadly speaking, therefore, the motor system selectively accumulates iron with age. The results offer insights into the aging process, but also offer a new approach to studying the role of iron dysregulation in the evolution of age-related neurodegenerative diseases.
Keywords: aging, brain iron, magnetic susceptibility, neurodegenerative diseases
Introduction
Nonheme iron is an essential cofactor for neuronal oxidative metabolism and in the biosynthesis of DNA, myelin and neurotransmitters (Ward et al., 2014). With aging, iron dysregulation occurs (Daugherty et al., 2015), resulting in a chain of events that, although not fully elucidated, appear to be largely deleterious: for example, insidious damage to the blood–brain barrier (Farrall and Wardlaw, 2009) and excessive free radical generation inducing oxidative stress (Poon et al., 2004) are mechanisms thought to be associated with age- and disease-related iron accumulation. In addition, it is also thought that microglial activation stimulates iron uptake from damaged cells and downregulates export to exacerbate iron imbalance (Rathore et al., 2012), thus compromising microglial neuroprotection (Streit et al., 2008) and increasing neurotoxicity (Block et al., 2007).
Previous studies using either postmortem material or in vivo iron-sensitive MRI techniques have shown that iron concentration is unevenly distributed in the brain, with areas such as the basal ganglia showing the highest levels (Morris et al., 1992; Haacke et al., 2005). It has also been demonstrated that cerebral iron levels increase with age (Hallgren and Sourander, 1958; Bartzokis et al., 2007), which, in turn, has been linked to cognitive impairment (Penke et al., 2012; Daugherty et al., 2015; Ghadery et al., 2015) and motor system degeneration (Spatz, 1922). Therefore, with age being the strongest risk factor for many neurodegenerative diseases, it has been proposed that iron overload might be a marker or even predictor of neurodegenerative pathology (Ward et al., 2014). This has been partially corroborated by a number of postmortem and in vivo human studies that have identified abnormal iron concentrations in neurodegenerative diseases such as Alzheimer's disease (AD) (Cornett et al., 1998; Bartzokis et al., 2000) and Parkinson's disease (PD) (Sofic et al., 1991; Bartzokis et al., 1999). Although such findings do not yet clarify whether pathological iron accumulation is a cause or consequence in the neurodegenerative cascade, they reinforce the notion that monitoring the spatial distribution and temporal dynamics of iron deposition in the aging brain may inform understanding of successful aging and neurodegenerative disease (Koeppen, 1995).
Several MRI techniques are sensitized to measure brain iron; however, in practice, these have not been widely used for technical or logistical reasons. For example, field-dependent transverse relaxation rate (R2) increase (FDRI) (Bartzokis et al., 1993), the gold standard in this context, requires multiple MRI field strength measurements. R2 and R2* (Ordidge et al., 1994) require multiecho scans that are prone to subject motion and other errors, although, with current technological advances, this is becoming less problematic. Finally, susceptibility-weighted imaging (SWI) (Haacke et al., 2004) yields nonlocal measures that are difficult to interpret in biological terms (Pfefferbaum et al., 2009). To circumvent such limitations, a new contrast referred to as quantitative susceptibility mapping (QSM) has been proposed (de Rochefort et al., 2008; Kressler et al., 2010). QSM can measure magnetic susceptibility from MRI scans using standard commercial scanners (Haacke et al., 2015; Wang and Liu, 2015). QSM results are concordant with postmortem iron measurements (Zheng et al., 2013; Sun et al., 2015) and other iron-sensitive MRI techniques (Bilgic et al., 2012; Poynton et al., 2015) and have demonstrated reproducible results (Lin et al., 2015). To date, studies of iron accumulation in healthy aging, whether postmortem or MRI based, have been mostly limited to ROI analysis. Although, as shown in a previous proof-of-concept QSM study in AD (Acosta-Cabronero et al., 2013) and with a quantitative MRI protocol in aging (Callaghan et al., 2014), whole-brain analysis is now feasible, thus offering the potential to uncover relationships that would be missed with limited ROI sampling. This study presents an unbiased whole-brain mapping of iron deposition across the adult lifespan as measured by the new iron-sensitive QSM contrast.
Materials and Methods
Study subjects.
Healthy volunteers (N = 116) ranging in age from 20 to 79 years (mean: 54 ± 19) and comprising 60 males and 56 age-matched females participated in the study. To further explore age dependencies, for some analyses, the cohort was split at a cutoff age of 55 years into young (n = 48, age: 33 ± 10; range, 20–53 years) and elderly (n = 68, age: 69 ± 5; range, 59–79) groups.
Subjects aged 50 years and older were screened to exclude neurological or major psychiatric illness; this included a brief neuropsychological assessment comprising mini-mental state examination, forward and backward digit span, copy and 30 min delayed recall of the Rey complex figure, phonemic and semantic category fluencies, and a 15-item Boston naming test. The complete cohort consisted of N = 121 healthy subjects; before analysis, n = 2 were excluded due to cognitive impairment (both for scoring worse than 1.5 σ below the age-adjusted control mean for recall of the Rey figure).
T2-weighted images and susceptibility maps (see next section) were also inspected visually to exclude brain abnormalities. Vascular pathology was assessed on T2-weighted MRI by applying the Fazekas scale (Fazekas et al., 1987) with deep or periventricular scores of ≥2 for either being an exclusion (n = 2 subjects were excluded on this criteria for periventricular hyperintensities). In addition, one more subject was excluded due to a severe pallidal calcification, which was visible both on QSM and T1-weighted images. Mild lesions (small calcium deposits), however, were cataloged as a normal occurrence in healthy aging. No subject had evidence of microhemorrhages. In addition, data on vascular risk factors were collected on the cohort, namely history of hypertension, heart attack, and diabetes, as well as height and weight. Eighteen percent of participants had been diagnosed with hypertension (30% of all subjects aged 60 years and over), 4% had a history of diabetes, 3% were obese (body-mass index >30.0), and one subject reported having a previous heart attack.
Imaging protocol.
MRI measurements were performed on a Siemens Verio 3 Tesla system with a standard Siemens 32-channel phased-array head coil for reception.
Susceptibility-weighted data were collected as complex MRI signals from each receiver channel. This is possible in Siemens systems enabling “save uncombined” under the “system” task card of a SWI sequence; in this study, a product (syngo VB19; Siemens Healthcare) 3D-flow compensated, spoiled-gradient-recalled echo acquisition (Haacke et al., 2009) with slab-selective excitation. The excitation flip angle was set to 17°; echo time 20 ms; receiver bandwidth 100 Hz per pixel; and repetition time 28 ms. Matrix size was 256 × 224 (right-left phase encoding direction); 80 straight-axial slices were acquired for whole-brain coverage plus oversampling of 16 additional slices to reduce aliasing and 0.4 mm interslice spacing to minimize cross talk interference; voxel resolution was 1 × 1×2 mm3; and GRAPPA (Griswold et al., 2002) was enabled with an acceleration factor of 2 and 24 reference lines, giving a scan time of 5:32 min.
T1-weighted 3D-MPRAGE anatomical images (Mugler and Brookeman, 1990) were also collected to resolve independently the underlying brain anatomy. For consistency with the SWI scan and to aid coregistration, slices were prescribed in straight sagittal orientation. The following acquisition parameters were used: inversion time was set to 1100 ms, flip angle was 7°, time to echo was 4.37 ms, receiver bandwidth was 140 Hz/pixel, echo spacing was 11.1 ms, and repetition time was 2500 ms. The 3D matrix dimensions were 256 × 256 × 192 (0.5 mm interslice gap), 7/8 partial Fourier, and 1 × 1×1 mm3 voxel size. GRAPPA was also enabled with acceleration factor of 2 and 24 reference lines.
T2-weighted turbo spin echo images were also acquired in the same scanning session for all subjects. To ease visual inspection, the field of view was aligned at acquisition to the anterior commissure–posterior commissure line. The prescribed scan parameters were as follows: flip angle 150°, echo time 96 ms, receiver bandwidth 220 Hz/pixel, turbo factor 18, 13 echo trains per slice with echo spacing set to 9.64 ms, and repetition time of 8160 ms. The in-plane matrix was 320 × 320 (resolution: 0.7 × 0.7 mm2), with 45 axial slices enabling whole-brain coverage (thickness: 3 mm; gap: 0.9 mm). The GRAPPA factor was set to 2 with 51 reference lines.
A thin pillow was placed on the base of the coil surrounding the sides and the back of the head to minimize motion and increase intersubject reproducibility in positioning. It should also be noted that these are relatively fast scans, which, in addition to the use of the pillow, helped to minimize motion-related artifacts.
QSM reconstruction.
Multichannel complex data were combined for optimal phase reconstruction using a robust adaptive algorithm (Walsh et al., 2000) extended for automatic reference channel selection (i.e., that with the greatest fifth percentile of signal magnitude within a brain mask). Brain masks were calculated using the BET2 algorithm (Smith, 2002) in FSL version 5.0 (http://fsl.fmrib.ox.ac.uk) with fractional threshold set to 0.1. Combined phase images were then unwrapped with a continuous Laplacian approach (Schofield and Zhu, 2003); however, please note that it has been found recently that such a method may induce some errors in the vicinity of vasculature (Haacke et al., 2015). After unwrapping, the local field was revealed through global extraction of background effects; this was estimated with the SHARP filtering method (Schweser et al., 2011) using a sphere radius of 5 mm. Finally, to condition the susceptibility restoration problem, an iterative, morphology-enabled, nonlinear dipole inversion (MEDIN) solver with dynamic noise-weighting reduction (MERIT) was used (Liu et al., 2013). MEDIN assumes that magnetic susceptibility sources are piecewise-constant compartments regularised by the ℓ1 norm of a total variation operation over the morphology-constrained solution, which “smooths” an otherwise data-consistent solution. The consistency term is regularized to suppress streaking artifacts and noise amplification arising from the undetermined terms of the magnetic dipole kernel, but it is also vulnerable to phase noise nonuniformities; therefore, it was weighted by an estimate of the inverse of the phase noise variance, that is, the signal magnitude-to-noise ratio (SNR) (Conturo and Smith, 1990). SNR maps were calculated as the magnitude adjusted for noise bias (Gudbjartsson and Patz, 1995) divided by the SD of the real component of the complex signal across eight 14 × 14 × 14 mm3 background regions located at the corners of the field of view (excluding the outermost voxels in all directions). The QSM inversion algorithm was set to recalculate a new set of initial conditions every 500 conjugate gradient iterations and was terminated when the normalized residual ratio fell below 0.01. There is a trade-off element between data consistency and smoothing that can be controlled via a free regularization parameter, the Lagrange multiplier. The optimum multiplier was set to match the norm of the consistency residual with an estimate of the measurement noise (Morozov, 1966). The application of the discrepancy (noise-matching) principle yielded largely concordant optimal parameters on five randomly selected datasets (in λ = 500 steps), the median of which was used throughout this study (λ = 1000).
Raw QSMs are usually normalized (by direct subtraction) to a reference value to correct for the elimination of direct current offsets on dipole kernel operations. To date, however, the relative magnitude of such adjustment is unknown and most approaches for selecting a suitable reference region are unchallenged. In this study, we contrasted results from raw (non-normalized) QSM data with those from data that were normalized using a semiautomated method for reference selection. The reference region was manually traced on the distribution of the first percentile of a relative variance map (relative variance <0.005) from which a fairly confluent posterior white matter region (far from any gray matter boundary) emerged.
QSM spatial standardization.
Radio-frequency bias corrected (N4-ITK) (Tustison et al., 2010) MPRAGE images were standardized (to a studywise space) by way of a parallel routine for template calculation based on the diffeomorphic Greedy-SyN transformation model (Avants et al., 2008) in ANTs version 2.1 (http://stnava.github.io/ANTs). Simultaneous coregistrations were driven by cross-correlation minimizations performed over three resolutions, with a maximum of 90 iterations at the coarsest level, 30 at the next coarsest, and 90 at full resolution; template update step size was set to 0.1 mm. Four rigid-then-affine iterations were followed by six full runs of the above nonlinear multiresolution routine to ensure stable convergence. Subsequently, bias-corrected SNR maps for each susceptibility-weighted dataset were affine coregistered using ANTs to their corresponding MPRAGE volume. QSM spatial standardization was achieved through the warp composition of the above transformations and third-order b-spline interpolation.
Figure 1 summarizes the processing pipeline proposed for QSM standardization and analysis.
Figure 1.

Summary steps of the processing pipeline (QSM calculation, spatial standardization, and analysis) for the in vivo study of brain iron. The numbering indicates the order of procedural steps.
Coregistration performance.
The following analyses strongly rely on the performance of the coregistration routine because warping inaccuracies due to anatomical heterogeneity, geometric distortions, brain atrophy, and so on could bias measurements that are extracted directly from template space. Such errors, however, can be well characterized by the spatial distribution of high, relative QSM variances. The nature of QSM is well suited to measuring registration errors and other imperfections using such a procedure because susceptibility gradients are strong—sign reversal in some cases at the interface between iron-rich structures and white matter or CSF and between deoxygenated blood and adjacent parenchymal tissue—leading to spurious measurement dispersion when misregistration occurs.
Whole-brain QSM analyses.
Although, to date, a number of studies have adopted an exponential model to describe the relationship between iron deposition and age (Hallgren and Sourander, 1958; Li et al., 2014), this appears only suitable for describing behaviors across the entire lifespan. In this study, however, we were not concerned with the fast iron increase during early human development, so we simplified the model to a linear approximation. Age dependencies were thus estimated with a whole-brain linear regression using Randomize version 2.9 (Winkler et al., 2014) and threshold-free cluster enhancement (TFCE) (Smith and Nichols, 2009) in FSL. Cluster-based positive relationships between QSM and age were inferred from a Monte Carlo simulation of a random subset of 20,000 permutations at a familywise error (FWE)-corrected threshold level of 0.005 with default TFCE settings (“−T” flag in Randomize). Before performing statistics, standardized QSMs were smoothed by convolution with a 3D Gaussian kernel (SD: 3 mm). After analysis, the QSM template and study results were warped to MNI152 space (Montreal Neurological Institute, McGill University, Canada) using b-spline and trilinear interpolation, respectively. Note the studywise template to MNI152 transformation was calculated with a rigid, affine, plus deformable b-spline coregistration routine in ANTs (“antsRegistrationSyN”).
Sex dependencies were also tested in the whole brain by way of a two-group comparison using an analogous permutation-based framework. Furthermore, given the relatively high incidence of hypertension in the elderly, we also conducted an experiment to determine whether hypertension could play a role in explaining age-related QSM abnormalities. We identified 15 subjects (age: 70 ± 5 years old, 11 male and 4 female) with a previous diagnosis of hypertension but otherwise no history of diabetes or heart attack and compared them against an equally sized, age- and sex-matched control group with no previous history of hypertension, diabetes, or heart attack. To further contextualize the size of QSM effects due to hypertension in relation to those driven by the normal course of aging, a group of 15 healthy young subjects (age: 27 ± 4 years) was finally contrasted with the nonhypertensive, nondiabetic elderly group.
Regional QSM assessment in deep-brain structures.
The primary objective of the present study was to map the whole-brain landscape of age-related QSM alterations; therefore, a regional assessment in this context was not to validate in a fully independent manner such analysis, but to quantify and illustrate the nature of the alterations captured by the proposed whole-brain method. In addition, because ROI extractions in template space circumvents Gaussian smoothing, reproducing the whole-brain results with such an approach would confirm the validity of smoothing whole-brain QSM data to minimize the impact of warping errors. For ROI analysis, unsmoothed median QSM values were extracted bilaterally from the following structures: caudate nucleus, putamen, globus pallidus, hippocampus, amygdala, thalamus, red nucleus, substantia nigra, and dentate nucleus. The former six ROIs were inferred automatically from the studywise anatomical template using the FIRST algorithm (Patenaude et al., 2011) in FSL and the latter three were traced manually on the QSM template. To reduce edge effects due to registration errors and other standardization imperfections, all ROIs were eroded in 3D by convolution with a 1 mm radius spherical kernel. Subsequently, mask overlays were visually inspected on each template-warped QSM and edited accordingly to ensure that all masks excluded spurious voxels. Test–retest reliability of manual QSM extractions was evaluated using single-measure, intraclass correlation coefficients (ICCs) and associated 95% confident intervals inferred from ROIs traced by two trained raters (M.J.B. and J.A.-C.). ICCs for nigral, red nucleus, and dentate nucleus measurements were 0.94 ± 0.02, 0.99 ± 0.01, and 0.98 ± 0.01, respectively; therefore, the template-based manual ROI approach was deemed to be highly reliable. Interhemispheric differences were probed using Wilcoxon rank-sum tests, which revealed that left/right measurements were essentially identical (p > 0.4). For simplicity, then, median ROI values were averaged across hemispheres and Pearson age correlation and old-versus-young Wilcoxon rank-sum statistics were computed. In addition, old-versus-young F tests for equal variances were performed and linear least-square fits were calculated for regions where the Pearson correlation test returned p < 0.0056 (i.e., Bonferroni-corrected p < 0.05 for 9 ROIs). All tests were performed two-tailed.
Computational framework and processing times.
All data postprocessing was performed in a desktop computer with two 3.1 GHz octa-core hyperthreading CPUs, 64 GB DDR3 RAM, and a hardware array of four solid-state drives operated by Ubuntu Linux 12.04. Except where stated otherwise, processing tasks (including QSM reconstruction and regional data analysis) were prototyped and executed in the Matlab (R2012a) environment (The Mathworks). The average processing time for single-thread QSM reconstructions was 122 min; however, on this computing system, up to 32 pipelines could be executed simultaneously. In such a parallel environment, the template creation routine was completed in 52 h.
Results
Single QSM examination
Individual QSMs (see example in Fig. 2) revealed very heterogeneous magnetostatic patterns. It is noteworthy that, even for the youngest subjects (20 years old) in this study, the basal ganglia system showed clear signs of metal load, as did the cortex (with the motor strip as a prominent feature) and other deep-brain nuclei. In addition, the venous system was also clearly identifiable. Small, scattered signal inhomogeneities (possibly related to calcifications and appearing mostly in the basal ganglia of some older subjects) were also visible, although, in the absence of cognitive impairment, these were considered nonpathological occurrences (e.g., see small deposits in the putamen and pallidum in Fig. 2, cuts z = −4 mm to z = 5 mm).
Figure 2.

Standardized (to MNI152 space) 3T QSM of a 51-year-old subject. Dark regions reflect the strong paramagnetism returned by metallic species such as tissue iron. Globus pallidus, striatum, substantia nigra, and red nucleus are the most salient features in the QSM contrast; the cortex also displays some QSM contrast. Each panel's left side represents the true left hemisphere.
QSM data dispersion
Registration errors at structural boundaries or, more generally, those stemming from heterogeneous behaviors due to, for example, atrophy, venous idiosyncrasies, or imaging artifacts, leave a mark in the form of abnormally high QSM variance. This was set empirically in Figure 3 to 10% (or greater) relative to the global mean; that is, an order of magnitude greater than that measured in the dentate nucleus ROI (see regional results below). As can be seen from Figure 3, subcortical masks largely avoided such regions, except for the amygdala and hippocampus, both of which were possibly affected by the large number of blood vessels in their vicinity, as well as the thalamic subnuclear complex, which is locally heterogeneous. The cortex is perhaps more problematic due to its complex topology and close proximity to generators of background field offset, particularly at the pial surface (where the outer cortex meets cerebrospinal-fluid) and near cranial cavities (i.e., in the inferior frontal and anterior temporal areas). However, importantly, across large portions of the cortical ribbon including the majority of deep sulci, the proposed QSM methodology appeared to be sufficiently robust for whole-brain analysis.
Figure 3.

Regions of interest overlaid onto the studywise average QSM template (A) and the relative variance map (B) across 116 healthy subjects. Areas of extreme QSM dispersion (dark on B) arise from poor spatial standardization and other sources of error.
Whole-brain analyses
The whole-brain regression (Fig. 4) revealed that iron deposition due to aging is spatially selective. Strong positive correlations, markedly bilateral and confluent, were identified in several cortical and subcortical regions. In deep gray matter, this included the striatum (putamen and caudate nucleus), mesencephalic structures (substantia nigra and red nucleus), diencephalic structures (subthalamic nucleus, mammillary bodies, parts of medial, and posterior thalamic subnuclei groups), and the cerebellar dentate nucleus. QSM covaried with age in the sensory-motor cortex; this was extensive and confluent in superior premotor cortex, prefrontal, insular areas, and dorsomedial frontal cortices down to the cingulate sulcus and cerebellar cortex; and in supramarginal and posterior parahippocampal gray matter and was minor in the posterior cingulate and precuneus cortical regions. White matter QSM relationships, conversely, were overall weaker. These observations were also true for reference-normalized data (results not shown).
Figure 4.
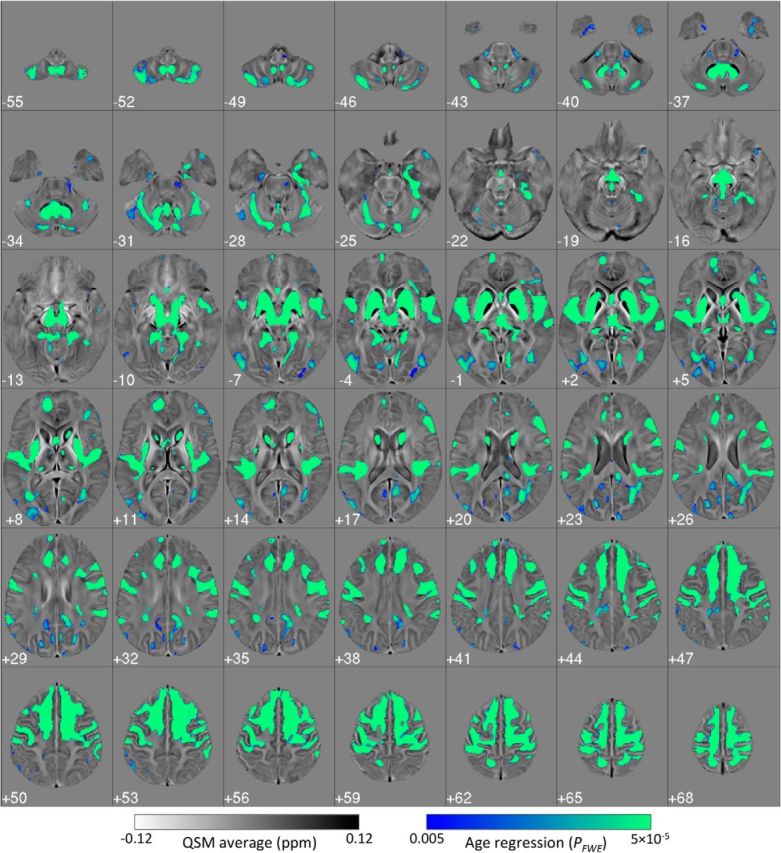
Bilateral and confluent landscape of iron deposition across the adult lifespan. Thresholded (pFWE < 0.005) statistical map for the cluster-enhanced linear relationship between QSM and age in 116 healthy subjects (20–79 years old). Results were standardized to the MNI152 space and overlaid onto the MNI-normalized QSM study template. Left on the figure represents the true left.
The whole-brain QSM analysis in aged hypertensive subjects yielded no significant differences relative to age- and sex-matched controls at pFWE < 0.05, whereas the healthy young versus healthy elderly comparison shown in Figure 5 returned strong QSM alterations in a distribution that closely mirrored the full cohort age regression results. In addition, male-versus-female whole-brain comparisons were also negative (on both contrasts: QSMmale > QSMfemale and QSMmale < QSMfemale at pFWE < 0.05).
Figure 5.

Demonstration of aging-driven QSM elevation in healthy subjects with no previous history of hypertension (or other vascular risks). A, Thresholded (pFWE < 0.05) statistical results for the comparison of 15 elderly subjects (age: 70 ± 5 years) without a diagnosis of hypertension versus 15 healthy young subjects (age: 27 ± 4 years). B, Results (pFWE < 0.005) for the whole-brain age regression on 116 subjects (same as in Fig. 4). Note that the statistical comparison between hypertensive and age-matched subjects with no apparent vascular risks was completely negative.
Deep-brain regional extraction
As expected, the ROI results confirmed large regional differences in absolute terms for QSM values ranging from substantia nigra and cerebellar dentate nucleus (highest) to hippocampus and amygdala (lowest) (Fig. 6, Table 1).
Figure 6.

Regional plots for left/right average, median QSM values as a function of age for nine deep-brain nuclei: substantia nigra, dentate nucleus, red nucleus, globus pallidus, caudate nucleus, putamen, thalamus, hippocampus, and amygdala (from greatest to lowest average QSM; Table 1). Dark circles/light squares denote female/male subjects, respectively. Linear functions were fitted to the data (thick continuous line) whether the QSM–age Pearson correlation test returned significant p values (Table 1). The thinner lines represent the simultaneous prediction bounds of the 95% confidence intervals for the linear fits.
Table 1.
Summary of regional group statistics and age dependence tests
| SN | DN | RN | Pall | Caud | Puta | Thal | Hipp | Amyg | |
|---|---|---|---|---|---|---|---|---|---|
| Group statistics | |||||||||
| Mean QSM (ppm) | |||||||||
| Young | 0.113 | 0.097 | 0.074 | 0.074 | 0.033 | 0.021 | 0.003 | 0.001 | −0.004 |
| Elderly | 0.127 | 0.116 | 0.097 | 0.074 | 0.041 | 0.040 | 0.002 | 0.001 | −0.003 |
| Male | 0.118 | 0.105 | 0.088 | 0.073 | 0.038 | 0.032 | 0.003 | 0.001 | −0.003 |
| Female | 0.124 | 0.112 | 0.086 | 0.075 | 0.038 | 0.032 | 0.002 | 0.001 | −0.004 |
| All | 0.121 | 0.108 | 0.087 | 0.074 | 0.038 | 0.032 | 0.002 | 0.001 | −0.003 |
| SEM (ppm) | |||||||||
| Young | 0.0027 | 0.0042 | 0.0031 | 0.0012 | 0.0012 | 0.0013 | 0.0003 | 0.0005 | 0.0007 |
| Elderly | 0.0026 | 0.0046 | 0.0030 | 0.0018 | 0.0014 | 0.0019 | 0.0003 | 0.0005 | 0.0006 |
| Male | 0.0026 | 0.0047 | 0.0032 | 0.0013 | 0.0014 | 0.0020 | 0.0004 | 0.0004 | 0.0006 |
| Female | 0.0029 | 0.0047 | 0.0036 | 0.0019 | 0.0016 | 0.0023 | 0.0003 | 0.0005 | 0.0006 |
| All | 0.0020 | 0.0033 | 0.0024 | 0.0012 | 0.0010 | 0.0015 | 0.0002 | 0.0003 | 0.0004 |
| Elderly vs young | |||||||||
| Rank-sum test | |||||||||
| Z | −3.4 | −3.7 | −4.8 | 0.9 | −4.2 | −6.8 | 1.6 | 1.4 | 0.3 |
| p | 6 × 10⁻⁴ | 2 × 10⁻⁴ | 2 × 10⁻⁶ | NS | 3 × 10⁻⁵ | 9 × 10⁻¹² | NS | NS | NS |
| Variance test | |||||||||
| F | 0.75 | 0.60 | 0.75 | 0.34 | 0.51 | 0.37 | 0.71 | 0.69 | 0.99 |
| p | NS | NST | NS | 2 × 10⁻⁴ | NST | 5 × 10⁻⁴ | NS | NS | NS |
| QSM–age correlation | |||||||||
| Pearson test | |||||||||
| ρ2 | 0.21 | 0.14 | 0.32 | 0.01 | 0.23 | 0.48 | 0.05 | 0.03 | 0.01 |
| p | 3 × 10⁻⁷ | 5 × 10⁻⁵ | 3 × 10⁻¹¹ | NS | 7 × 10⁻⁸ | 6 × 10⁻¹⁸ | NS | NS | NS |
| Linear fit | |||||||||
| Slope ± SE (ppm/year) | 5.1 ± 0.9 × 10⁻⁴ | 7.0 ± 1.0 × 10⁻⁴ | 7.8 ± 1.0 × 10⁻⁴ | NA | 2.8 ± 0.4 × 10⁻⁴ | 6.0 ± 0.5 × 10⁻⁴ | NA | NA | NA |
| Intercept ± SE (ppm) | 0.093 ± 0.005 | 0.070 ± 0.008 | 0.045 ± 0.006 | NA | 0.023 ± 0.002 | −0.0002 ± 0.003 | NA | NA | NA |
| Normalized QSM | |||||||||
| ρ2/ | 0.22 | 0.14 | 0.33 | NS | 0.22 | 0.46 | |||
| Slope/ | 5.4 × 10⁻⁴ | 7.2 × 10⁻⁴ | 8.0 × 10⁻⁴ | 3.1 × 10⁻⁴ | 6.2 × 10⁻⁴ | ||||
| Intercept | 0.110 | 0.083 | 0.058 | 0.035 | 0.012 | NS | NS | NS |
SN, Substantia nigra; DN, dentate nucleus; RN, red nucleus; Pall, globus pallidus; Caud, caudate nucleus; Puta, putamen; Thal, thalamus; Hipp, hippocampus; Amyg, amygdala; NS, not significant; NST, nonsignificant trend (puncorrected < 0.05); NA, not applicable.
QSM in five large nuclei—putamen, red nucleus, caudate nucleus, substantia nigra, and dentate nucleus (listed by decreasing correlation strength)—covaried with age (Fig. 6, Table 1). The greatest slopes were found (sorted by steepness) in the red nucleus, dentate nucleus, putamen, and substantia nigra. In addition, in the globus pallidus, putamen, and less markedly in the caudate and dentate nuclei, the variance of the QSM distribution increased as a function of age (Fig. 6, Table 1). QSM in the hippocampus, amygdala, and thalamus, in contrast, remained largely age independent (Fig. 6, Table 1).
No major sex-related effects were identified—only QSM in the thalamus returned a nonsignificant statistical trend in the male/female group comparison (Z = −2.4, p = 0.02), with females presenting lower overall QSM values.
Analogous results to those shown in Figure 6 and Table 1 were obtained for normalized QSM data (see Pearson correlation coefficients and linear fit parameters at the bottom of Table 1).
Discussion
This study presents a novel MRI method to monitor brain iron levels, revealing extensive and largely confluent age-correlated clusters spreading across the cortex (sensory-motor, dorsal frontal lobes, and posterior insular), cerebellum (including cortex and dentate nucleus), as well as several other deep-brain nuclei including putamen, caudate nucleus, medial, posterior, and subthalamic nuclear groups, mammillary bodies, and mesencephalic structures (Fig. 4). In contrast, QSM in cerebral white matter, in a large portion of nonfrontal cortex, and in the hippocampus, amygdala, and other thalamic subnuclei was comparably age independent.
The regional results were tightly concordant with the whole-brain analysis in that median QSM values across striatal, midbrain, and cerebellar nuclei were strongly age correlated (Table 1). Such results were also concordant with past ROI, in vivo MRI (Daugherty and Raz, 2013; Li et al., 2014; Persson et al., 2015; Poynton et al., 2015), and postmortem iron analyses (Hallgren and Sourander, 1958; Ramos et al., 2014) in confirming that the putamen exhibits the tightest age relationship. They also agree with the aforementioned studies and those reviewed previously (Haacke et al., 2005) in that, independent of age, the basal ganglia, red nucleus, and dentate nucleus contain more iron than thalamus, hippocampus, amygdala, cortex, and white matter. It was noted, however, that QSM behaviors in the latter structures were more heterogeneous (Fig. 3), which may explain the conflicting results in, for example, the hippocampus, which was reported to have age-related R2* correlation in one study (Rodrigue et al., 2013; Daugherty et al., 2015).
The strength of a whole-brain approach, however, is that it can capture behaviors beyond those in predetermined ROIs. The most striking observation was that cortex rostral to the central sulcus is more prone to iron accumulation with age than caudal cortices, which is concordant with a previous ROI study using R2* (Rodrigue et al., 2011). This included confluent increases in motor, premotor, dorsal prefrontal, dorsomedial surface, and insula. It is intriguing that, although cortical QSM values are much lower in absolute terms than those in basal nuclei, age-related changes in striatum appear to be mirrored by changes in the frontal lobes; this is interesting given the well known connection of such regions via frontostriatal loops (Alexander et al., 1986). Broadly, most cortical and subcortical areas that accumulate iron are involved in output functions of the brain, motor and decision-making, whereas those involved in sensory processing, such as post-Rolandic cortices and much of the thalamus, do not show this phenomenon. It appears that the motor system, broadly defined, has a tendency to accumulate iron with age.
The exception to this observation was the globus pallidus, which although rich in iron in absolute terms (Fig. 2), did not show age-related QSM increases. In agreement with this result, very few imaging studies have reported stronger age effects in the pallidum compared with the putamen (Daugherty and Raz, 2013). It must be noted, however, that QSM conglomerates effects from all magnetic species, in particular those from comorbid calcification, which in magnetic susceptibility terms counteract paramagnetic moments, could mask the effect of iron accumulation. Although calcium should be considered as a potential confound, it seems highly unlikely that the absence of evidence for iron accumulation in the globus pallidus is spurious because autopsy investigations have also indicated that pallidal iron concentration reaches a plateau before age 50 (Hallgren and Sourander, 1958). Why the pallidum behaves in a different manner is not clear, but it is not hard to find biological differences that might offer clues. For instance, in contrast to its neighboring subcortical nuclei, the afferent input to the globus pallidus is predominantly inhibitory; another difference is its older phylogenetic history: paleostriatum versus neostriatum for caudate and putamen.
The strong correlation of putamenal QSM with age warrants a special mention because a number of studies have also identified metal overload in the AD putamen (Bartzokis et al., 2000; House et al., 2008; Acosta-Cabronero et al., 2013) over and above that seen in aged-matched controls. Incidentally, the striatum has been shown to be the earliest site of fibrillar β-amyloid accumulation in AD (Bateman et al., 2012). Together, these results suggest that the presence of AD pathology severely exacerbates what is otherwise a normal aging process of putamenal iron accumulation.
It has also been postulated that mesencephalic iron overload may be deleterious to normal neuronal activity (Zecca et al., 2004) and could play a pathogenic role in PD (Ostrerova-Golts et al., 2000). The present study supports the notion that midbrain nuclei may be vulnerable, in part through iron accumulation across the adult lifespan, putting them at risk of neurodegenerative disease (Breydo and Uversky, 2011). What makes basal ganglia cells particularly prone to scavenging iron during the course of aging and subsequently in disease is not well understood, although a number of theories, including blood–brain barrier failure or loss of intracellular homeostasis, have been proposed (Ward et al., 2014). Based on present and previous results, one obvious explanation could be that the basal ganglia's vulnerability to iron is simply because it comprises several of the most iron-rich structures in the first place.
This study also found that QSM became significantly more dispersed with age in several nuclei (Fig. 6, Table 1), suggesting that individuals might follow a wide range of age trajectories. This result is consistent with two recent QSM-ROI studies in large aging cohorts that also showed increased variance in the elderly for several subcortical structures (Li et al., 2014; Persson et al., 2015). Such variation might reflect individual differences in iron deposition (including hemosiderin burden) due to genetic (Bartzokis et al., 2010) and/or vulnerability to environmental factors (Hagemeier et al., 2015). Whether this variability could also offer a clue to successful versus nonsuccessful aging remains to be seen, but it certainly seems worth following up in longitudinal studies.
An additional risk factor that has been postulated as a potential contributor to abnormal brain iron accumulation is hypertension (Rodrigue et al., 2011). Therefore, we investigated whether a diagnosis of hypertension would return higher QSM levels than nonhypertensive age-matched controls, but found no support for this prediction. This does not, of course, mean that vascular risk factors may not have a modulatory role in iron accumulation that could emerge with a larger sample, but they are not the primary driver of such age-related changes. In addition, QSM levels in this study did not overall differ between males and females, only slightly in the thalamus. Previous MRI studies identified sex-related iron deposition differences in several brain structures (Bartzokis et al., 2007; Persson et al., 2015), although such subtle sex dependencies have not been reproduced in other in vivo MRI and postmortem analyses (Xu et al., 2008; Ramos et al., 2014).
Several technical aspects regarding the QSM method warrant mention. First, we note the caveat that QSM abnormalities might be attenuated (potentially to the point of being masked) by excessive background susceptibility effects, imperfect QSM inversion, registration errors, and other biases that might introduce excessive variability (Fig. 3). Second, it is worth noting that the outcome of raw and reference-normalized QSM did not differ, suggesting that the effect sizes in aging are much greater than the magnitude of the reference adjustment. Although further confirmation is needed, this is promising news for future studies because it suggests that normalization can be avoided, which is clearly desirable when exploring disease states in which one would wish to avoid making assumptions about areas being spared. The third caveat is that other paramagnetic metals such as copper, manganese, or aluminum could also, in theory, exert a QSM influence (Andrasi et al., 2005; Ramos et al., 2014), although this is quite unlikely in aging in view of their scarcity compared with brain iron (Krebs et al., 2014; Ramos et al., 2014). It was nonetheless reassuring that the concordance of QSM with past postmortem assays was high (Langkammer et al., 2012; Zheng et al., 2013), suggesting that nonheme iron deposition—likely ferric iron (Sun et al., 2015)—is the dominant source of QSM alterations due to aging. Demyelination could, however, play a more active role in modulating QSM alterations (Fukunaga et al., 2010; Stüber et al., 2014). It is interesting that susceptibility was increased both in the cortex and white matter, which is compatible with the idea that myelin loss might result in the attenuation of the lipid-driven diamagnetic component that competes with the effect of ferric iron. The fourth note is, although there was extensive frontal correlation with age, the ventral frontal cortex did not follow this pattern. This could mean the ventral surface does not accumulate iron, but failure to demonstrate age-related iron accumulation in this region may be technical. As with all MRI acquisitions that use gradient echoes, the scan used for QSM suffers from signal loss in areas close to air/bone interfaces; this is particularly true of the ventral frontal lobe, which lies directly above the nasal cavity (Fig. 3). As a final technical note, it is worth pointing out that the basal ganglia alteration observed in this study has consistently been reported using FDRI and R2* mapping (Daugherty and Raz, 2013; Callaghan et al., 2014), although, as mentioned in the Introduction, there are additional limitations with these methods. Whether FDRI, R2* and QSM are completely analogous in their responses to iron-related neurobiological processes (Li et al., 2014; Sun et al., 2015) or differentially sensitive (Deistung et al., 2013) requires further investigation.
To conclude, the present study has demonstrated that the proposed QSM methodology yields reliable measurements of iron deposition in aging. The regional findings were consistent with known patterns of iron load in deep-brain structures and their alterations with aging, whereas the whole-brain approach confirmed that there are additional extensive correlations with age in the frontal lobes. The spatial specificity and remarkable effect sizes further confirm that in vivo QSM is a useful new noninvasive tool with which to investigate cerebral iron accumulation.
Footnotes
We thank all of the participants in this research; Urte Schneider, Sabrina Rädler, and our local radiographers, Kerstin Möhring and Ilona Wiedenhöft, for help in subject recruitment, data collection, and dedicated efforts in scanning standardization and quality assurance; and Oliver Speck for helpful comments on parallel imaging reconstruction.
The authors declare no competing financial interests.
This is an Open Access article distributed under the terms of the Creative Commons Attribution License Creative Commons Attribution 4.0 International, which permits unrestricted use, distribution and reproduction in any medium provided that the original work is properly attributed.
References
- Acosta-Cabronero J, Williams GB, Cardenas-Blanco A, Arnold RJ, Lupson V, Nestor PJ. In vivo quantitative susceptibility mapping (QSM) in Alzheimer's disease. PLoS One. 2013;8:e81093. doi: 10.1371/journal.pone.0081093. [DOI] [PMC free article] [PubMed] [Google Scholar]
- Alexander GE, DeLong MR, Strick PL. Parallel organization of functionally segregated circuits linking basal ganglia and cortex. Annu Rev Neurosci. 1986;9:357–381. doi: 10.1146/annurev.ne.09.030186.002041. [DOI] [PubMed] [Google Scholar]
- Andrasi E, Pali N, Molnar Z, Kosel S. Brain aluminum, magnesium and phosphorus contents of control and Alzheimer-diseased patients. J Alzheimers Dis. 2005;7:273–284. doi: 10.3233/jad-2005-7402. [DOI] [PubMed] [Google Scholar]
- Avants BB, Epstein CL, Grossman M, Gee JC. Symmetric diffeomorphic image registration with cross-correlation: evaluating automated labeling of elderly and neurodegenerative brain. Med Image Anal. 2008;12:26–41. doi: 10.1016/j.media.2007.06.004. [DOI] [PMC free article] [PubMed] [Google Scholar]
- Bartzokis G, Aravagiri M, Oldendorf WH, Mintz J, Marder SR. Field dependent transverse relaxation rate increase may be a specific measure of tissue iron stores. Magn Reson Med. 1993;29:459–464. doi: 10.1002/mrm.1910290406. [DOI] [PubMed] [Google Scholar]
- Bartzokis G, Cummings JL, Markham CH, Marmarelis PZ, Treciokas LJ, Tishler TA, Marder SR, Mintz J. MRI evaluation of brain iron in earlier- and later-onset Parkinson's disease and normal subjects. Magn Reson Imaging. 1999;17:213–222. doi: 10.1016/S0730-725X(98)00155-6. [DOI] [PubMed] [Google Scholar]
- Bartzokis G, Sultzer D, Cummings J, Holt LE, Hance DB, Henderson VW, Mintz J. In vivo evaluation of brain iron in Alzheimer disease using magnetic resonance imaging. Arch Gen Psychiatry. 2000;57:47–53. doi: 10.1001/archpsyc.57.1.47. [DOI] [PubMed] [Google Scholar]
- Bartzokis G, Tishler TA, Lu PH, Villablanca P, Altshuler LL, Carter M, Huang D, Edwards N, Mintz J. Brain ferritin iron may influence age- and gender-related risks of neurodegeneration. Neurobiol Aging. 2007;28:414–423. doi: 10.1016/j.neurobiolaging.2006.02.005. [DOI] [PubMed] [Google Scholar]
- Bartzokis G, Lu PH, Tishler TA, Peters DG, Kosenko A, Barrall KA, Finn JP, Villablanca P, Laub G, Altshuler LL, Geschwind DH, Mintz J, Neely E, Connor JR. Prevalent iron metabolism gene variants associated with increased brain ferritin iron in healthy older men. J Alzheimers Dis. 2010;20:333–341. doi: 10.3233/JAD-2010-1368. [DOI] [PMC free article] [PubMed] [Google Scholar]
- Bateman RJ, Xiong C, Benzinger TL, Fagan AM, Goate A, Fox NC, Marcus DS, Cairns NJ, Xie X, Blazey TM, Holtzman DM, Santacruz A, Buckles V, Oliver A, Moulder K, Aisen PS, Ghetti B, Klunk WE, McDade E, Martins RN, et al. Dominantly Inherited Alzheimer Network. Clinical and biomarker changes in dominantly inherited Alzheimer's disease. N Engl J Med. 2012;367:795–804. doi: 10.1056/NEJMoa1202753. [DOI] [PMC free article] [PubMed] [Google Scholar]
- Bilgic B, Pfefferbaum A, Rohlfing T, Sullivan EV, Adalsteinsson E. MRI estimates of brain iron concentration in normal aging using quantitative susceptibility mapping. Neuroimage. 2012;59:2625–2635. doi: 10.1016/j.neuroimage.2011.08.077. [DOI] [PMC free article] [PubMed] [Google Scholar]
- Block ML, Zecca L, Hong JS. Microglia-mediated neurotoxicity: uncovering the molecular mechanisms. Nat Rev Neurosci. 2007;8:57–69. doi: 10.1038/nrn2038. [DOI] [PubMed] [Google Scholar]
- Breydo L, Uversky VN. Role of metal ions in aggregation of intrinsically disordered proteins in neurodegenerative diseases. Metallomics. 2011;3:1163–1180. doi: 10.1039/c1mt00106j. [DOI] [PubMed] [Google Scholar]
- Callaghan MF, Freund P, Draganski B, Anderson E, Cappelletti M, Chowdhury R, Diedrichsen J, Fitzgerald TH, Smittenaar P, Helms G, Lutti A, Weiskopf N. Widespread age-related differences in the human brain microstructure revealed by quantitative magnetic resonance imaging. Neurobiol Aging. 2014;35:1862–1872. doi: 10.1016/j.neurobiolaging.2014.02.008. [DOI] [PMC free article] [PubMed] [Google Scholar]
- Conturo TE, Smith GD. Signal-to-noise in phase angle reconstruction: dynamic range extension using phase reference offsets. Magn Reson Med. 1990;15:420–437. doi: 10.1002/mrm.1910150308. [DOI] [PubMed] [Google Scholar]
- Cornett CR, Markesbery WR, Ehmann WD. Imbalances of trace elements related to oxidative damage in Alzheimer's disease brain. Neurotoxicology. 1998;19:339–345. [PubMed] [Google Scholar]
- Daugherty A, Raz N. Age-related differences in iron content of subcortical nuclei observed in vivo: a meta-analysis. Neuroimage. 2013;70:113–121. doi: 10.1016/j.neuroimage.2012.12.040. [DOI] [PMC free article] [PubMed] [Google Scholar]
- Daugherty AM, Haacke EM, Raz N. Striatal iron content predicts its shrinkage and changes in verbal working memory after two years in healthy adults. J Neurosci. 2015;35:6731–6743. doi: 10.1523/JNEUROSCI.4717-14.2015. [DOI] [PMC free article] [PubMed] [Google Scholar]
- Deistung A, Schäfer A, Schweser F, Biedermann U, Turner R, Reichenbach JR. Toward in vivo histology: a comparison of quantitative susceptibility mapping (QSM) with magnitude-, phase-, and R2*-imaging at ultra-high magnetic field strength. Neuroimage. 2013;65:299–314. doi: 10.1016/j.neuroimage.2012.09.055. [DOI] [PubMed] [Google Scholar]
- de Rochefort L, Brown R, Prince MR, Wang Y. Quantitative MR susceptibility mapping using piece-wise constant regularized inversion of the magnetic field. Magn Reson Med. 2008;60:1003–1009. doi: 10.1002/mrm.21710. [DOI] [PubMed] [Google Scholar]
- Farrall AJ, Wardlaw JM. blood–brain barrier: ageing and microvascular disease–systematic review and meta-analysis. Neurobiol Aging. 2009;30:337–352. doi: 10.1016/j.neurobiolaging.2007.07.015. [DOI] [PubMed] [Google Scholar]
- Fazekas F, Chawluk JB, Alavi A, Hurtig HI, Zimmerman RA. MR signal abnormalities at 1.5 T in Alzheimer's dementia and normal aging. AJR Am J Roentgenol. 1987;149:351–356. doi: 10.2214/ajr.149.2.351. [DOI] [PubMed] [Google Scholar]
- Fukunaga M, Li TQ, van Gelderen P, de Zwart JA, Shmueli K, Yao B, Lee J, Maric D, Aronova MA, Zhang G, Leapman RD, Schenck JF, Merkle H, Duyn JH. Layer-specific variation of iron content in cerebral cortex as a source of MRI contrast. Proc Natl Acad Sci U S A. 2010;107:3834–3839. doi: 10.1073/pnas.0911177107. [DOI] [PMC free article] [PubMed] [Google Scholar]
- Ghadery C, Pirpamer L, Hofer E, Langkammer C, Petrovic K, Loitfelder M, Schwingenschuh P, Seiler S, Duering M, Jouvent E, Schmidt H, Fazekas F, Mangin JF, Chabriat H, Dichgans M, Ropele S, Schmidt R. R2* mapping for brain iron: associations with cognition in normal aging. Neurobiol Aging. 2015;36:925–932. doi: 10.1016/j.neurobiolaging.2014.09.013. [DOI] [PubMed] [Google Scholar]
- Griswold MA, Jakob PM, Heidemann RM, Nittka M, Jellus V, Wang J, Kiefer B, Haase A. Generalized autocalibrating partially parallel acquisitions (GRAPPA) Magn Reson Med. 2002;47:1202–1210. doi: 10.1002/mrm.10171. [DOI] [PubMed] [Google Scholar]
- Gudbjartsson H, Patz S. The Rician distribution of noisy MRI data. Magn Reson Med. 1995;34:910–914. doi: 10.1002/mrm.1910340618. [DOI] [PMC free article] [PubMed] [Google Scholar]
- Haacke EM, Xu Y, Cheng YC, Reichenbach JR. Susceptibility weighted imaging (SWI) Magn Reson Med. 2004;52:612–618. doi: 10.1002/mrm.20198. [DOI] [PubMed] [Google Scholar]
- Haacke EM, Cheng NY, House MJ, Liu Q, Neelavalli J, Ogg RJ, Khan A, Ayaz M, Kirsch W, Obenaus A. Imaging iron stores in the brain using magnetic resonance imaging. Magn Reson Imaging. 2005;23:1–25. doi: 10.1016/j.mri.2004.10.001. [DOI] [PubMed] [Google Scholar]
- Haacke EM, Mittal S, Wu Z, Neelavalli J, Cheng YC. Susceptibility-weighted imaging: technical aspects and clinical applications, part 1. AJNR Am J Neuroradiol. 2009;30:19–30. doi: 10.3174/ajnr.A1400. [DOI] [PMC free article] [PubMed] [Google Scholar]
- Haacke EM, Liu S, Buch S, Zheng W, Wu D, Ye Y. Quantitative susceptibility mapping: current status and future directions. Magn Reson Imaging. 2015;33:1–25. doi: 10.1016/j.mri.2014.09.004. [DOI] [PubMed] [Google Scholar]
- Hagemeier J, Tong O, Dwyer MG, Schweser F, Ramanathan M, Zivadinov R. Effects of diet on brain iron levels among healthy individuals: an MRI pilot study. Neurobiol Aging. 2015;36:1678–1685. doi: 10.1016/j.neurobiolaging.2015.01.010. [DOI] [PubMed] [Google Scholar]
- Hallgren B, Sourander P. The effect of age on the non-haemin iron in the human brain. J Neurochem. 1958;3:41–51. doi: 10.1111/j.1471-4159.1958.tb12607.x. [DOI] [PubMed] [Google Scholar]
- House MJ, St Pierre TG, McLean C. 1.4T study of proton magnetic relaxation rates, iron concentrations, and plaque burden in Alzheimer's disease and control postmortem brain tissue. Magn Reson Med. 2008;60:41–52. doi: 10.1002/mrm.21586. [DOI] [PubMed] [Google Scholar]
- Koeppen AH. The history of iron in the brain. J Neurol Sci. 1995;134:1–9. doi: 10.1016/0022-510X(95)00202-D. [DOI] [PubMed] [Google Scholar]
- Krebs N, Langkammer C, Goessler W, Ropele S, Fazekas F, Yen K, Scheurer E. Assessment of trace elements in human brain using inductively coupled plasma mass spectrometry. J Trace Elem Med Biol. 2014;28:1–7. doi: 10.1016/j.jtemb.2013.09.006. [DOI] [PubMed] [Google Scholar]
- Kressler B, de Rochefort L, Liu T, Spincemaille P, Jiang Q, Wang Y. Nonlinear regularization for per voxel estimation of magnetic susceptibility distributions from MRI field maps. IEEE Trans Med Imaging. 2010;29:273–281. doi: 10.1109/TMI.2009.2023787. [DOI] [PMC free article] [PubMed] [Google Scholar]
- Langkammer C, Schweser F, Krebs N, Deistung A, Goessler W, Scheurer E, Sommer K, Reishofer G, Yen K, Fazekas F, Ropele S, Reichenbach JR. Quantitative susceptibility mapping (QSM) as a means to measure brain iron? A post mortem validation study. Neuroimage. 2012;62:1593–1599. doi: 10.1016/j.neuroimage.2012.05.049. [DOI] [PMC free article] [PubMed] [Google Scholar]
- Li W, Wu B, Batrachenko A, Bancroft-Wu V, Morey RA, Shashi V, Langkammer C, De Bellis MD, Ropele S, Song AW, Liu C. Differential developmental trajectories of magnetic susceptibility in human brain gray and white matter over the lifespan. Hum Brain Mapp. 2014;35:2698–2713. doi: 10.1002/hbm.22360. [DOI] [PMC free article] [PubMed] [Google Scholar]
- Lin PY, Chao TC, Wu ML. Quantitative susceptibility mapping of human brain at 3T: a multisite reproducibility study. AJNR Am J Neuroradiol. 2015;36:467–474. doi: 10.3174/ajnr.A4137. [DOI] [PMC free article] [PubMed] [Google Scholar]
- Liu T, Wisnieff C, Lou M, Chen W, Spincemaille P, Wang Y. Nonlinear formulation of the magnetic field to source relationship for robust quantitative susceptibility mapping. Magn Reson Med. 2013;69:467–476. doi: 10.1002/mrm.24272. [DOI] [PubMed] [Google Scholar]
- Morozov VA. On the solution of functional equations by the method of regularization. Soviet Math Dokl. 1966;7:414–417. [Google Scholar]
- Morris CM, Candy JM, Oakley AE, Bloxham CA, Edwardson JA. Histochemical distribution of non-haem iron in the human brain. Acta Anat. 1992;144:235–257. doi: 10.1159/000147312. [DOI] [PubMed] [Google Scholar]
- Mugler JP, 3rd, Brookeman JR. Three-dimensional magnetization-prepared rapid gradient-echo imaging (3D MP RAGE) Magn Reson Med. 1990;15:152–157. doi: 10.1002/mrm.1910150117. [DOI] [PubMed] [Google Scholar]
- Ordidge RJ, Gorell JM, Deniau JC, Knight RA, Helpern JA. Assessment of relative brain iron concentrations using T2-weighted and T2*-weighted MRI at 3 Tesla. Magn Reson Med. 1994;32:335–341. doi: 10.1002/mrm.1910320309. [DOI] [PubMed] [Google Scholar]
- Ostrerova-Golts N, Petrucelli L, Hardy J, Lee JM, Farer M, Wolozin B. The A53T alpha-synuclein mutation increases iron-dependent aggregation and toxicity. J Neurosci. 2000;20:6048–6054. doi: 10.1523/JNEUROSCI.20-16-06048.2000. [DOI] [PMC free article] [PubMed] [Google Scholar]
- Patenaude B, Smith SM, Kennedy DN, Jenkinson M. A Bayesian model of shape and appearance for subcortical brain segmentation. Neuroimage. 2011;56:907–922. doi: 10.1016/j.neuroimage.2011.02.046. [DOI] [PMC free article] [PubMed] [Google Scholar]
- Penke L, Valdés Hernandéz MC, Maniega SM, Gow AJ, Murray C, Starr JM, Bastin ME, Deary IJ, Wardlaw JM. Brain iron deposits are associated with general cognitive ability and cognitive aging. Neurobiol Aging. 2012;33:510–517.e2. doi: 10.1016/j.neurobiolaging.2010.04.032. [DOI] [PubMed] [Google Scholar]
- Persson N, Wu J, Zhang Q, Liu T, Shen J, Bao R, Ni M, Liu T, Wang Y, Spincemaille P. Age and sex related differences in subcortical brain iron concentrations among healthy adults. Neuroimage. 2015;122:385–398. doi: 10.1016/j.neuroimage.2015.07.050. [DOI] [PMC free article] [PubMed] [Google Scholar]
- Pfefferbaum A, Adalsteinsson E, Rohlfing T, Sullivan EV. MRI estimates of brain iron concentration in normal aging: comparison of field-dependent (FDRI) and phase (SWI) methods. Neuroimage. 2009;47:493–500. doi: 10.1016/j.neuroimage.2009.05.006. [DOI] [PMC free article] [PubMed] [Google Scholar]
- Poon HF, Calabrese V, Scapagnini G, Butterfield DA. Free radicals: key to brain aging and heme oxygenase as a cellular response to oxidative stress. J Gerontol A Biol Sci Med Sci. 2004;59:478–493. doi: 10.1093/gerona/59.5.m478. [DOI] [PubMed] [Google Scholar]
- Poynton CB, Jenkinson M, Adalsteinsson E, Sullivan EV, Pfefferbaum A, Wells W., 3rd Quantitative susceptibility mapping by inversion of a perturbation field model: correlation with brain iron in normal aging. IEEE Trans Med Imaging. 2015;34:339–353. doi: 10.1109/TMI.2014.2358552. [DOI] [PMC free article] [PubMed] [Google Scholar]
- Ramos P, Santos A, Pinto NR, Mendes R, Magalhães T, Almeida A. Iron levels in the human brain: a post mortem study of anatomical region differences and age-related changes. J Trace Elem Med Biol. 2014;28:13–17. doi: 10.1016/j.jtemb.2013.08.001. [DOI] [PubMed] [Google Scholar]
- Rathore KI, Redensek A, David S. Iron homeostasis in astrocytes and microglia is differentially regulated by TNF-alpha and TGF-beta1. Glia. 2012;60:738–750. doi: 10.1002/glia.22303. [DOI] [PubMed] [Google Scholar]
- Rodrigue KM, Haacke EM, Raz N. Differential effects of age and history of hypertension on regional brain volumes and iron. Neuroimage. 2011;54:750–759. doi: 10.1016/j.neuroimage.2010.09.068. [DOI] [PMC free article] [PubMed] [Google Scholar]
- Rodrigue KM, Daugherty AM, Haacke EM, Raz N. The role of hippocampal iron concentration and hippocampal volume in age-related differences in memory. Cereb Cortex. 2013;23:1533–1541. doi: 10.1093/cercor/bhs139. [DOI] [PMC free article] [PubMed] [Google Scholar]
- Schofield MA, Zhu Y. Fast phase unwrapping algorithm for interferometric applications. Opt Lett. 2003;28:1194–1196. doi: 10.1364/OL.28.001194. [DOI] [PubMed] [Google Scholar]
- Schweser F, Deistung A, Lehr BW, Reichenbach JR. Quantitative imaging of intrinsic magnetic tissue properties using MRI signal phase: an approach to in vivo brain iron metabolism? Neuroimage. 2011;54:2789–2807. doi: 10.1016/j.neuroimage.2010.10.070. [DOI] [PubMed] [Google Scholar]
- Smith SM. Fast robust automated brain extraction. Hum Brain Mapp. 2002;17:143–155. doi: 10.1002/hbm.10062. [DOI] [PMC free article] [PubMed] [Google Scholar]
- Smith SM, Nichols TE. Threshold-free cluster enhancement: addressing problems of smoothing, threshold dependence and localisation in cluster inference. Neuroimage. 2009;44:83–98. doi: 10.1016/j.neuroimage.2008.03.061. [DOI] [PubMed] [Google Scholar]
- Sofic E, Paulus W, Jellinger K, Riederer P, Youdim MB. Selective increase of iron in substantia nigra zona compacta of parkinsonian brains. J Neurochem. 1991;56:978–982. doi: 10.1111/j.1471-4159.1991.tb02017.x. [DOI] [PubMed] [Google Scholar]
- Spatz H. Über den eisennachweis im gehirn, besonders in zentren des extrapyramidal-motorischen systems (On the visualisation of iron in the brain, especially in the centres of the extrapyramidal motor system) Z Ges Neurol Psychiat. 1922;77:261–390. doi: 10.1007/BF02865844. [DOI] [Google Scholar]
- Streit WJ, Miller KR, Lopes KO, Njie E. Microglial degeneration in the aging brain–bad news for neurons? Front Biosci. 2008;13:3423–3438. doi: 10.2741/2937. [DOI] [PubMed] [Google Scholar]
- Stüber C, Morawski M, Schäfer A, Labadie C, Wähnert M, Leuze C, Streicher M, Barapatre N, Reimann K, Geyer S, Spemann D, Turner R. Myelin and iron concentration in the human brain: a quantitative study of MRI contrast. Neuroimage. 2014;93:95–106. doi: 10.1016/j.neuroimage.2014.02.026. [DOI] [PubMed] [Google Scholar]
- Sun H, Walsh AJ, Lebel RM, Blevins G, Catz I, Lu JQ, Johnson ES, Emery DJ, Warren KG, Wilman AH. Validation of quantitative susceptibility mapping with Perls' iron staining for subcortical gray matter. Neuroimage. 2015;105:486–492. doi: 10.1016/j.neuroimage.2014.11.010. [DOI] [PubMed] [Google Scholar]
- Tustison NJ, Avants BB, Cook PA, Zheng Y, Egan A, Yushkevich PA, Gee JC. N4ITK: improved N3 bias correction. IEEE Trans Med Imaging. 2010;29:1310–1320. doi: 10.1109/TMI.2010.2046908. [DOI] [PMC free article] [PubMed] [Google Scholar]
- Walsh DO, Gmitro AF, Marcellin MW. Adaptive reconstruction of phased array MR imagery. Magn Reson Med. 2000;43:682–690. doi: 10.1002/(SICI)1522-2594(200005)43:5%3C682::AID-MRM10%3E3.0.CO;2-G. [DOI] [PubMed] [Google Scholar]
- Wang Y, Liu T. Quantitative susceptibility mapping (QSM): Decoding MRI data for a tissue magnetic biomarker. Magn Reson Med. 2015;73:82–101. doi: 10.1002/mrm.25358. [DOI] [PMC free article] [PubMed] [Google Scholar]
- Ward RJ, Zucca FA, Duyn JH, Crichton RR, Zecca L. The role of iron in brain ageing and neurodegenerative disorders. Lancet Neurol. 2014;13:1045–1060. doi: 10.1016/S1474-4422(14)70117-6. [DOI] [PMC free article] [PubMed] [Google Scholar]
- Winkler AM, Ridgway GR, Webster MA, Smith SM, Nichols TE. Permutation inference for the general linear model. Neuroimage. 2014;92:381–397. doi: 10.1016/j.neuroimage.2014.01.060. [DOI] [PMC free article] [PubMed] [Google Scholar]
- Xu X, Wang Q, Zhang M. Age, gender, and hemispheric differences in iron deposition in the human brain: an in vivo MRI study. Neuroimage. 2008;40:35–42. doi: 10.1016/j.neuroimage.2007.11.017. [DOI] [PubMed] [Google Scholar]
- Zecca L, Stroppolo A, Gatti A, Tampellini D, Toscani M, Gallorini M, Giaveri G, Arosio P, Santambrogio P, Fariello RG, Karatekin E, Kleinman MH, Turro N, Hornykiewicz O, Zucca FA. The role of iron and copper molecules in the neuronal vulnerability of locus coeruleus and substantia nigra during aging. Proc Natl Acad Sci U S A. 2004;101:9843–9848. doi: 10.1073/pnas.0403495101. [DOI] [PMC free article] [PubMed] [Google Scholar]
- Zheng W, Nichol H, Liu S, Cheng YC, Haacke EM. Measuring iron in the brain using quantitative susceptibility mapping and X-ray fluorescence imaging. Neuroimage. 2013;78:68–74. doi: 10.1016/j.neuroimage.2013.04.022. [DOI] [PMC free article] [PubMed] [Google Scholar]