

Abstract
Neuronal activity in the lateral prefrontal cortex (LPFC) reflects the structure and cognitive demands of memory-guided sensory discrimination tasks. However, we still do not know how neuronal activity articulates in network states involved in perceiving, remembering, and comparing sensory information during such tasks. Oscillations in local field potentials (LFPs) provide fingerprints of such network dynamics. Here, we examined LFPs recorded from LPFC of macaques while they compared the directions or the speeds of two moving random-dot patterns, S1 and S2, separated by a delay. LFP activity in the theta, beta, and gamma bands tracked consecutive components of the task. In response to motion stimuli, LFP theta and gamma power increased, and beta power decreased, but showed only weak motion selectivity. In the delay, LFP beta power modulation anticipated the onset of S2 and encoded the task-relevant S1 feature, suggesting network dynamics associated with memory maintenance. After S2 onset the difference between the current stimulus S2 and the remembered S1 was strongly reflected in broadband LFP activity, with an early sensory-related component proportional to stimulus difference and a later choice-related component reflecting the behavioral decision buildup. Our results demonstrate that individual LFP bands reflect both sensory and cognitive processes engaged independently during different stages of the task. This activation pattern suggests that during elementary cognitive tasks, the prefrontal network transitions dynamically between states and that these transitions are characterized by the conjunction of LFP rhythms rather than by single LFP bands.
SIGNIFICANCE STATEMENT Neurons in the brain communicate through electrical impulses and coordinate this activity in ensembles that pulsate rhythmically, very much like musical instruments in an orchestra. These rhythms change with “brain state,” from sleep to waking, but also signal with different oscillation frequencies rapid changes between sensory and cognitive processing. Here, we studied rhythmic electrical activity in the monkey prefrontal cortex, an area implicated in working memory, decision making, and executive control. Monkeys had to identify and remember a visual motion pattern and compare it to a second pattern. We found orderly transitions between rhythmic activity where the same frequency channels were active in all ongoing prefrontal computations. This supports prefrontal circuit dynamics that transitions rapidly between complex rhythmic patterns during structured cognitive tasks.
Keywords: attention, decision making, motion discrimination, prefrontal, visual perception, working memory
Introduction
The prefrontal cortex (PFC) plays an important role in guiding goal-directed behavior and executive control (Miller and Cohen, 2001; Fuster, 2008). It is implicated in spatial working memory (Funahashi et al., 1989) and in selective attention, providing top-down signals to other cortical areas (Moore and Armstrong, 2003; Buschman and Miller, 2007; Salazar et al., 2012; Gregoriou et al., 2014; Mendoza-Halliday et al., 2014; Womelsdorf et al., 2014; Siegel et al., 2015). To carry out these cognitive functions, the PFC has to participate in a variety of computational processes, including the handling of current sensory inputs, the selection and retention of relevant information, and the modulatory control of other brain areas. This can be probed using structured behavioral tasks, in which each sequential task stage poses different demands. For example, in memory-guided discrimination tasks that require the comparison of two temporally separated stimuli, PFC neurons have been shown to reflect sensory, memory, and decision activity (Romo and Salinas, 2003; Zaksas and Pasternak, 2006; Hussar and Pasternak, 2012, 2013).
Single-neuron activity provides evidence about the parameters encoded in brain activity, but its power is too limited to identify different network modes that sustain such code through different stages of the task. Instead, oscillatory activity of the local field potential (LFP) reflects the collective dynamics of neural populations (Buzsáki et al., 2012) and can give insights into PFC function from the network perspective. LFP oscillations in different frequency bands have been related to different aspects of sensory and cognitive processes and to the transmission of information across brain areas. Theta, alpha/beta, and gamma oscillations are the dominant rhythms related to sensory processing in the visual cortex (van Kerkoerle et al., 2014; Bastos et al., 2015). These rhythms are also engaged during decision making and working memory tasks. PFC theta oscillations have been linked to working memory, as they correlate with behavioral performance (Liebe et al., 2012; Lara and Wallis, 2014), and to attentional processing (Tsujimoto et al., 2006). In turn, beta oscillations are associated with top-down processing (Engel and Fries, 2010): selective PFC beta synchronization relates to rule switching and anticipatory attention in discrimination tasks (Zhang et al., 2008; Buschman et al., 2012); and interareal beta-band synchrony increases between the PFC and other cortical areas during top-down attention (Buschman and Miller, 2007; Womelsdorf et al., 2014), and between PFC and MT during working memory (Mendoza-Halliday et al., 2014). Instead, gamma synchronization has been implicated in stimulus-driven bottom-up attention (Buschman and Miller, 2007; but see Gregoriou et al., 2009; Tremblay et al., 2015). Consistent with this view, theta and gamma oscillations in earlier visual areas “drive” theta and gamma oscillations in higher visual areas, while beta activity flow in visual areas is consistent with top-down interactions (Bastos et al., 2015). These studies suggest that the distinct functional engagement of neural circuits imprints characteristic signatures in LFP oscillations. Thus, in the course of a multistage cognitive task, the convergence of multiple computations in the PFC network should result in orderly LFP spectral transitions that provide insight into the underlying network dynamics.
We analyzed LFP data from the lateral PFC (LPFC) of macaques performing memory-guided motion discrimination tasks (Hussar and Pasternak, 2009, 2012, 2013). LFPs signaled the sequential activations of different LPFC network states, as revealed by specific power modulations related to sensory and cognitive parameters within each of the task-relevant LFP bands (theta, beta, and gamma bands). Our results are consistent with topographical representations of decision but not motion parameters, and with transitions between prefrontal circuit dynamics characterized by combinations of LFP oscillatory modes. These different network states may represent prefrontal network processing modes (stimulus-driven vs internal) implicated in the intake and retention of sensory information, and the comparison process that leads to a behavioral decision.
Materials and Methods
Subjects.
We analyzed LFPs recorded simultaneously with spiking activity from the LPFC of two young adult male macaque monkeys (Macaca mulatta). The analysis of the spiking activity recorded from these animals has been previously reported (Hussar and Pasternak, 2009, 2010, 2012, 2013). All training, surgery, and experimental procedures were performed in accordance with the National Institutes of Health Guide for the Care and Use of Laboratory Animals and were approved by the University of Rochester Committee for Animal Research. Animals received fluid reward during times of behavioral testing each weekday, and food was always available in their home cages. Body weights were measured and recorded on a daily basis to monitor the health and growth of the animals.
Visual stimuli and eye position.
Visual stimuli have been described in previous reports (Hussar and Pasternak, 2009, 2010, 2012, 2013). Briefly, the stimuli were presented foveally at the center of a 19 inch monitor (Iiyama Vision Master Pro 513, 75 Hz refresh rate) placed at a distance of 57 cm. Coherently moving random dots (dot diameter, 0.03°; luminance, 15 cd/m2) were placed in a circular 4° aperture with a density of 4.7 dots/deg2. Each dot persisted for the entire stimulus duration. The direction and the speed of motion were chosen according to the behavioral task (see below). Eye position was monitored with an infrared video eye-tracking package (ISCAN), and monkeys were required to maintain fixation within 2° of a centrally presented fixation target in all trials.
Behavioral tasks.
During each recording session, monkeys performed a series of four behavioral tasks in blocks of ∼200 trials each: one direction discrimination task, one speed discrimination task, and two passive fixation tasks, each involving stimuli and presentation sequences identical to those used during each discrimination task. Each task was cued by a distinct fixation target (Fig. 1).
Figure 1.

Behavioral tasks and behavioral performance. A, Behavioral tasks. Monkeys report either whether the direction (top) or the speed (bottom) of two consecutive random-dot motion stimuli (S1 and S2) were the same or different by pressing one of the two response buttons. The animals were allowed to respond 1000 ms after the termination of the second stimulus (S2). Stimulus speed did not change in the direction task, and stimulus direction did not change in the speed task. Task difficulty was controlled by varying the direction (speed) differences between S1 and S2. During the corresponding passive fixation tasks (data not shown), stimulus conditions were identical but the monkeys were rewarded for maintaining fixation throughout the trial without a choice report. Each task was signaled by a different fixation target. B, Percentage of different reports (left button presses) for two monkeys performing the direction (top) and the speed discrimination task (bottom) as a function of the difference between S1 and S2. For the direction task, the stimulus difference was the direction difference between S1 and S2 and data were collected during 57 recording sessions with 10,897 trials in total. For the speed task, the stimulus difference was the relative speed difference Δv/v, where v is the base speed (2 or 4°/s), and data were collected during 70 recording sessions with 14,649 trials.
The structure of the direction discrimination task (Fig. 1A, top) has previously been described in detail (Hussar and Pasternak, 2009). Each trial began with the presentation of a central fixation target (a small circle) and the subjects were required to maintain fixation until its offset at the end of the trial. After this, the monkeys were rewarded for reporting whether two random-dot stimuli, S1 and S2, moved in the same or different directions by pressing one of two adjacent response buttons: the right button to report the same directions and the left button to report different directions. For each recording site, we defined two main directions of motion, 180° apart from each other, as the preferred and antipreferred directions of the single unit simultaneously recorded with the LFP if the single unit showed direction tuning, and randomly otherwise (for details, see Hussar and Pasternak, 2009, 2012). All “different” direction trials (D-trials) included one stimulus (either S1 or S2) moving in one of the two main directions and the other stimulus was drawn randomly from a set of offset directions (in the range of 10 to 90° clockwise relative to the main direction in that trial). The specific discrete directions in this set were chosen independently for each monkey based on behavioral performance (Fig. 1B). In “same” direction trials (S-trials), both S1 and S2 stimuli moved in any of the main or the offset directions. The task included equal number of S-trials and D-trials, randomly intermixed. Stimulus speed was the same for S1 and S2, and for each site it was fixed to either 2 or 4°/s. For each site, this choice of speed was then defined as the base speed in the speed discrimination task.
During the speed discrimination task, signaled by a distinct fixation target (a small triangle), S1 and S2 moved either at the same or different speeds (Fig. 1A). The monkeys were rewarded for reporting the two speeds as different or same by pressing the corresponding left or right response button. In all trials, S1 or S2 moved at the base speed of 2 or 4°/s mentioned above, and the other stimulus moved at a speed ranging from the base speed to 16°/s (for details, see Hussar and Pasternak, 2013). Task difficulty was controlled by varying the difference in stimulus speed between S1 and S2, expressed as the Weber fraction Δv/v (Fig. 1B). Stimulus directions of S1 and S2 were the same within a given trial but varied randomly from trial to trial between the two main directions used in the direction discrimination task.
The timing and stimulus conditions in the passive fixation tasks were identical to those in the active direction or speed discrimination tasks. During these tasks, the monkeys were rewarded just for maintaining fixation on a distinct fixation target (a small X) throughout the trial and were not required to report “same” and “different” choices with a button press.
Physiological recordings.
Recording locations on the left hemisphere were identified from structural MRI scans. Spiking activity and LFPs were recorded from the same tungsten glass-coated microelectrode (0.5–3 MΩ at f = 1 kHz; Alpha Omega Engineering). Data from isolated single neurons recorded from these locations have been previously analyzed (Hussar and Pasternak, 2009, 2010, 2012, 2013). Electrodes were positioned over the chamber-enclosed craniotomy using a Cilux grid with 1 mm spaced openings (Crist Instruments). Custom-made steel guide tubes were inserted into the hole chosen for each day's recording to provide structural stability. Guide tubes were lowered to the dura but did not penetrate. Electrodes were driven through the dura using either a hydraulic micromanipulator (Narashigi Group) or a NAN electrode drive (NAN Instruments). The guide tube was used as the reference electrode for the LFP recordings. The signal was hardware-amplified (1000×). Recordings were obtained with Plexon Multichannel Acquisition Processor (MAP) systems working concomitantly with the Windows-based real-time data acquisition system Tempo (Reflective Computing). Two setups were used to collect LFPs. In one setup, a Plexon HST/8o50-G1-TR headstage was connected to a Plexon PBX/16FP-G500 preamplifier incorporating two one-pole Butterworth filters with nominal fcut = 3.3 Hz (high-pass) and fcut = 88 Hz (low-pass), respectively. In the other setup, a Plexon HST/8o50-G20 headstage was connected to a Plexon PBX2/16FP-G50 preamplifier with a two-pole high-pass Butterworth filter with nominal fcut = 0.7 Hz and a four-pole low-pass Butterworth filter with nominal fcut = 170 Hz. The data were digitized at fs = 1 kHz and stored for off-line analysis. We were aware of the possible voltage-divider effect of the HST/8o50-G20 headstage (Nelson et al., 2008), so we confirmed that the results were analogous for recordings obtained from each of the two setups, as done in other studies (Gregoriou et al., 2009).
LFP preprocessing.
To compensate for the frequency-dependent phase shifts introduced by the causal filtering performed by the preamplifiers at the time of data acquisition, LFP data recorded using both setups (see above) were filtered noncausally (i.e., in time-reverse order) using Plexon's FPAlign utility. The power line noise around f0 = 60 Hz was removed by filtering the signal, using the method described in Zanos et al. (2011), so that the power at 60 Hz was similar to that of surrounding frequencies (f0 ± 5 Hz).
Further preprocessing required minimizing the amount of power leaking from the high-frequency domain (i.e., the band from where spikes are extracted and sorted) into the LFP frequency region, especially into the gamma band (Zanos et al., 2011; Buzsáki et al., 2012). Although causal filtering of the raw signal performed by the early stages of the MAP system and the ensuing use of FPAlign attenuated much of this power, part of it still remained in the highest frequency components of the filtered LFP signal (Zanos et al., 2011). To decorrelate LFP signals from spikes, we used the method described in David et al. (2010), which removed spike-like artifacts in the spike-triggered LFP more consistently compared with other methods (Pesaran et al., 2002; Galindo-Leon and Liu, 2010; Okun et al., 2010). This technique subtracts the convolution of a spike-LFP filter with the binary signal drawn from the spike timestamps (“1” if there is a spike at a given time; “0” otherwise) from the original LFP to yield a “cleaned” LFP that is free from linear interactions with spikes. Despite these steps, there is still a possibility of some residual contribution of spiking activity to LFP power in the gamma band. However, it is unlikely that the task-related activity that we observed in the gamma band is mainly reflecting the contamination from strongly selective single-unit activity, since we observed a higher incidence of LFP-gamma comparison signals than of S1 direction selectivity, exactly the opposite pattern observed for spiking activity (see Fig. 11).
Figure 11.

Comparison of LFP and spiking activity recorded throughout the task. Incidence of stimulus selectivity during S1 and delay, and CEs during S2 and post-S2 in different LFP bands and spiking activity, in the direction (N = 57 site–neuron pairs) and speed task (N = 70 site–neuron pairs). Statistical significance was determined based on surrogate data with trials shuffled between the relevant conditions (S1 stimulus for selectivity and trial type for CEs). Solid horizontal lines indicate the proportion of significant sites expected by chance and dashed horizontal lines indicate the corresponding 95th percentiles.
Spectral analysis of LFP signals.
To remove the contributions of signal components phase-locked to trial events (event-related evoked potentials), we first subtracted the trial-averaged raw LFP signal from the signal recorded in each trial (Kalcher and Pfurtscheller, 1995). This correction was performed with respect to the different S1 directions or speeds when analyzing direction or speed selectivity, and with respect to the trial type (S-trial or D-trial) when analyzing comparison effects (CEs). Temporal fluctuations in the LFP signals were then quantified by estimating time-dependent power spectra S(f, t) with multitaper spectral analysis methods (Mitra and Bokil, 2008) using the Chronux analysis software (http://www.chronux.org). We mainly used sliding windows of duration T = 250 ms, a bandwidth W = 4 Hz, and one Slepian taper. Repeating the analyses with windows T = 500 ms, a bandwidth of W = 4 Hz, and three tapers yielded essentially the same results. To examine LFP responses in the context of our task, we combined the spectral power across frequencies in the following bands: 4–8 Hz (LFP theta), 12–30 Hz (LFP beta), and 50–85 Hz (LFP gamma). This was achieved by averaging over the narrow bands obtained for W = 4 Hz that lie within the corresponding window (Mendoza-Halliday et al., 2014).
Spike-triggered average of the LFP signals.
To highlight the neurophysiological significance of oscillatory dynamics in the LFP, we computed the spike-triggered average (STA; Fig. 2E,F) of the preprocessed LFP signal by averaging LFP fragments of length ΔT around the time of simultaneously recorded spikes. For this analysis, we used sites recorded during the direction discrimination task for which the isolated single neuron had ≥10 trials with >10 spikes during the 1000 ms fixation period preceding S1. Trials with <10 spikes during fixation were discarded. The number of rejected sites depended on ΔT, because spikes occurring before the onset or after the end of fixation ±ΔT/2 could not be included in the analysis, as the corresponding LFP signals would extend beyond the fixation period. This criterion rendered 54 of 57 sites for ΔT = 200 ms (Fig. 2E) and 28 of 57 in the case of ΔT = 600 ms (Fig. 2F). The whole LFP signal from each selected site was high-pass filtered (noncausal Butterworth filter with fstop = 3.5 Hz, fpass = 5 Hz, and Astop = 80 dB) to remove the slowest components (f < 4 Hz) left by the one-pole preamplifier and by the low fcut value of the high-pass filter in the two-pole and four-pole preamplifier, yielding a nonattenuated LFP-STA between f = 5 Hz and f = 88 Hz (Fig. 2E). To obtain the data shown in Figure 2F, we used a noncausal digital bandpass elliptic filter instead, with fstop, low = 4.5 Hz, fpass, low = 5 Hz, fpass, high = 8 Hz, fstop, high = 8.5 Hz, Astop = 80 dB (on low and high cuts), and Apass = 0.01 dB. For each site, we z-scored the LFP signal across all selected trials to standardize the population. Error bars were computed using bootstrap across sites, with 1000 repetitions.
Figure 2.

Modulation of LFPs in the LPFC during the direction comparison task. A, Single-trial LFPs from a sample site (601_080305g) recorded during the direction discrimination task. Shadings indicate the stimulus periods. B, Trial-averaged LFP power spectrum (N = 175 trials) in the fixation and the delay periods of the same recording site as in A. C, Population-averaged spectrogram (N = 57 sites recorded in both monkeys) for the direction discrimination task. Spectrograms (window size, 500 ms) were normalized to the baseline activity at t = −0.5 s (relative to S1 onset), and then averaged across sites. D, Histogram of the peak frequency during fixation. A majority of sites (N = 44 of 57 sites) showed a peak in LFP power in the beta range (average peak frequency ± SEM, 18.1 ± 0.6 Hz). E, Population-average of the spike-triggered average (STA) of the LFP obtained during the fixation period (N = 47 STA LFPs for neurons with a sufficient number of spikes, from 44 recording sites; see Materials and Methods) showed the locking of spikes and LFP oscillations in the beta range. F, Population average of the STA of the LFP, filtered to reveal the relationship between spike timing and LFP-theta oscillations (see Materials and Methods). The locking between LFPs and spikes was stronger in Monkey 2 but also present in Monkey 1. Error bars are the SEMs obtained using bootstrap.
Analysis of LFP activity throughout the task.
Modulation of LFP activity in the theta, beta, and gamma frequency bands was examined in the different phases of the trial during direction and speed comparisons and passive fixation tasks. For each recording site, the LFP power in each frequency band was normalized by subtracting the average power in the corresponding frequency band recorded during the fixation period (in a 250 ms window centered 625 ms before S1 onset).
To compare the responses during S1 and S2 in the discrimination tasks to the passive fixation task we modeled the LFP responses with mixed-effects ANOVAs with the following factors: task (direction or speed), condition (active or passive), epoch (S1 or S2), monkey, and site identity (as random factor). The number of sites in these analyses was as follows: N = 31 (15 from Monkey 1) in the direction task and the corresponding passive task, and N = 24 (13 from Monkey 1) in the speed task and the corresponding passive task. For the comparison of the activity during S1 and S2 recorded during the two discrimination tasks, we included the data for all available sites for the direction (N = 57 sites; 24 from Monkey 1) and the speed discrimination task (N = 70 sites; 33 from Monkey 1).
The modulation of LFP theta during delay and post-S2 periods was assessed with a 250 ms window centered at 700 ms after the onset of S1 and S2. To test statistical significance, we used mixed-effects ANOVA models identical to the ones used above but with an additional factor, epoch (delay/post-S2).
Anticipatory modulation of LFP-beta.
The timing of the events in our tasks was constant (Fig. 1A) and, thus, the onset of the stimuli S1 and S2 was highly predictable. We examined whether the LFP-beta power reflected this predictability by comparing the activity recorded in periods leading to the onset of S1 and S2 during the two discrimination tasks and the passive fixation task. For each site, we used a 250 ms window and computed the difference in beta modulation recorded in the middle (625 ms before S1 onset) and at the end (125 ms before S1 onset) of the fixation period. Similarly, for the period preceding the onset of S2, we computed the difference in activity in the middle of the delay (1.375 s after S1 onset) and just before the onset of S2 (1.875 s after S1 onset). Statistical significance was assessed using a mixed-effects ANOVA model, similar to the ones described above, but with the factor epoch (pre-S1/pre-S2).
Direction selectivity.
Direction-selective activity was assessed for each frequency band by comparing LFP power recorded during S1 on trials with motion in the two main directions used in each session (see Behavioral tasks). For each site, we compiled a receiver operating characteristic (ROC) and computed the area under the ROC (AROC) as a measure of selectivity (Britten et al., 1992). The AROC corresponds to the probability that an ideal observer correctly predicts the stimulus direction given a sample from the set of responses to the two main motion directions. AROC values range between 0 and 1, where AROC = 0.5 indicated activity that did not systematically differ between trials, while AROC > 0.5 indicated higher activity for one direction and AROC < 0.5 indicated higher activity for the other direction. Significance of AROCs was evaluated using permutation tests based on 1000 shuffles of trials associated with each of the two directions. To compare the selectivity across frequency bands and task epochs, we computed corrected AROCs by subtracting the mean AROC obtained for shuffled surrogates as follows: AROCcorrected = AROC − AROCshuffle + 0.5. The proportion of sites with significant direction selectivity during the S1 and delay periods (see Fig. 11) was determined using the following criterion: AROC values for each site were computed for sliding 250 ms windows in 10 ms steps, and sites were categorized as significantly selective if they had ≥7 time bins of significant activity (AROC ≠ 0.5 with p < 0.01, permutation test). For S1 selectivity, AROC was assessed during the period of 0.1–0.6 s after S1 onset, while for delay selectivity, AROC was assessed during the period of 0.5–1.375 s after S1 offset. Direction selectivity in single unit spiking activity was quantified exactly the same way, using sliding 250 ms spike count windows with 10 ms steps.
Speed selectivity.
During the speed task, both comparison stimuli moved in either of the two opposing main directions. For each site, selectivity for speed was quantified from LFP power recorded in response to S1. We computed AROCs comparing responses to the lowest speed (the base speed) with responses to the two highest speeds combined. We z-scored the distributions of activity for the two directions before combining the trials according to the stimulus speed. Statistical significance was assessed as described above for LFP activity recorded during the direction task. Speed selectivity in single-unit spiking activity was quantified exactly the same way, using sliding 250 ms spike count windows with 10 ms steps.
CEs during and after S2.
The direction discrimination task contained two types of randomly interleaved trials: in half of the trials, S1 and S2 moved in the same direction (S-trials), and in the other half they moved in different directions (D-trials). Similarly, in the speed discrimination task, S1 and S2 either moved at the same speed (S-trials) or at different speeds (D-trials). To examine whether LFP power during and after S2 was affected by the preceding S1, we compared the LFP power in these two types of trials. This analysis was performed separately for the direction and the speed discrimination tasks. We called the differences in LFP power during the two types of trials a “comparison effect” (CE) because they likely reflected the sensory comparison process required by the tasks. Because LFPs were only very weakly selective for stimulus direction or stimulus speed (see Fig. 5), we combined S-trials and D-trials across the direction or speed of the S2 stimulus. To rule out the effects of stimulus selectivity during S2 on CEs (Hussar and Pasternak, 2012, 2013), we z-scored the data and repeated all analyses only on trials in which the S2 stimulus moved at the base speed and in each of the two main directions. The results for the z-scored data closely matched the results obtained from the combination of all trials, but they were noisier due to the reduced number of trials. Differences between S-trials and D-trials were evaluated with ROC analysis, using 250 ms windows. Sites with AROC values >0.5 showed stronger power in S-trials than in D-trials, while sites with AROC <0.5 showed stronger power in D-trials. The ROC analysis was performed using D-trials with large direction differences (>60° for Monkey 1 and >43° for Monkey 2) or large speed differences Δv/v (Δv/v > 1.2 for Monkey 1 and Δv/v > 2.3 for Monkey 2). These stimulus differences were chosen depending on the range of stimulus values used during the recordings, which had been selected based on each animal's performance (Hussar and Pasternak, 2012, 2013). Both monkeys responded correctly in a large fraction of trials with the chosen stimulus differences (direction and speed task: Monkey 1, 84.6 and 88.6%; Monkey 2, 94.9 and 93.3%, respectively). To identify periods of CEs, we computed AROC values by sliding 250 ms windows in 10 ms steps across LFP activity. Sites were categorized as S > D (same > different) if they had ≥7 time bins of significant S > D activity (AROC > 0.5 with p < 0.01, permutation test) in the interval from 0.2 to 1.2 s after the onset of S2. Similarly, sites were categorized as D > S (different > same) if they had ≥7 time bins of significant D > S activity (AROC < 0.5 with p < 0.01, permutation test) in the interval from 0.2 to 1.2 s after the onset of S2. If a site showed both S > D and D > S activity, the effect with the longest duration determined the categorization. Sites that did not meet these criteria were categorized as nonselective. For an easier comparison of the magnitude and the time course of S > D and D > S effects, sites with peak AROC modulation <0.5 were reflected around 0.5 (i.e., were replaced by 1 − AROC) in Figures 7 and 8. For each site and each frequency band, the magnitude of the CE was computed as the average over AROC values in the 300 ms window with the highest effect (see Figs. 7C,F, 8C,D, 12A). We defined the time point at the center of this window as the time of the maximum CE (see Figs. 7B,E, 12B). CEs in single-unit spiking activity were determined as described previously (Hussar and Pasternak, 2012, 2013) using sliding 250 ms spike count windows with 10 ms steps.
Figure 5.
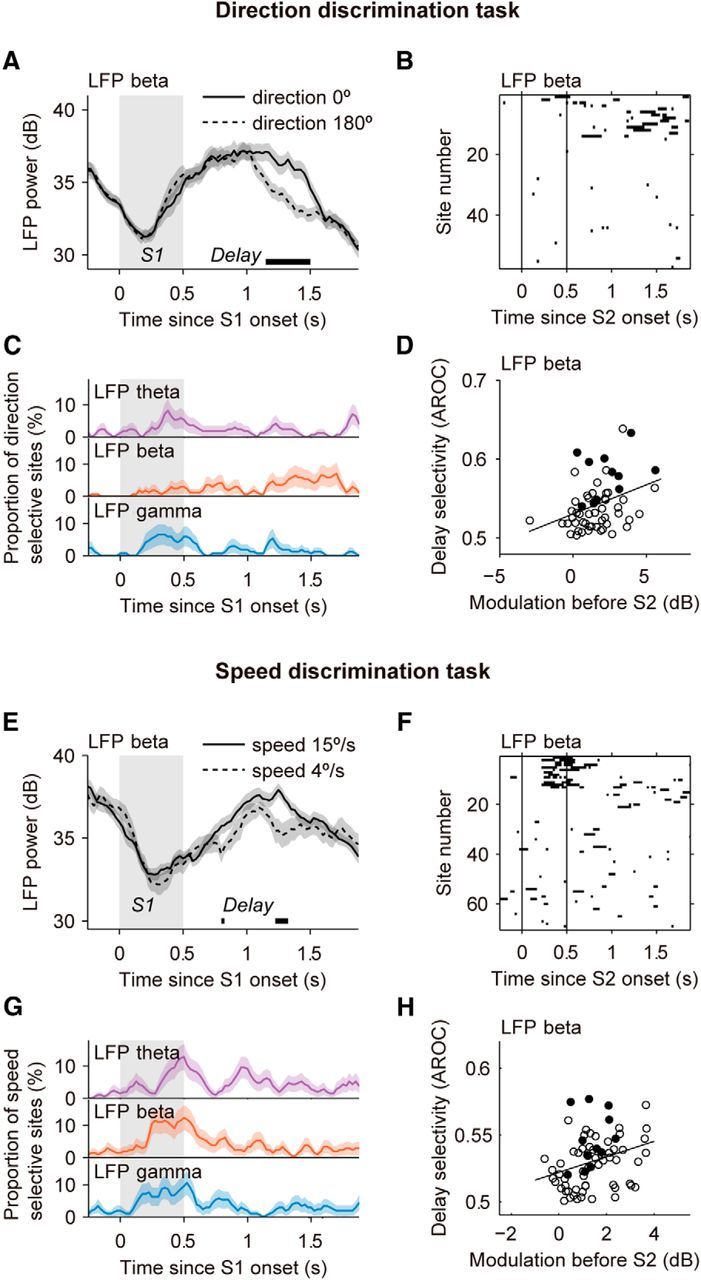
Selectivity for motion direction and speed during the S1 and delay periods. A, Example site (601_070926g) showing stimulus-selective LFP-beta activity during the delay phase of the direction comparison task for trials with S1 stimuli moving in opposite directions (thick horizontal line; p < 0.01). B, Direction selectivity in the beta band for all sites (N = 57), quantified using ROC analysis for each time bin (window size T = 250 ms; see Materials and Methods). Point-wise significance was tested with permutation tests (AROC different from 0.5; p < 0.01). C, Incidence of sites with significant direction selectivity in the theta, beta, and gamma bands in the population (N = 57). D, Relationship between modulation of LFP beta before the onset of stimulus S2 (Fig. 4) and direction selectivity at the end of the delay, from t = 1.375 to 1.875 s after S1 onset. Filled circles indicate sites that were classified as significantly delay-selective (see Materials and Methods). E, Example site (601_080725b) showing stimulus-selective LFP-beta activity during the delay in the speed comparison task, for trials in which the S1 stimuli moved either at 4 or 15°/s. F–H, Same as B–D but for speed selectivity (N = 70 sites). Speed selectivity was weak but above chance level in all three frequency bands during the S1 period and during the delay. As for the direction task, speed selectivity in LFP beta during the delay was correlated with anticipatory modulation before S2 (H). Shadings indicate the stimulus periods. Error bars are the SEM obtained using bootstrap.
Figure 7.
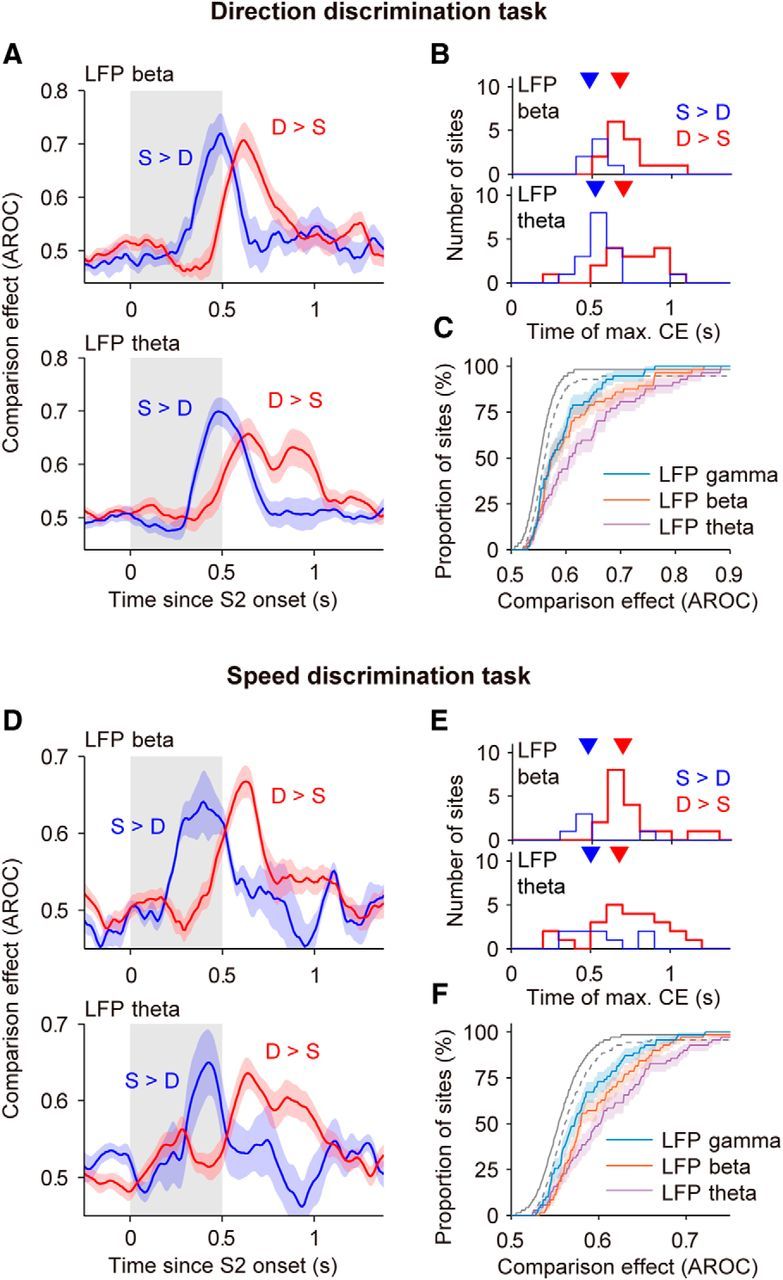
CEs in LFPs in the direction and speed comparison tasks. A, Top, Average CE in LFP beta in the direction task for S > D sites (blue) and D > S sites (red) from Figure 6B. The CE of sites with D > S were reflected above 0.5 (CE′ = 1 − CE; see Materials and Methods). Bottom, Average CE in LFP theta for S > D sites (N = 17) and D > S sites (N = 18). B, Times of maximal CEs in LFP beta and LFP theta. Only significant CEs were used for this analysis. CE reached its maximum earlier in S > D sites (blue and red triangles point to the mean times; LFP beta: 484 vs 676 ms; LFP theta: 530 vs 708 ms; Wilcoxon rank-sum test, LFP beta, p = 0.0038, z = −2.89; LFP theta, p = 0.002, z = −3.09). C, Cumulative distributions of CEs for different frequency bands (N = 57). For each site, we took the average CE in the 300 ms window with the strongest effect. Chance level was estimated from surrogate data with trials shuffled between the two trial types (see Materials and Methods; dark gray line: median cumulative distribution obtained from surrogate data; dashed gray line: 99% percentile of the cumulative distributions obtained from surrogate data). D, Top, LFP beta. Average CEs in the speed task for S > D sites (blue; N = 5) and D > S sites (red; N = 18). Bottom, LFP theta. Average CEs for S > D sites (N = 9) and D > S sites (N = 25). E, Times of maximal CEs in LFP beta (S > D: 475 ms; D > S 694 ms) and LFP theta (S > D: 501 ms; D > S: 681 ms) in the speed task. Latency for D > S sites was significantly longer for both bands (Wilcoxon rank-sum test; LFP beta: p = 0.028, z = −2.20; LFP theta: p = 0.037, z = −2.09). F, Cumulative distributions of CEs for different LFP bands in the speed task (N = 70). For details see C. Colored shadings represent the SEM. The periods of S2 are shown with gray shadings.
Figure 8.

Attenuation of CEs during the passive fixation task. A, Average CE in LFP beta during the direction task and during passive fixation for sites with significant CE and a sufficient number of trials in both tasks (N = 15 sites). B, Average CE in LFP beta during speed discrimination and during passive fixation (N = 9 sites). C, D, Site-by-site CE in LFP theta (C) and LFP beta (D) during both comparison tasks and during the corresponding passive fixation task. CEs were weaker during the passive task in LFP theta (Wilcoxon test, p = 9.3 × 10⁻⁵, N = 36, z = −3.91) and LFP beta (Wilcoxon test, p = 0.001, N = 24, z = −3.29). The trial-type preference (S > D or D > S) was determined from the task condition. Black symbols (“none”) mark sites that showed a significant CE only during passive fixation and sites that had a significant CE during the passive condition opposite to the CE in the task condition (4 of 36 sites in C; 3 of 24 sites in D).
Figure 12.

CEs in LFPs and in spiking activity. A, CE in spiking activity vs LFP theta for site–neuron pairs with significant CE in both measures (N = 33). The majority of site–neuron pairs (N = 21) showed opposite preference for trial type in LFP theta and spikes, resulting in a negative correlation between the CE in spiking activity and in LFP theta (Pearson's correlation, r = −0.36, p = 0.039, N = 33). B, Correlation between the time of maximal CE in spiking activity and the time of maximal CE in LFP theta for sites and neurons with opposite polarity of CE (Pearson's correlation, r = 0.53, p = 0.013, N = 21 sites/cells). Site–neuron pairs with congruent polarity of CE showed no such correlations in the latency of maximal CE (Pearson's correlation, r = 0.03, p = 0.93, N = 12; data not shown). C, D, Average time course of the CE for sites with D > S (S > D) preference in LFP (spikes) and for sites with S > D (D > S) preference in LFP theta (spikes).
Linear mixed-effects model.
To examine the contribution of sensory comparison and choice-dependent signals to the responses during and after S2, we described the LFP spectral power time series in a given frequency band Yi in trial i by fitting a linear mixed-effects model (McCulloch et al., 2008) at every 10 ms time step. This is expressed as follows:
 |
where XTask, XSensory, and XDecision are the fixed-effect predictor variables corresponding, respectively, to the type of task (direction or speed), the stimulus difference (direction difference Δd in the direction task and speed difference Δv/v in the speed task), and the behavioral report (left or right button press). The parameters β (regressors) were estimated from the data by fitting the model and quantifying the slope of the relationship between spectral power and the corresponding predictor variable. To account for different sensory (or decision) regressor values according to tasks, we included all possible interaction terms between the predictors. Because the recordings were acquired with single electrodes in different penetrations and on different days, the intertrial variability was likely to be much smaller than the intersite variability. Thus, we considered the trials belonging to the same site as equivalent and regarded the sites as the source of random effects, modeled by the random effects term G. The error variable ε was assumed to be drawn from N (0, σ2 · 1), with σ2 the variance of the elements of the disturbance term. We therefore assumed that sites were random representatives of a general population of sites with common dependencies β with the predictors XTask, XSensory, and XDecision. Based on our AROC analyses (see above; see Fig. 6B), this assumption required that we fit separate models for sites with significant S > D and D > S CEs and for nonselective sites. In addition we fitted LFP-theta and LFP-beta activity separately, yielding a total of six full-model fits. The LFP power of all trials was z-scored independently for each site. The predictor variables were also z-scored, and XSensory was z-scored independently for each task. SEMs of the estimated coefficients of determination R2 and regression coefficients (see Fig. 10) were obtained by fitting the model to 1000 bootstrap samples drawn with replacement from the recording sites. We obtained reduced models by dropping one of the three fixed-effect predictors at a time. To determine which model explained the data best, we compared them to the full model using the likelihood (L) ratio test D = 2 · [ln (Lfull) − ln (Lreduced)], and obtained a p value according to p = 1 − CDFχ2 (D, N − n), with N and n the degrees of freedom of the full and the reduced model, respectively (in all cases N − n = 3). The reduced model was considered different from the full model when the test yielded p < 0.01 in ≥3 consecutive time steps.
Figure 6.

Two types of CEs during and after the stimulus S2 in the direction task. A, Example LFP-beta responses during S2. Top, This site shows higher LFP power on S-trials containing the same directions in S1 and S2 (S > D). Bottom, This site shows higher LFP power on D-trials containing different directions in S1 and S2 (D > S). Thick horizontal lines indicate periods of significant differences between responses on S-trials and D-trials quantified with ROC analysis (p < 0.05; blue: S > D; red: D > S). B, CE in LFP beta during S2 (N = 57 sites). AROC values >0.5 correspond to higher LFP power in S-trials, and AROC values <0.5 to higher LFP power in D-trials. Sites were sorted by timing and the type of CE. Dashed horizontal lines delimit the sites with significant S > D effect (N = 7 sites) and D > S effect (N = 15 sites).
Figure 10.

Sensory and decision components of CEs in a linear mixed-effects model. A, Quality of the model fit (R2) for LFP-theta activity after S2 onset, computed separately for S > D sites (blue, N = 17 sites), D > S sites (red, N = 30 sites), and nonselective sites (gray, N = 36 sites). Periods with high R2 indicate those moments in which our model best fits the data. Data from the direction and the speed task were combined. The model incorporates the fixed-effects stimulus difference (βSensory), choice report (βDecision), task (βTask), and their interactions (see Materials and Methods). B, Slopes of the relationship between LFP theta and the sensory predictor variable as a function of time, regressors βSensory(t), for the two linear models in A, corresponding to sites with D > S (red) and sites with S > D (blue). Horizontal bars indicate periods with a significant contribution of βSensory (i.e., a reduced model in which the sensory predictor was removed provided a significantly worse fit to LFP-theta activity than the full model; p < 0.01, log-likelihood ratio test; see Materials and Methods). C, Slopes of the relationship between LFP theta and the decision predictor variable as a function of time, βDecision. D–F, Same as A–C for LFP-beta activity, for N = 10 sites with S > D, N = 27 sites with D > S, and N = 46 nonselective sites. Gray shadings indicate the stimulus period S2.
All data analyses were carried out in Matlab (Mathworks).
Results
We recorded the LFP activity in the LPFC of two monkeys performing four behavioral tasks: comparisons of motion directions, comparisons of speeds, and two passive fixation tasks using identical stimuli as in the corresponding comparison task (Fig. 1A). Each task was cued by a distinct fixation target, and tasks were run in blocks of trials in which monkeys viewed two successive random-dot stimuli while maintaining fixation (see Materials and Methods). The differences in motion direction between the two random-dot stimuli in the direction task and the speed differences in the speed task were chosen to bracket each animal's threshold (Fig. 1B). Monkey 1 was less accurate in judging stimulus differences than Monkey 2 in the direction task and was therefore tested with larger direction differences, and the reverse was true for the speed task (Fig. 1B). This allowed us to compare data from the two monkeys under similar behavioral demands. While they performed the task, LFP data was acquired from penetrations in the posterior region of the LPFC, largely below and behind the principal sulcus (Hussar and Pasternak, 2012, 2013). All LFP analyses were based on the data from 57 sites recorded during the direction comparison task and from 70 sites recorded during the speed comparison task.
LFP activity tracks consecutive task components
By temporally aligning the LFPs to the events of the task, clear task-related signal modulations were visible even in the raw signal of some individual sites (Fig. 2A). Particularly prominent were periods with slow large-amplitude oscillations in the 2–8 Hz range following the periods of visual stimulation (S1 and S2). This was captured with spectral analysis, with a marked increase of the spectral peak in these frequencies during the delay period relative to the fixation period of the task (Fig. 2B). In addition, the power spectrum revealed other significant dynamics in the LFP: a marked oscillation in the 10–30 Hz range that characterized both the fixation and delay periods of the task (Fig. 2B,C), and was common to a majority of sites in our database (44 of 57 sites; Fig. 2D). We determined the specific task-related modulations by computing a time-resolved spectral analysis at the population level that contrasted spectral activity at each time point during the task with that characteristic of the fixation period (Fig. 2C). This analysis showed that for the majority of our sites, the various stages of the task affected oscillatory LFP activity differentially in three distinct nonoverlapping frequency bands: 4–8 Hz (LFP theta), 12 –30 Hz (LFP beta), and 50–85 Hz (LFP gamma). It should be noted that the definition of theta, beta, and gamma frequency bands differs across the literature (Bressler and Richter, 2015), so that our beta band might include “high alpha” at the low end and “low gamma” at the high end. In our task, we did not observe a separate alpha band (∼8–12 Hz) that could be clearly distinguished from the adjacent theta and beta bands.
Theta band power increased during the delay (Fig. 2C) and was related to oscillations in the underlying neural activity, as revealed by an STA in the delay after S1 (Fig. 2F), showing how simultaneously recorded single-neuron spikes were locked to the phase of LFP-theta oscillations. These oscillations were particularly prominent in one of the two monkeys (Fig. 2F). Beta-frequency oscillations were also modulated (Fig. 2C), with strong power suppression in response to S1 and S2, which was more pronounced during the comparison S2 and, at the lower frequencies, continued until the disappearance of the fixation target. These LFP-beta oscillations were also associated with oscillatory activity in the LPFC spiking population, as revealed by the STA of LFP traces during the fixation period (Fig. 2E). Finally, the spectrogram also revealed task modulation of the gamma band (Fig. 2C). While broadband LFP-gamma power increased selectively in response to both visual stimuli, the increase was more prominent during the comparison stimulus S2. Taken together, LFP recordings reflected different oscillations of LPFC neuronal activity, which were differentially modulated in the course of the trial following the structure of the task, as defined by the sequence of sensory events.
LFP power in the theta, beta, and gamma bands reflects task engagement
These oscillations could be a reflection of different network computations involved in task performance, or else they could be indicative of passive network responses to external events. Thus, we looked into whether the temporal modulations of LFPs reflected not only the sequence of sensory events but also the cognitive task engagement. We did this by comparing activity recorded during identical sensory stimulation but different cognitive demands imposed by the discrimination task and by the passive fixation task (Fig. 3).
Figure 3.

LFP power in the theta, beta, and gamma bands reflects task engagement. A–C, Average time course of the spectral power in the theta, beta, and gamma frequency bands (4–8, 12–30, and 50–85 Hz, respectively) during the task condition and during passive fixation (window size, 250 ms). LFP power in each frequency band was normalized by subtracting the power during the fixation period (at t = −0.625 s relative to S1 onset) for each site. We included data for sites for which both active tasks (direction task, N = 31; speed task, N = 24) and the corresponding passive fixation task were available. Shadings indicate the stimulus periods. Error bars are the SEMs obtained using bootstrap. Black horizontal lines along the x-axis indicate periods of significant differences (p < 0.05; permutation tests).
Responses to S1 and S2
We compared the LFP power in response to S1 and S2 during motion discrimination and passive fixation tasks. At the sensory level, both stimuli were identical but they differed in task demands: during the discrimination tasks, sensory processing and memory mechanisms must be invoked at the time of the first stimulus S1, while the second stimulus S2 required in addition retrieval/comparison mechanisms. In contrast, in the passive fixation tasks, the monkeys did not need to report anything related to the stimulus attributes and only needed to attend to the fixation target. To determine whether LFP power reflected differences in the demands during the two tasks and in the two stimuli, we modeled the LFP responses in each frequency band with mixed-effects ANOVAs with factors task (direction or speed), condition (active or passive), epoch (S1 or S2), monkey, and, as random factor, site identity (see Materials and Methods). The LFP-theta activity showed an initial increase after stimulus onset (0–300 ms) during S1 in the active and passive tasks. This activity was strongly reduced during S2 in the active but not in the passive tasks (Fig. 3A; interaction epoch × condition, F(1,219) = 16.6, p = 1.52 × 10⁻⁴; reduced ANOVAs for S1 and S2: no main effect of condition during S1, p > 0.16; main effect of condition during S2, F(1,109) = 22.2, p = 1.85 × 10⁻⁵). The LFP-beta power decreased during both S1 and S2 in both active and passive tasks. However, the difference between the passive and the active discrimination tasks emerged only during S2 (Fig. 3C; interaction epoch × condition, F(1,219) = 7.58, p = 0.008; no main effect of condition during S1, reduced ANOVA, F(1,109) = 3.32, p = 0.074; main effect of condition during S2, F(1,109) = 17.8, p = 9.96 × 10⁻⁵). The ANOVAs also revealed that in Monkey 2 the overall modulation of LFP theta was stronger and the drop in the LFP beta in stimulus response was more pronounced (ANOVA, main effect of monkey, F(1,219) = 101.4, p = 10−13). The invariance of the LFP-theta and LFP-beta responses during S1 in the active and passive condition suggests that the animals were likely to be equally engaged during this part of the trial for all conditions. In contrast, sensory responses in the LFP-gamma band showed greater sensitivity to the difference in task demands in the two conditions during both S1 and S2 (Fig. 3E; main effect of condition, F(1,219) = 38.98, p = 7.93 × 10⁻⁸). In addition, similar to LFP beta, the LFP-gamma response was significantly stronger in S2 than in S1 (ANOVA, F(1,253) = 20.0, p = 1.73 × 10⁻⁵). Stronger LFP-gamma and LFP-beta responses to S2 are a likely reflection of the additional cognitive demands during this phase of the task. This analysis revealed that all three LFP bands recorded in responses to the two comparison stimuli reflected the differences in the task demands during sensory stimulation.
Delay and post-S2 activity
In all frequency bands, we observed during the delay and post-S2 period power modulations that depended on the cognitive load of the task (Fig. 3). However, this was particularly notable for LFP theta, as it underwent the strongest power modulation in these task periods. Instead, LFP beta and LFP gamma had the strongest modulations during sensory periods S1 and S2. The average LFP-theta activity in the post-S1 and post-S2 delays recorded during the passive fixation task was weaker than that during the active discrimination tasks (Fig. 3A). However, this effect was significant only in Monkey 2 (ANOVA, interaction effect of monkey × condition, F(1,219) = 36.2, p = 1.80 × 10⁻⁷). In that animal, this effect was significant during both discrimination tasks, and its post-S2 activity was strongest (mixed-effects ANOVA, main effect of condition, F(1,107) = 40.81, p = 1.09 × 10⁻⁶; interaction effect of condition × epoch, F(1,107) = 18.51, p = 2.11 × 10⁻⁴). Delay modulation of LFP theta in Monkey 1 was weaker and the difference between the active and the passive tasks was not significant (ANOVA, p = 0.5). Stronger LFP-theta modulation in Monkey 2 did not correlate with behavioral performance (Monkey 2 performed better in the direction task but worse in the speed task; Fig. 1B), indicating that LFP-theta delay modulations were idiosyncratic to each monkey.
Preparatory signals
A specific feature of LFP beta was that it revealed dynamics before the presentation of the sensory stimuli, suggesting network dynamics associated with preparatory or anticipation mechanisms (Fig. 3B). Such anticipatory modulation of LFP beta is possible because the appearance of S1 and S2 was predictable in the task design (Fig. 1A). For each site, we quantified the LFP-beta modulation as the drop in beta power just before S1 and S2 (see Materials and Methods), and found that both were affected by the active engagement of the animal in the task: LFP beta showed significantly lower modulation in the passive than in the active tasks (Fig. 4). This decrease was significant for both monkeys (mixed-effects ANOVA, main effect of condition, F(1,219) = 16.68, p = 1.53 × 10⁻⁴). In addition, the LFP-beta modulation was higher before S2 than before S1, and this effect was stronger for Monkey 2 (ANOVA, main effect of epoch, F(1,253) = 71.8, p < 10−12; interaction effect of epoch × monkey, F(1,253) = 8.9, p = 0.0034).
Figure 4.

Enhanced beta modulation in the prestimulus intervals during discrimination tasks. Modulation of LFP beta before the onset of stimulus S1 (left) and stimulus S2 (right) was reduced during the passive fixation task. Pre-S1 (pre-S2) beta modulation was defined as the difference of LFP-beta power in 250 ms windows between the middle of the fixation (delay; 625 ms before the corresponding stimulus onset) and the onset of S1 (S2); see Materials and Methods for details. Each data point corresponds to the beta modulation for one site, with different symbols denoting data obtained from Monkey 1 (▵; N = 28 sites) and Monkey 2 (○; N = 27 sites).
Thus, LFP activity in the task-modulated frequency bands reflected also the cognitive demands of the task, revealing the underlying network dynamics associated with these higher-level computations. This was evidenced by power modulations during S2 that differed from S1 only in trials with additional cognitive S2 load (motion discrimination trials compared with passive fixation trials), by strong LFP-theta power in the delays following stimuli that also depended on cognitive load, or by task-dependent anticipation signals in LFP beta. This LFP activity could be consistent with a nonspecific alertness or attention LPFC network state in cognitive tasks, or else reflect network dynamics specific to stimulus parameters. We thus turned to examine stimulus selectivity in the LFP in more detail.
LFPs show only weak stimulus-selective responses and delay activity
To determine whether the network dynamics revealed by the LFP were associated with the encoding of behaviorally relevant stimulus features during the two comparison stimuli and during the memory delay, we investigated the selectivity of LFP power in the different bands.
Responses to S1 and S2
In the direction discrimination task, trial-averaged LFP-beta traces typically lacked stimulus selectivity during the S1 period (Fig. 5A). We quantified selectivity by applying an ROC analysis to LFP power distributions obtained for each of the two opposite motion directions (the two main directions used in each recording session; see Materials and Methods) and testing the significance of the AROC values by means of permutation tests. This analysis revealed very weak stimulus selectivity for motion direction in either LFP beta or LFP theta in response to S1 (Fig. 5B,C; average AROCcorrected = 0.505 ± 0.003 for LFP beta, 0.505 ± 0.004 for LFP theta, permutation test p < 0.05). In LFP gamma, selectivity was also very weak (Fig. 5C; AROCcorrected = 0.511 ± 0.004, p < 0.001). Selectivity in the passive fixation task was not significantly different (all p's > 0.24; Wilcoxon tests). The same analysis applied to the data recorded during the speed discrimination task yielded a higher incidence of sites with LFPs selective to motion speed during S1 (Fig. 5E–G). Although average speed selectivity in all three LFP bands was significant, the magnitude of this effect was relatively low (all average AROC < 0.534). Selectivity in the passive fixation task was not significantly different, except for the gamma band (p = 0.049; p = 0.07 for beta, p = 0.83 for theta; Wilcoxon tests). In both the direction and the speed task, sensory selectivity during S2 was not different from selectivity during S1 (Wilcoxon tests; all p's > 0.18).
Delay activity
We examined whether LFP power during the delay period separating S1 and S2 reflected the task-relevant feature of the S1 stimulus. In the direction discrimination task, such delay selectivity was confined to the beta band (Fig. 5B,C). In the speed task, we also found weak but significant delay selectivity spread over the three LFP bands (Fig. 5G). Direction selectivity in LFP beta was reduced in the passive task (p = 0.009, N = 36 sites, Wilcoxon test) but speed selectivity remained as in the active task (p = 0.55, N = 25 sites, Wilcoxon test).
We noted that LFP-beta selectivity for stimulus features often occurred toward the end of the delay, approximately at the time when beta power gradually decreased in anticipation of S2 (Figs. 3B, 4). We thus asked whether the stimulus-selective activity in the beta band was related to the gradual anticipatory decrease in beta power occurring before the onset of S2 (Fig. 4). We found that sites with stronger LFP-beta modulation before S2 tended to show stronger direction and speed selectivity during the delay (Fig. 5D,H), giving rise to a significant positive correlation between the two measures (direction task: Pearson's correlation, r = 0.36, p = 0.0066, N = 57; speed task: r = 0.31, p = 0.0080, N = 70). This suggests that beta oscillations are implicated in network dynamics associated with internal, delay-period processes related to the remembered S1 stimulus, in association with an anticipatory preparation for the upcoming S2 stimulus (Kilavik et al., 2013).
LFP responses to S2 are modulated by the remembered stimulus
During the comparison phase of the task (S2), the monkeys viewed motion stimuli that were either the same as or different from those presented during S1 and were rewarded for correctly reporting this comparison by pressing one of two response buttons. This phase of the task thus required them to compare the remembered S1 with the incoming information about S2 to build up a categorical decision. We examined whether LFP activity during S2 reflected the comparison of the remembered S1 with S2, and found a similar pattern of activity recorded during both direction and speed comparison tasks. We compared responses during or following S2 on trials in which S1 moved with the same motion direction or speed (S-trials; Fig. 1A) with trials in which the direction or speed of S1 was different (D-trials; Fig. 1A). In a substantial fraction of sites (LFP theta: 61.4% in the direction task vs 48.6% in the speed task; LFP beta: 38.6 vs 32.9%), the LFP power showed post-S2 modulations that reflected the matching or nonmatching of S1 and S2, the process we refer to as a “comparison process” (Fig. 6). Example single-site average LFP-beta responses in the direction task illustrate two distinct patterns (Fig. 6A): some sites had higher responses on S-trials (S > D sites) and others on D-trials (D > S sites). These CEs were quantified using ROC analysis. The results of this analysis computed for the LFP-beta activity show the presence of both types of behavior, S > D (Fig. 6B, above the upper dashed line) and D > S activity (Fig. 6B, below the lower dashed line).
In both tasks (Fig. 7), we found a similar fraction of sites with significant D > S effects (LFP theta: 31.6% in the direction task vs 35.7% in the speed task; LFP beta: 26.3 vs 25.7%). In contrast to the direction task, only a small fraction of sites showed S > D effects in the speed task (LFP theta: 29.8 vs 12.9%; LFP beta: 12.3 vs 7.1%). Consistently for the two discrimination tasks, the data revealed a clear temporal dissociation between the two types of CEs (Fig. 7A,D): sites with stronger activity in S-trials had a shorter latency in their comparison signal than sites with a stronger response in D-trials (Fig. 7B,E). The latency of CEs was similar in LFP theta and LFP gamma (Wilcoxon tests, all p's > 0.5). It is possible that the motor response associated with reporting the S-trials could have played a role in the earlier emergence of S > D effects, because the right button press was contralateral to the recorded hemisphere in both monkeys. However, the latency difference of 30–50 ms in premotor cortex neuronal responses to contralateral and ispilateral arm movements (Hoshi and Tanji, 2006) is too short to account for the large latency difference that we observed in S > D and D > S effects (182 ± 33 ms SEM across tasks and frequency bands; Fig. 7B,E).
Overall, we observed significant CEs in all three frequency bands, with the strongest and most common occurrence in the theta band and the weakest effects in the gamma band (Fig. 7C,F; average CE in LFP theta was significantly larger than in LFP beta, p = 5.07 × 10⁻⁴, z = −3.48; and in LFP gamma, p = 10−6, z = −4.90; Wilcoxon tests). For subsequent analyses of CEs, we focused especially on the theta and beta bands. Power modulations in the gamma band were weaker and might still partly reflect spiking activity rather than neuronal oscillations (see Materials and Methods).
These data demonstrate the presence of strong comparison signals in the broadband LFP activity, reflecting the remembered stimulus. This conclusion is strengthened by the finding that these signals depended on the animal actively performing the task, since they almost vanished in the passive fixation task, both in the beta band (Fig. 8A,B,D) and in the theta band (Fig. 8C), for both D > S and S > D sites (Fig. 8C,D).
The presence of strong broadband CEs shows that the network has access to the information about the remembered stimulus. In addition, it reveals a change in network dynamics relative to previous task stages: CEs are reflected consistently in all frequency bands and especially in LFP theta, but sensory and memory selectivity was distributed differently over LFP frequency bands (Fig. 5). This interpretation is further reinforced by the fact that comparison signals reflected an abstract representation of “same” vs “different” not dependent on the stimulus feature that had to be compared (Hussar and Pasternak, 2013). We saw this by selecting the sites with LFPs recorded during both the direction and the speed discrimination tasks and comparing site by site the CE in the two tasks (Fig. 9A,B). We found a highly significant correlation of CEs both in LFP theta and in LFP beta (p < 0.001), indicating that these effects did not reflect sensory feature-specific processes but a more abstract computation of stimulus difference, shared across both motion discrimination tasks. Alternatively, the CEs might reflect the upcoming motor plan for left versus right button press. However, this is unlikely because CEs were largely transient and absent at the time of the motor response.
Figure 9.

Similar CEs during the direction and the speed discrimination tasks. A, CE in LFP theta across tasks. CEs were measured at the offset of S2 for sites that showed a significant effect in either task (N = 30 sites). CEs in the two tasks were correlated (Pearson's correlation, r = 0.63, p = 2.2 × 10⁻⁴). B, CEs in LFP beta across tasks (N = 19 sites). CEs in the two tasks were correlated (Pearson's correlation, r = 0.82, p = 1.7 × 10⁻⁵). Sites that consistently prefer S > D trials fall in the first quadrant (blue shading), and sites that consistently prefer D > S lie in the third quadrant (red shading). Open circles indicate sites that had a significant effect in only one of the tasks. Filled circles indicate sites that had a significant effect in both tasks.
Broadband LFP comparison signals reflect stimulus difference and decision buildup
Our results show that while the LFP signals reflected nearly all salient components of motion comparisons, these signals were strongest during the comparison phase of the task. During this period, the subjects are asked to perform two operations: (1) to evaluate the parametric difference between the current and the remembered stimulus and (2) to form a categorical decision (same vs different). We examined LFP activity recorded after the onset of S2, with the goal of identifying these two components in specific LFP frequency bands.
We examined how LFPs integrated information about the sensory comparison process and categorical choice-dependent signals in the course of the trial. We designed an analysis that would allow us to quantify at different time points in the trial to what degree these CEs reflected a difference signal, parametrically related to the actual difference in direction or speed between S1 and S2, and to what degree they reflected the dichotomous choice of the animal. To this end, we fitted a linear mixed-effect model (McCulloch et al., 2008) to the LFP-theta and LFP-beta data at time points within the 1.5 s period following the presentation of the second stimulus S2. The model included a parametric regressor for stimulus difference, binary regressors for decision report (different/left or same/right) and for task (speed or direction task), and all interactions among these factors, plus a categorical regressor for site identity, which was treated as a random effect (see Materials and Methods). Fitting the data with this model allowed us to estimate which of these effects (parametric sensory comparison, binary decision, and task) best explained the variance in our LFP data at different time points during the trial. We fitted our data separately for S > D and D > S sites, as identified before (Figs. 6, 7). The model's best fit to the variance in the LFP data occurred at the end of S2 and in the following 500 ms period (Fig. 10A,D), consistent with the timing of CEs in our ROC analyses (Fig. 7B,E). The effects were similar in LFP theta (Fig. 10A–C) and in LFP beta (Fig. 10D–F). The parametrically related sensory comparison component contributed significantly to the early phase of the comparison signals, and this contribution was clearer in LFP theta than in LFP beta (Fig. 10B,E). The strongest contribution to the comparison signals observed in the LFP was the binary decision-related signal (Fig. 10C,F). This signal appeared first in S > D sites and then in D > S sites. For D > S sites, it became significant after the initial sensory component, both in the theta band (Fig. 10B,C) and in the beta band (Fig. 10E,F), while these components appeared simultaneously in S > D sites (Fig. 10B,C).
For most of the effects reported above, our linear model did not show significant interactions with the task. This indicates that all these dynamics of comparison and decision variables were consistent for the direction and speed tasks, confirming the observed strong correlation between CEs in the two tasks (Fig. 9A,B). There were only brief periods of significant interactions between the task factor and the decision factor in the beta band. However, by running separate linear models for the two tasks, we determined that these interactions only reflected a quantitative difference between the two tasks, in particular a lower contribution of the decision regression coefficient for S > D sites in the speed task (data not shown).
This linear-model analysis showed that LFP comparison signals emerged during the second stimulus presentation, and contained a first component of sensory-related signal that represented the parametric difference between S1 and S2, and a stronger component of decision-related signals that emerged simultaneously with the sensory component in S > D sites but only with a substantial delay in D > S sites. These effects were broadband and common to both comparison tasks, suggesting a general abstract computation of difference and decision dissociated from the more sensory band-specific modulations observed in Figures 2 and 3.
Relationship between spiking activity and LFPs
Most of our findings in LFP recordings paralleled previous results from single-unit activity in these experiments (Hussar and Pasternak, 2009, 2010, 2012, 2013; see Discussion). However, we identified two specific discrepancies that we investigated quantitatively by directly comparing LFPs with simultaneously recorded single-neuron activity.
First, direction and speed selectivity during S1 and delay was strong in single-unit spiking activity (Hussar and Pasternak, 2012, 2013), in contrast to the low selectivity that we observed in LFP sites (Fig. 5). We compared directly selectivity in these two types of signals by using the same analysis methods and criteria. In the population, the incidence of sites with significant direction and speed selectivity was low in LFP responses and high in spiking activity (Fig. 11). Average direction selectivity in LFP bands (AROCcorrected in the range of 0.505 to 0.511) was significantly lower than in spiking activity (AROCcorrected: 0.608; p < 10−6, Wilcoxon test). We found the same for speed selectivity (LFP AROCcorrected ranging from 0.523 to 0.533, single-neuron AROCcorrected: 0.567; p < 10−4, Wilcoxon test). The same was also verified in the delay period: fewer LFP sites were significantly delay-selective compared with single units (Fig. 11). Given the fact that LFPs and single neurons displayed CEs during S2 and post-S2 of comparable strength (Fig. 11; Hussar and Pasternak, 2012, 2013), this result is all the more remarkable. Therefore, the lack of stimulus selectivity in S1 and delay cannot be merely attributed to noise in LFP recordings or other technical limitations, but it seems to reflect a fundamental difference between the neuronal representations of sensory attributes and of comparison parameters in LPFC.
Second, similar to LFPs, single neurons also showed a difference in the latency of CEs between S > D and D > S neurons in the direction comparison task (Hussar and Pasternak, 2012). However, while CEs in LFP beta and LFP theta clearly emerged earlier in S > D than in D > S sites (Figs. 6D, 7B), the CEs in spiking activity for D > S neurons preceded those in S > D neurons, in particular during the direction task (Hussar and Pasternak, 2012). One possible explanation for this difference could lie in the interpretation of LFP signals. If LFP responses were suppressive, stronger responses in S-trials would actually mean stronger effects in D-trials and D > S activity would have preceded S > D activity. This indeed fits the response properties of LFP beta (Fig. 3B), but not those of LFP theta (Fig. 3A). In addition, CEs in the beta band occurred later than sensory responses, in what appeared like a positive rebound after sensory-induced suppression (Fig. 6A; Kilavik et al., 2013). We thus reasoned that CEs reflected in LFP activity were in nature different from responses occurring during stimulus presentation and in the delay (Fig. 3). If CEs in LFPs and spiking activity reflected the same underlying process, their timings should be related. To test this hypothesis, we compared the maximal CEs (maximal deviation from 0.5) of each site to the corresponding simultaneously recorded single neuron (Fig. 12A). Consistent with this hypothesis, we found a negative correlation of such maximal CEs (Pearson's correlation, r = −0.36, p = 0.039; Fig. 12A), showing that the majority of site–neuron pairs were of opposed polarity (64%, that is 21 of 33 pairs, had a D > S effect in the LFP and an S > D effect in spiking activity or vice versa). Furthermore, in this subset of site–neuron pairs (N = 21), the timing of CEs showed a clear positive correlation (Fig. 12B), indicating that the timing of the comparison signal in the LFP and in spiking activity was related on a site-by-site basis. Such correlation did not exist when considering the site–neuron pairs for which CEs were congruent, i.e., of the same polarity. This result established a link between comparison signals in neuronal activity and in LFPs, and it identified spectral power suppression during post-S2 rebound in low-frequency bands of the LFP as the collective representation of the firing rate increases in single neurons that encode comparison processes in the LPFC.
Dissociation of sensory and cognitive activity within LFP bands
We summarize our findings schematically in Figure 13A. We found band-specific responses to sensory stimuli in all LFP bands: power increases in LFP theta and LFP gamma and power reductions in LFP beta. In contrast, post-S2 activity related to the comparison component of the task was generally broadband and did not follow the opposed polarity of LFP activity observed for sensory responses. We therefore reasoned that sensory and cognitive components of the task might be reflected in different subcomponents of LFP-theta and LFP-beta power modulations. Figure 13A illustrates our hypothesis for a decomposition of these bands in sensory-specific (LFP-theta1, LFP-beta1) and cognitive-specific (LFP-theta2, LFP-beta2) dynamics. To test this hypothesis, we compared power modulations across task phases for all sites in our database. Consistent with a dissociation of sensory and cognitive activity in LFP theta, we found that responses to S1 in LFP theta were not correlated on a site-by-site basis with LFP-theta activity in the delay (Fig. 13B) and LFP-theta delay activity was strongly correlated with post-S2 LFP-theta activity associated with the comparison process (Fig. 13C). Consistent with a dissociation of sensory and cognitive LFP beta, LFP-beta responses to S1 did not correlate on a site-by-site basis with the drop in power in LFP beta immediately preceding S2 (Pearson's correlation, r = 0.180, p = 0.15; Fig. 13D). This cannot be explained by the separation of LFP beta in finer frequency bands, as this result remained (Pearson's correlation, r = 0.018, p = 0.88) when we restricted our analysis to a narrower beta band (14–18 Hz) suggested by the spectral structure shown in Figure 2C. Taken together, these data indicate that individual LFP bands in the LPFC are not univocally associated to a specific brain function. Oscillations related to sensory processing can occur in the same frequency band as oscillations related to memory or comparison processes.
Figure 13.
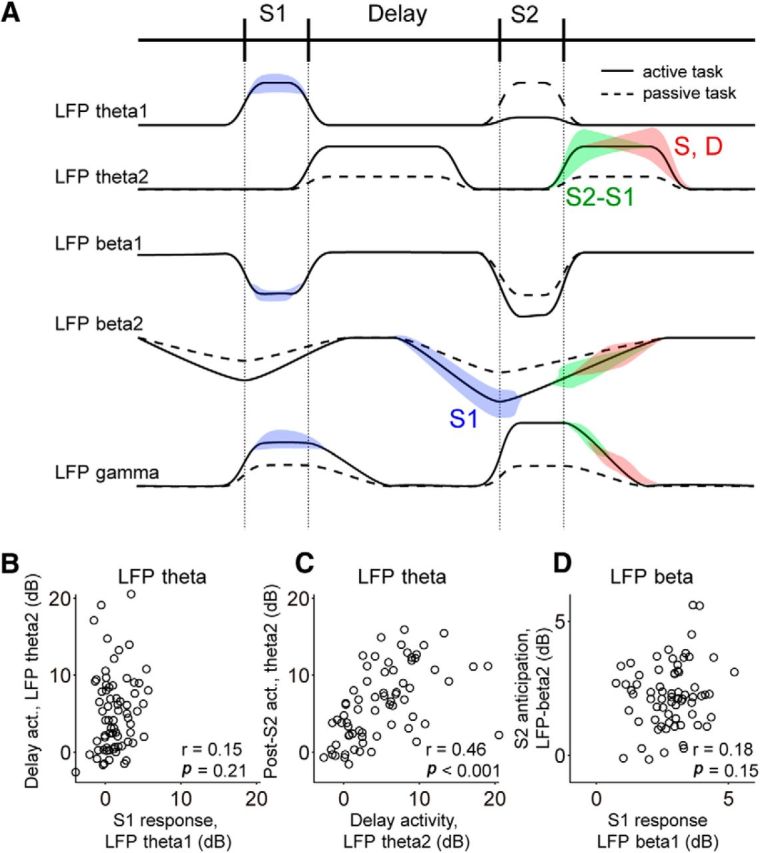
Sensory and cognitive components are dissociated in individual LFP bands. A, Schematic of our findings, separating putative sensory and cognitive components of LFP theta (LFP-theta1 and LFP-theta2, respectively) and LFP beta (LFP-beta1 and LFP-beta2, respectively). Power modulations are represented as deviations from baseline in the early fixation period. Modulations observed in passive tasks are shown with dashed lines. LFP selectivity to different task parameters is indicated with colored areas (S1 selectivity in blue; difference between S2 and S1 in green; same–different comparison in red). B, Lack of correlation between LFP-theta S1 response and LFP-theta delay activity across sites indicates a dissociation between sensory and cognitive parameters in LFP-theta1 and LFP-theta2, respectively. C, Strong correlation between LFP-theta2 delay and post-S2 activity supports a common substrate for memory and comparison-related processes in LFP theta. D, Absence of correlation between LFP-beta S1 response and pre-S2 LFP-beta drop indicates the dissociation of sensory and cognitive parameters in LFP-beta1 and LFP-beta2, respectively. All data are for Monkey 2, who had significant LFP-theta activity (N = 70) and thus presented all effects shown in A. For the other monkey (N = 57), the results were analogous except that we found some evidence of mixing of sensory and cognitive components in LFP theta, possibly due to the lack of robust theta delay activity in this monkey (LFP theta: S1 response vs delay activity r = 0.58, p < 0.001; delay vs post-S2 activity r = 0.35, p = 0.007; LFP beta: S1 response vs pre-S2 activity r = 0.174, p = 0.19; Pearson's correlation).
Discussion
We studied the dynamics of LFP oscillations in the LPFC during memory-guided sensory comparison tasks. A pattern consistent across the two discrimination tasks emerged from our data: (1) theta activity encoded weakly the task-relevant stimulus features during S1, it did not show consistent delay selectivity, and it had the strongest comparison and decision signals; (2) beta activity was only weakly stimulus-tuned during S1, in the delay it presented anticipatory dynamics and weak S1 selectivity, and it conveyed weaker comparison signals than LFP theta; (3) gamma activity revealed weak but consistent S1 selectivity, no substantial delay selectivity, and only relatively weak comparison signals. In the following, we interpret these effects as changes in network dynamics associated with the different components of the task.
Band-specific LFP responses to sensory stimuli
Sensory processing was reflected in a band-specific pattern: LFP theta and LFP gamma increased during the stimulus periods, and LFP beta decreased (Haegens et al., 2011a,b; Lara and Wallis, 2014). This pattern reflected the general processing of visual information, since it was also observed during the passive tasks, with identical effects during S1 and during S2 in all frequency bands. However, in discrimination tasks, the task demands during S2 were greater than during S1 in that S2 additionally required memory retrieval and comparison (Hussar and Pasternak, 2010). This was reflected in the difference in LFP activity during S1 and S2, displaying enhanced sensory effects during S2 in the beta and gamma bands, and reduced S2 responses in the theta band. This new pattern of frequency-specific modulations signals a qualitative change in oscillatory dynamics, different from a mere enhancement of stimulus-induced effects, as expected from an attention-mediated increase of sensory input in S2 (Reynolds et al., 2000). Theta-band responses differed from such general increase in sensory effects during S2 and, interestingly, this same frequency band was most prominently associated with the comparison processes in the post-S2 period. This suggests that when a stimulus needs to be compared based on information kept in memory, the LPFC network switches from a visual representation mode to comparison and decision dynamics characterized by the suppression of sensory theta (Fig. 13, LFP-theta1) and the increase of theta oscillations no longer associated with sensory parameters (Fig. 13, LFP-theta2).
Network dynamics in the delay period
The mnemonic period following S1 was characterized by distinct LFP patterns, suggesting a specific network activation associated with working memory. Data from one of our monkeys supported LFP-theta activity specific to early delay (Liebe et al., 2012; Lara and Wallis, 2014), but not consistently selective to the memorized stimulus parameters. Instead, stimulus selectivity in the late delay was observed consistently across tasks and monkeys in LFP beta. This reveals a change in network dynamics from sensory processing encoded in theta and gamma oscillations, to working memory represented in beta oscillations. In a similar task, Mendoza-Halliday et al. (2014) also found stronger motion representation in the beta band during the delay but their LFPs showed delay selectivity also in other frequency bands. This could be due to the presence of spatial attention elements in their task, which are often reflected in the gamma band (Tremblay et al., 2015).
In support of a role of beta oscillations associated with internal, delay-period processes, we found that LFP beta decayed gradually before S2 onset. These decay dynamics may be associated with the monkey's anticipating and preparing for the timed sensory events in our task (Hussar and Pasternak, 2010; Kilavik et al., 2013). Previous PFC recordings have also found a relationship between beta oscillations and preparation for selective attention (Zhang et al., 2008). In addition, sites with stronger anticipatory drop in LFP beta before S2 also presented stronger delay signals representing S1, suggesting that anticipatory dynamics in LFP beta recapitulated the relevant S1 stimulus feature before S2. Thus, the progressive reduction of beta-band oscillations in network activity may reveal the reconfiguration of network dynamics to reduce variability and recapitulate memorized parameters in preparation for the comparison process taking place during S2. In agreement with this interpretation, Lara and Wallis (2014) found that lower beta-band power in the delay period of a color working memory task was associated with improved behavioral precision.
Broadband LFP signals represent comparison signals and the buildup of the perceptual decision
After S2 onset, the network undergoes another change in dynamics as it engages in sensory comparison. This dynamic regime is characterized by the strong amplification of theta-band oscillations, modulated by sensory comparison and decision processes. We found that comparison-related broadband LFP signals first reflected the process of sensory comparison. Later in the trial they were best explained by the categorical decision, which was represented sequentially in different sites (S > D followed by D > S sites) in a two-stage decision process. This has been previously described in LPFC spiking activity (Hussar and Pasternak, 2012), and our LFP results in a much coarser signal suggest that these two decision stages operate in segregated LPFC subnetworks (see below). A binary LFP-beta decision signal has previously been identified in the premotor cortex of monkeys performing a vibrotactile comparison task (Haegens et al., 2011a). A gradual buildup of decision-related beta signals has also been found in MEG activity obtained from humans performing perceptual decision tasks (Siegel et al., 2011). Together, these results suggest a role for low-frequency LFP oscillations in signaling the decision buildup that might become more categorical for cortical areas closer to the motor output.
Topography of LPFC activity
While sensory selectivity and comparison signals were relatively strong in single neurons (Hussar and Pasternak, 2009, 2012, 2013), LFPs showed only weak sensory selectivity but remarkably strong CEs (Fig. 11). This dissociation may be indicative of different topographical arrangements of the representations of motion and comparison/decision parameters in the LPFC (Silver and Kastner, 2009).
The weak stimulus selectivity of LFPs could be attributed to the use of only two motion directions selected to optimize preferences of individual neurons rather than of LFPs. However, during the speed task, we used a broader range of speeds and found similarly low selectivity in the LFPs, echoing findings of low direction selectivity from a recent study using a larger number of motion directions (Mendoza-Halliday et al., 2014). Thus, it is likely that the low stimulus selectivity of LFP activity reflects the lack of topographic organization of motion-selective neurons in the LPFC. The LFP is thought to reflect the pooled activity of nearby neurons (Katzner et al., 2009; Buzsáki et al., 2012), which in the absence of a columnar organization would average out the motion tuning of individual cells. Spurious selectivity at some recording sites could then arise from a random sampling bias. Instead, in cortical areas where neurons cluster according to motion selectivity, LFPs would retain strong selectivity, as it occurs in area MT (Liu and Newsome, 2006; Khayat et al., 2010).
In contrast to the weak stimulus selectivity, LFPs were strongly modulated by the difference between S1 and S2. These comparison signals could reflect a clustering of S > D and D > S neurons in functional subnetworks within the LPFC, as underscored by the association of CEs in LFPs and spiking activity, both in terms of effect strength and latency (Fig. 11). Recent studies have identified similar functional clustering of neural populations within areas of the frontal cortex (Kiani et al., 2015; Markowitz et al., 2015).
Different modes of LPFC circuit operation through the different stages of a sensory comparison task reflected in LFPs
Changes in LFP oscillations associated with the different task phases may reflect diverse network dynamics flexibly adopted by the LPFC to adapt to specific task requirements. For instance, the LPFC may enter a feedforward processing mode in sensory phases, which would be characterized by oscillatory activity in the theta and gamma bands (Bastos et al., 2015). During the maintenance epoch, the LPFC would turn to a recurrent mode, and engage oscillatory dynamics in the beta band. The phase following S2 would instead require both internal computations and feedforward processing to motor centers, and be related to dynamics in the theta and beta bands, which are implicated in interareal communication (van Kerkoerle et al., 2014; Womelsdorf et al., 2014; Bastos et al., 2015; Brincat and Miller, 2015). While our results resonate with an association between LFP bands and hierarchical information processing, they also hint at a more complex relationship between oscillations and brain function. LFP sites presented power modulations in the theta and beta bands that could be independently linked to the sensory or to the cognitive aspects of the task. The fact that one single-frequency channel may be linked to multiple components of a behavioral task (Kilavik et al., 2013) adds complexity to the idea that each LFP band is associated with one type of information processing. Thus, local cortical oscillatory dynamics transition between complex, multifrequency oscillatory patterns, which in the course of the task selectively synchronize across the cortical hierarchy (Bastos et al., 2015).
The sensory comparison computation following S2 points to the LPFC as one node in a distributed network of cortical areas. Broadband comparison signals that span the theta, beta, and gamma bands suggest feedforward processing, reflected in the theta and gamma bands, but also feedback processing, reflected in the beta band (van Kerkoerle et al., 2014; Bastos et al., 2015). This may reflect interactions between the LPFC and the motion processing area MT, collectively computing sensory comparison signals (Lui and Pasternak, 2011; Hussar and Pasternak, 2012; Pasternak et al., 2015). The later, decision-related component of the comparison signals may instead reflect internal LPFC dynamics for decision buildup, and feedforward information relay to motor areas (Siegel et al., 2015). In summary, our results contribute to an emergent picture of the perceptual decision process, in which information flow is not limited to the feedforward direction following a strictly hierarchical organization, but top-down and bottom-up processes are involved during multiple processing stages of the task (Bastos et al., 2015; Siegel et al., 2015; Tauste Campo et al., 2015; Wimmer et al., 2015).
Footnotes
This work was supported by the Spanish Ministry of Economy and Competitiveness together with the European Regional Development Fund (Grants BFU2009-09537, BFU2012-34838 to A.C.), the Secretaria d'Universitats i Recerca del Departament d'Economia i Coneixement de la Generalitat de Catalunya (Ref: SGR14-1265 to A.C.), the German Research Foundation (fellowship Wi 3767/1-1 to K.W.), the National Eye Institute (Grants RO1 EY11749 to T.P. and P30 EY01319 to the Center for Visual Science). Data collection was carried out at the University of Rochester. Data analysis was carried out at the Esther Koplowitz Centre, Barcelona. We thank C.R. Hussar for collecting the data and A. Ben-Simon and P. Spinelli for help with the preprocessing of the LFP data. We thank Pascal Fries and Ruben Moreno-Bote for comments and useful suggestions.
The authors declare no competing financial interests.
References
- Bastos AM, Vezoli J, Bosman CA, Schoffelen JM, Oostenveld R, Dowdall JR, De Weerd P, Kennedy H, Fries P. Visual areas exert feedforward and feedback influences through distinct frequency channels. Neuron. 2015;85:390–401. doi: 10.1016/j.neuron.2014.12.018. [DOI] [PubMed] [Google Scholar]
- Bressler SL, Richter CG. Interareal oscillatory synchronization in top-down neocortical processing. Curr Opin Neurobiol. 2015;31:62–66. doi: 10.1016/j.conb.2014.08.010. [DOI] [PubMed] [Google Scholar]
- Brincat SL, Miller EK. Frequency-specific hippocampal-prefrontal interactions during associative learning. Nat Neurosci. 2015;18:576–581. doi: 10.1038/nn.3954. [DOI] [PMC free article] [PubMed] [Google Scholar]
- Britten KH, Shadlen MN, Newsome WT, Movshon JA. The analysis of visual motion: a comparison of neuronal and psychophysical performance. J Neurosci. 1992;12:4745–4765. doi: 10.1523/JNEUROSCI.12-12-04745.1992. [DOI] [PMC free article] [PubMed] [Google Scholar]
- Buschman TJ, Miller EK. Top-down versus bottom-up control of attention in the prefrontal and posterior parietal cortices. Science. 2007;315:1860–1862. doi: 10.1126/science.1138071. [DOI] [PubMed] [Google Scholar]
- Buschman TJ, Denovellis EL, Diogo C, Bullock D, Miller EK. Synchronous oscillatory neural ensembles for rules in the prefrontal cortex. Neuron. 2012;76:838–846. doi: 10.1016/j.neuron.2012.09.029. [DOI] [PMC free article] [PubMed] [Google Scholar]
- Buzsáki G, Anastassiou CA, Koch C. The origin of extracellular fields and currents—EEG, ECoG, LFP and spikes. Nat Rev Neurosci. 2012;13:407–420. doi: 10.1038/nrn3241. [DOI] [PMC free article] [PubMed] [Google Scholar]
- David SV, Malaval N, Shamma SA. Decoupling action potential bias from cortical local field potentials. Comput Intell Neurosci. 2010;2010:393019. doi: 10.1155/2010/393019. [DOI] [PMC free article] [PubMed] [Google Scholar]
- Engel AK, Fries P. Beta-band oscillations—signalling the status quo? Curr Opin Neurobiol. 2010;20:156–165. doi: 10.1016/j.conb.2010.02.015. [DOI] [PubMed] [Google Scholar]
- Funahashi S, Bruce CJ, Goldman-Rakic PS. Mnemonic coding of visual space in the monkey's dorsolateral prefrontal cortex. J Neurophysiol. 1989;61:331–349. doi: 10.1152/jn.1989.61.2.331. [DOI] [PubMed] [Google Scholar]
- Fuster JM. The prefrontal cortex. fourth edition. London: Academic; 2008. [Google Scholar]
- Galindo-Leon EE, Liu RC. Predicting stimulus-locked single unit spiking from cortical local field potentials. J Comput Neurosci. 2010;29:581–597. doi: 10.1007/s10827-010-0221-z. [DOI] [PMC free article] [PubMed] [Google Scholar]
- Gregoriou GG, Gotts SJ, Zhou H, Desimone R. High-frequency, long-range coupling between prefrontal and visual cortex during attention. Science. 2009;324:1207–1210. doi: 10.1126/science.1171402. [DOI] [PMC free article] [PubMed] [Google Scholar]
- Gregoriou GG, Rossi AF, Ungerleider LG, Desimone R. Lesions of prefrontal cortex reduce attentional modulation of neuronal responses and synchrony in V4. Nat Neurosci. 2014;17:1003–1011. doi: 10.1038/nn.3742. [DOI] [PMC free article] [PubMed] [Google Scholar]
- Haegens S, Nácher V, Hernández A, Luna R, Jensen O, Romo R. Beta oscillations in the monkey sensorimotor network reflect somatosensory decision making. Proc Natl Acad Sci U S A. 2011a;108:10708–10713. doi: 10.1073/pnas.1107297108. [DOI] [PMC free article] [PubMed] [Google Scholar]
- Haegens S, Nácher V, Luna R, Romo R, Jensen O. α-Oscillations in the monkey sensorimotor network influence discrimination performance by rhythmical inhibition of neuronal spiking. Proc Natl Acad Sci U S A. 2011b;108:19377–19382. doi: 10.1073/pnas.1117190108. [DOI] [PMC free article] [PubMed] [Google Scholar]
- Hoshi E, Tanji J. Differential involvement of neurons in the dorsal and ventral premotor cortex during processing of visual signals for action planning. J Neurophysiol. 2006;95:3596–3616. doi: 10.1152/jn.01126.2005. [DOI] [PubMed] [Google Scholar]
- Hussar C, Pasternak T. Trial-to-trial variability of the prefrontal neurons reveals the nature of their engagement in a motion discrimination task. Proc Natl Acad Sci U S A. 2010;107:21842–21847. doi: 10.1073/pnas.1009956107. [DOI] [PMC free article] [PubMed] [Google Scholar]
- Hussar CR, Pasternak T. Flexibility of sensory representations in prefrontal cortex depends on cell type. Neuron. 2009;64:730–743. doi: 10.1016/j.neuron.2009.11.018. [DOI] [PMC free article] [PubMed] [Google Scholar]
- Hussar CR, Pasternak T. Memory-guided sensory comparisons in the prefrontal cortex: contribution of putative pyramidal cells and interneurons. J Neurosci. 2012;32:2747–2761. doi: 10.1523/JNEUROSCI.5135-11.2012. [DOI] [PMC free article] [PubMed] [Google Scholar]
- Hussar CR, Pasternak T. Common rules guide comparisons of speed and direction of motion in the dorsolateral prefrontal cortex. J Neurosci. 2013;33:972–986. doi: 10.1523/JNEUROSCI.4075-12.2013. [DOI] [PMC free article] [PubMed] [Google Scholar]
- Kalcher J, Pfurtscheller G. Discrimination between phase-locked and non-phase-locked event-related EEG activity. Electroencephalogr Clin Neurophysiol. 1995;94:381–384. doi: 10.1016/0013-4694(95)00040-6. [DOI] [PubMed] [Google Scholar]
- Katzner S, Nauhaus I, Benucci A, Bonin V, Ringach DL, Carandini M. Local origin of field potentials in visual cortex. Neuron. 2009;61:35–41. doi: 10.1016/j.neuron.2008.11.016. [DOI] [PMC free article] [PubMed] [Google Scholar]
- Khayat PS, Niebergall R, Martinez-Trujillo JC. Frequency-dependent attentional modulation of local field potential signals in macaque area MT. J Neurosci. 2010;30:7037–7048. doi: 10.1523/JNEUROSCI.0404-10.2010. [DOI] [PMC free article] [PubMed] [Google Scholar]
- Kiani R, Cueva CJ, Reppas JB, Peixoto D, Ryu SI, Newsome WT. Natural grouping of neural responses reveals spatially segregated clusters in prearcuate cortex. Neuron. 2015;85:1359–1373. doi: 10.1016/j.neuron.2015.02.014. [DOI] [PMC free article] [PubMed] [Google Scholar]
- Kilavik BE, Zaepffel M, Brovelli A, MacKay WA, Riehle A. The ups and downs of beta oscillations in sensorimotor cortex. Exp Neurol. 2013;245:15–26. doi: 10.1016/j.expneurol.2012.09.014. [DOI] [PubMed] [Google Scholar]
- Lara AH, Wallis JD. Executive control processes underlying multi-item working memory. Nat Neurosci. 2014;17:876–883. doi: 10.1038/nn.3702. [DOI] [PMC free article] [PubMed] [Google Scholar]
- Liebe S, Hoerzer GM, Logothetis NK, Rainer G. Theta coupling between V4 and prefrontal cortex predicts visual short-term memory performance. Nat Neurosci. 2012;15:456–462. S1–S2. doi: 10.1038/nn.3038. [DOI] [PubMed] [Google Scholar]
- Liu J, Newsome WT. Local field potential in cortical area MT: stimulus tuning and behavioral correlations. J Neurosci. 2006;26:7779–7790. doi: 10.1523/JNEUROSCI.5052-05.2006. [DOI] [PMC free article] [PubMed] [Google Scholar]
- Lui LL, Pasternak T. Representation of comparison signals in cortical area MT during a delayed direction discrimination task. J Neurophysiol. 2011;106:1260–1273. doi: 10.1152/jn.00016.2011. [DOI] [PMC free article] [PubMed] [Google Scholar]
- Markowitz DA, Curtis CE, Pesaran B. Multiple component networks support working memory in prefrontal cortex. Proc Natl Acad Sci U S A. 2015;112:11084–11089. doi: 10.1073/pnas.1504172112. [DOI] [PMC free article] [PubMed] [Google Scholar]
- McCulloch CE, Searle SR, Neuhaus JM. Generalized, linear, and mixed models. Hoboken, NJ: Wiley; 2008. [Google Scholar]
- Mendoza-Halliday D, Torres S, Martinez-Trujillo JC. Sharp emergence of feature-selective sustained activity along the dorsal visual pathway. Nat Neurosci. 2014;17:1255–1262. doi: 10.1038/nn.3785. [DOI] [PMC free article] [PubMed] [Google Scholar]
- Miller EK, Cohen JD. An integrative theory of prefrontal cortex function. Annu Rev Neurosci. 2001;24:167–202. doi: 10.1146/annurev.neuro.24.1.167. [DOI] [PubMed] [Google Scholar]
- Mitra P, Bokil H. Observed brain dynamics. Oxford, UK: Oxford UP; 2008. [Google Scholar]
- Moore T, Armstrong KM. Selective gating of visual signals by microstimulation of frontal cortex. Nature. 2003;421:370–373. doi: 10.1038/nature01341. [DOI] [PubMed] [Google Scholar]
- Nelson MJ, Pouget P, Nilsen EA, Patten CD, Schall JD. Review of signal distortion through metal microelectrode recording circuits and filters. J Neurosci Methods. 2008;169:141–157. doi: 10.1016/j.jneumeth.2007.12.010. [DOI] [PMC free article] [PubMed] [Google Scholar]
- Okun M, Naim A, Lampl I. The subthreshold relation between cortical local field potential and neuronal firing unveiled by intracellular recordings in awake rats. J Neurosci. 2010;30:4440–4448. doi: 10.1523/JNEUROSCI.5062-09.2010. [DOI] [PMC free article] [PubMed] [Google Scholar]
- Pasternak T, Lui LL, Spinelli PM. Unilateral prefrontal lesions impair memory-guided comparisons of contralateral visual motion. J Neurosci. 2015;35:7095–7105. doi: 10.1523/JNEUROSCI.5265-14.2015. [DOI] [PMC free article] [PubMed] [Google Scholar]
- Pesaran B, Pezaris JS, Sahani M, Mitra PP, Andersen RA. Temporal structure in neuronal activity during working memory in macaque parietal cortex. Nat Neurosci. 2002;5:805–811. doi: 10.1038/nn890. [DOI] [PubMed] [Google Scholar]
- Reynolds JH, Pasternak T, Desimone R. Attention increases sensitivity of V4 neurons. Neuron. 2000;26:703–714. doi: 10.1016/S0896-6273(00)81206-4. [DOI] [PubMed] [Google Scholar]
- Romo R, Salinas E. Flutter discrimination: neural codes, perception, memory and decision making. Nat Rev Neurosci. 2003;4:203–218. doi: 10.1038/nrn1058. [DOI] [PubMed] [Google Scholar]
- Salazar RF, Dotson NM, Bressler SL, Gray CM. Content-specific fronto-parietal synchronization during visual working memory. Science. 2012;338:1097–1100. doi: 10.1126/science.1224000. [DOI] [PMC free article] [PubMed] [Google Scholar]
- Siegel M, Engel AK, Donner TH. Cortical network dynamics of perceptual decision-making in the human brain. Front Hum Neurosci. 2011;5:21. doi: 10.3389/fnhum.2011.00021. [DOI] [PMC free article] [PubMed] [Google Scholar]
- Siegel M, Buschman TJ, Miller EK. Cortical information flow during flexible sensorimotor decisions. Science. 2015;348:1352–1355. doi: 10.1126/science.aab0551. [DOI] [PMC free article] [PubMed] [Google Scholar]
- Silver MA, Kastner S. Topographic maps in human frontal and parietal cortex. Trends Cogn Sci. 2009;13:488–495. doi: 10.1016/j.tics.2009.08.005. [DOI] [PMC free article] [PubMed] [Google Scholar]
- Tauste Campo A, Martinez-Garcia M, Nácher V, Luna R, Romo R, Deco G. Task-driven intra- and interarea communications in primate cerebral cortex. Proc Natl Acad Sci U S A. 2015;112:4761–4766. doi: 10.1073/pnas.1503937112. [DOI] [PMC free article] [PubMed] [Google Scholar]
- Tremblay S, Doucet G, Pieper F, Sachs A, Martinez-Trujillo J. Single-trial decoding of visual attention from local field potentials in the primate lateral prefrontal cortex is frequency-dependent. J Neurosci. 2015;35:9038–9049. doi: 10.1523/JNEUROSCI.1041-15.2015. [DOI] [PMC free article] [PubMed] [Google Scholar]
- Tsujimoto T, Shimazu H, Isomura Y. Direct recording of theta oscillations in primate prefrontal and anterior cingulated cortices. J Neurophysiol. 2006;95:2987–3000. doi: 10.1152/jn.00730.2005. [DOI] [PubMed] [Google Scholar]
- van Kerkoerle T, Self MW, Dagnino B, Gariel-Mathis MA, Poort J, van der Togt C, Roelfsema PR. Alpha and gamma oscillations characterize feedback and feedforward processing in monkey visual cortex. Proc Natl Acad Sci U S A. 2014;111:14332–14341. doi: 10.1073/pnas.1402773111. [DOI] [PMC free article] [PubMed] [Google Scholar]
- Wimmer K, Compte A, Roxin A, Peixoto D, Renart A, de la Rocha J. Sensory integration dynamics in a hierarchical network explains choice probabilities in cortical area MT. Nat Commun. 2015;6:6177. doi: 10.1038/ncomms7177. [DOI] [PMC free article] [PubMed] [Google Scholar]
- Womelsdorf T, Ardid S, Everling S, Valiante TA. Burst firing synchronizes prefrontal and anterior cingulate cortex during attentional control. Curr Biol. 2014;24:2613–2621. doi: 10.1016/j.cub.2014.09.046. [DOI] [PubMed] [Google Scholar]
- Zaksas D, Pasternak T. Directional signals in the prefrontal cortex and in area MT during a working memory for visual motion task. J Neurosci. 2006;26:11726–11742. doi: 10.1523/JNEUROSCI.3420-06.2006. [DOI] [PMC free article] [PubMed] [Google Scholar]
- Zanos TP, Mineault PJ, Pack CC. Removal of spurious correlations between spikes and local field potentials. J Neurophysiol. 2011;105:474–486. doi: 10.1152/jn.00642.2010. [DOI] [PubMed] [Google Scholar]
- Zhang Y, Wang X, Bressler SL, Chen Y, Ding M. Prestimulus cortical activity is correlated with speed of visuomotor processing. J Cogn Neurosci. 2008;20:1915–1925. doi: 10.1162/jocn.2008.20132. [DOI] [PubMed] [Google Scholar]