Abstract
Hormesis is a phenomenon of particular interest in biology, medicine, pharmacology, and toxicology. In this study, we investigated the relationship between H2O2-induced hormetic response in S. cerevisiae and carbon sources in yeast growth medium. In general, our data indicate that (i) hydrogen peroxide induces hormesis in a concentration-dependent manner; (ii) the effect of hydrogen peroxide on yeast reproductive ability depends on the type of carbon substrate in growth medium; and (iii) metabolic and growth rates as well as catalase activity play an important role in H2O2-induced hormetic response in yeast.
1. Introduction
Hormesis has been observed in a variety of organisms: from bacteria to humans, responding to a wide range of chemical, physical, and biological stressors [1–3]. According to the hormesis theory, low doses of stress-inducing factors lead to stimulatory hormesis response and improvement of biological functions, whereas at high doses the deleterious effects prevail [4]. Hormesis may activate defense pathways ensuring protection against higher doses of the same agent (“preadaptation”) as well as other specific stressors (“cross-protection”) [5–7]. Therefore, hormetic response suggests the existence of complex mechanisms that sense and respond to a variety of stress-inducing factors. In addition, the specificity of stress response is determined by physiological state of an organism that, in turn, depends on the accessibility of specific carbon/energy sources.
Recent studies strongly support the notion that hydrogen peroxide plays a crucial role in the induction of hormesis [7, 8]. On the other hand, its effect can be considered as harmful, because at high concentrations H2O2 causes oxidative damage to cell structures [9]. Manipulation of reproductive potential through different carbon sources for yeast cultivation as well as hormesis-stimulating concentrations of hydrogen peroxide appears to be an effective approach to improve yeast survival and cross-adaptation to different kinds of stress.
In the present work, we used Saccharomyces cerevisiae grown on fermentable and nonfermentable substrates to study the effect of different concentrations of hydrogen peroxide on yeast reproductive ability and potential role of the primary antioxidant enzymes such as superoxide dismutase (SOD) and catalase in H2O2-induced hormetic response.
2. Materials and Methods
The Saccharomyces cerevisiae strain used in this study was YPH250 (MATa trp1-Δ1 his3-Δ200 lys2-801 leu2-Δ1 ade2-101 ura3-52) described earlier [10], and kindly provided by Professor Inoue (Kyoto University, Japan). Chemicals were obtained from Sigma-Aldrich Chemical Co. (USA) and Fluka (Germany). All chemicals were of analytical grade.
Yeast cells were grown with shaking at 175 r.p.m. and 28°C in Erlenmeyer flasks containing YPD liquid medium (1% yeast extract, 2% peptone, and 2% glucose) in a volume that respected the ratio 1 : 5 regarding media volume to flask volume. Glucose was substituted for fructose (2%), ethanol (1%), or glycerol (1%) in the respective experiments.
For experiments, overnight cultures were diluted to about 106 cells/mL in respective medium. Aliquots of the experimental cultures after 24 h growth were exposed to different concentrations of hydrogen peroxide, followed by their incubation at 28°C for 1 h [11]. Control cells were incubated under the same conditions but without hydrogen peroxide. After incubation, cells from experimental or control cultures were used for the reproductive ability evaluation.
Yeast reproductive ability was analyzed by plating in triplicate on YPD agar after proper dilution. The plates were incubated at 28°C for 3 days and the colony forming units (CFU) counted [12]. Reproductive ability was expressed as percentage of total amount of cells plating on YPD agar.
Cell growth was measured as an increase in optical density at 590 nm (OD590) with a spectrophotometer “Labsystems Multiskan MCC 1340” (Finland). The growth rate was counted as a change in OD590 per hour during the exponential phase.
Yeast cells from respective cultures were collected by centrifugation at room temperature (5 min, 8000 g) and washed with 50 mM potassium phosphate (K-phosphate) buffer (pH 7.0). The yeast pellets were resuspended in lysis buffer (50 mM K-phosphate buffer, 1 mM phenylmethylsulfonyl chloride, and 0.5 mM EDTA). Cell extracts were prepared by vortexing yeast suspensions with glass beads (0.5 mm) as described earlier [11] and kept on ice for immediate use.
The following parameters were measured spectrophotometrically with a Spekol 211 spectrophotometer (Carl Zeiss, Germany), a SF-46 spectrophotometer (LOMO, USSR), and “Labsystems Multiskan MCC 1340” (Finland). To evaluate the metabolic activity of yeast cells 2,3,5-triphenyltetrazolium chloride was used. Metabolically active cells are capable of reducing the dye to water-insoluble red formazan that can be extracted from the cells with an ethanol/acetone mixture, and the absorbance of this solution was then read at 485 nm [12]. The results are expressed as OD485 units per 108 cells.
The content of carbonyl groups in proteins was measured by determining the amount of 2,4-dinitrophenylhydrazone formed upon reaction with 2,4-dinitrophenylhydrazine [13]. The carbonyl content was calculated from the absorbance maximum of 2,4-dinitrophenylhydrazone measured at 370 nm using an extinction coefficient of 22 mM−1 cm−1. The results are expressed in nanomoles per milligram of protein.
The activity of SOD was assayed at 406 nm as the inhibition of quercetin oxidation by superoxide-anion-radical [11]. One unit of SOD activity was defined as the amount of soluble protein of supernatant that inhibited the maximal rate of quercetin oxidation by 50%.
Catalase activity was determined by monitoring the disappearance of hydrogen peroxide at 240 nm using the extinction coefficient for hydrogen peroxide of 39.4 M−1 cm−1 [11]. One unit of catalase activity was defined as the amount of supernatant protein that utilized 1 μmol of substrate per minute. The enzyme activities were measured at 25°C and expressed per milligram of soluble protein in supernatant.
To evaluate the total antioxidant capacity of yeast cells colored 2,2′-azinobis-(3-ethylbenzothiazoline-6-sulfonic acid) radical cation (ABTS•+) was used [14]. The ABTS•+ was decolorized by antioxidants according to their concentrations and antioxidant capacities. This change in color was measured as a change in OD420 with trolox as the standard. The parameter is expressed in nmol of trolox equivalents per milligram of soluble protein in supernatant.
Protein concentration was determined by the Coomassie brilliant blue G-250 dye-binding method [15] with bovine serum albumin as the standard. Experimental data are expressed as the mean value of 3–10 independent experiments ± the standard error of the mean (SEM), and statistical analysis was performed using variance (ANOVA) followed by a Student-Newman-Keuls test.
3. Results
3.1. H2O2-Induced Hormetic Response Depends on the Type of Carbon Source for Yeast Growth
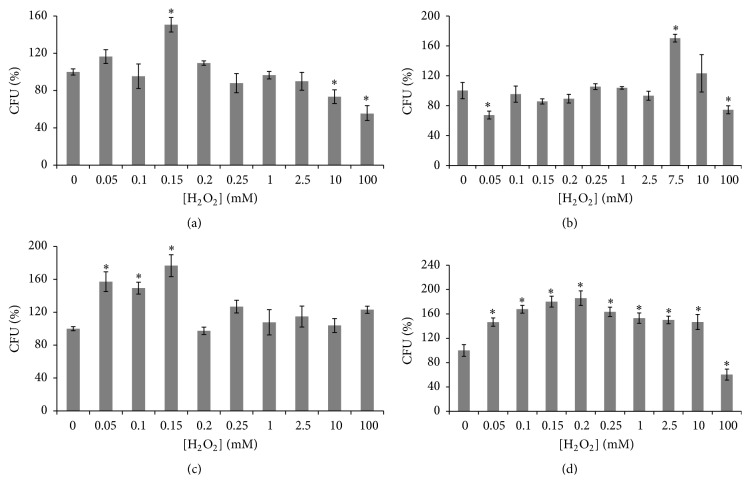
According to recent studies hydrogen peroxide plays a crucial role in the induction of hormesis [7, 8] and effect of hydrogen peroxide depends on the type of monosaccharide in yeast cultivation medium [16]. Figure 1 demonstrates the influence of different concentrations of hydrogen peroxide on the reproductive ability of yeast cells grown on fermentable (glucose or fructose) and nonfermentable (glycerol or ethanol) carbon sources. Although in all cases we observe typical biphasic concentration-response curve, exhibiting hormetic effect of hydrogen peroxide, H2O2 triggers the hormetic response at different concentrations.
Figure 1.
Effect of hydrogen peroxide on reproductive ability of S. cerevisiae growing on glucose (a), fructose (b), glycerol (c), and ethanol (d). Results are shown as the mean ± SEM (n = 3–10). ∗Significantly different from control (without H2O2) with P < 0.05.
Yeast grown on glucose demonstrated the peak hormetic response at 0.15 mM H2O2 (Figure 1(a)), whereas in fructose-grown cells the peak was seen after their incubation with as high as 7.5 mM H2O2 (Figure 1(b)). At the hormetic concentrations of hydrogen peroxide, yeast grown in glucose- and fructose-containing medium showed 151% and 170% of the initial reproductive ability (without H2O2), respectively. Independently of the type of monosaccharide in the cultivation medium, yeast demonstrated the lowest reproductive ability at the highest H2O2 concentration used (100 mM), but fructose-grown cells comparing to glucose-grown cells showed higher colony growth (~74% and ~55% of the initial reproductive ability, resp.).
The peak hormetic response of glycerol-grown cells was seen at 0.05–0.15 mM H2O2 (157–177% of the control reproductive ability). In contrast to a sharp rise of the reproductive activity at hormetic concentrations of H2O2 in cells grown on both monosaccharides and glycerol, ethanol-cultivated yeast (Figure 1(d)) had a broad peak hormetic response at 0.05–10.0 mM H2O2 (147–180% of the initial reproductive ability). However, 100 mM H2O2 reduced proliferative activity of ethanol-grown yeast to 60% of the initial value, whereas at 100 mM H2O2 glycerol-grown cells demonstrated colony growth similar to the control one.
Thus carbon substrate in cultivation medium is an important factor that determines yeast response to hydrogen peroxide.
3.2. Carbon Source Affects the Growth Rate of Yeast Culture
Next we studied yeast growth on glucose, fructose, glycerol, and ethanol that seem to be associated with different hormetic phenotypes described above. As seen in Figure 2, growth rates of the investigated cultures were rather similar during only the first 2 h. After that, cells grown on fermentable monosaccharides entered the exponential phase. However, glycerol- and ethanol-cultivated cells did not finish growing in the lag phase over the next 10 hours, demonstrating their less adaptive ability to utilize available carbon sources than those grown on glucose or fructose. After entering the exponential phase, the growth characteristics of the four investigated cultures evaluated as the changes in optical density per hour (ΔOD590/h) were 0.129, 0.145, 0.120, and 0.087, respectively. Optical density (OD590) of the yeast suspension on 30 h of growth reflected the cell number in stationary culture was 1.22, 1.38, 1.36, and 1.23 for glucose-, fructose-, glycerol-, and ethanol-supplemented growth, respectively.
Figure 2.
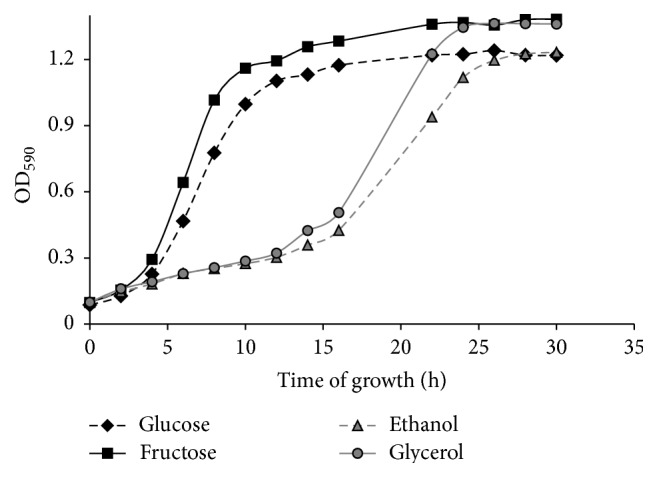
Growth curves of S. cerevisiae cultivated in a liquid medium with different carbon sources.
Therefore, the type of carbon source determines the growth rate of yeast culture and affects H2O2-induced hormetic phenotype.
3.3. H2O2-Induced Hormetic Response Depends on Metabolic Rate and Markers of Oxidative Stress in Yeast Cells
It is well documented that rate of aerobic growth is associated with metabolic activity and cellular redox state [17–19]. Figure 3 shows that the four studied types of yeast cells (glucose-, fructose-, ethanol-, and glycerol-grown) are characterized by different metabolic activities. The lowest parameter was found in glucose-grown cells. Yeast cultivated on fructose, ethanol, and glycerol demonstrates metabolic activity 2.2-, 3.3-, and 6.9-fold higher than that at glucose-supplemented growth, respectively. In accordance with that previously mentioned, the level of carbonyl groups in proteins (Figure 4), an indicator of oxidative stress [11, 13, 20–22], was higher at growth on fructose, ethanol, and glycerol compared to glucose-grown yeast (2.3-, 1.7-, and 3.2-fold, resp.).
Figure 3.
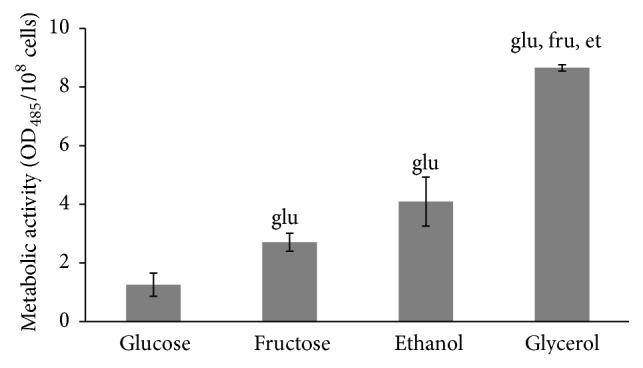
Metabolic activity of S. cerevisiae growing on different carbon sources. Results are shown as the mean ± SEM (n = 4-5). Significantly different from respective values for cells growing on gluglucose, frufructose, and etethanol with P < 0.05.
Figure 4.
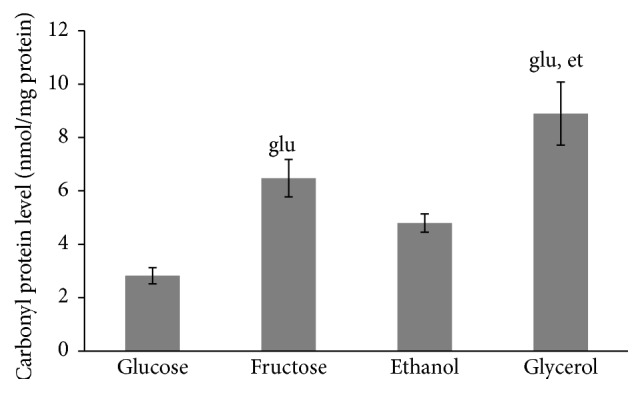
Carbonyl protein level of S. cerevisiae growing on different carbon sources. Results are shown as the mean ± SEM (n = 3-4). Significantly different from respective values for cells growing on gluglucose and etethanol with P < 0.05.
No marked difference between all the studied types of cells was found in their SOD activities (Figure 5). Unlike SOD, the activity of catalase tends to be higher in cells grown in the presence of nonfermentable carbon sources than fermentable monosaccharides (Figure 6), but, due to high variation in some trials, the parameter was significantly higher only in glycerol-grown cells (3.3-, 3.0-, and 1.8-fold higher than those at glucose-, fructose-, and ethanol-supplemented growth, resp.). It is interesting to note that the total antioxidant capacity (Figure 7) demonstrated the opposite to catalase activity tendency (1.2-, 2.7-, and 2.4-fold lower in fructose-, ethanol-, and glycerol-grown cells than in glucose-grown cells, resp.).
Figure 5.
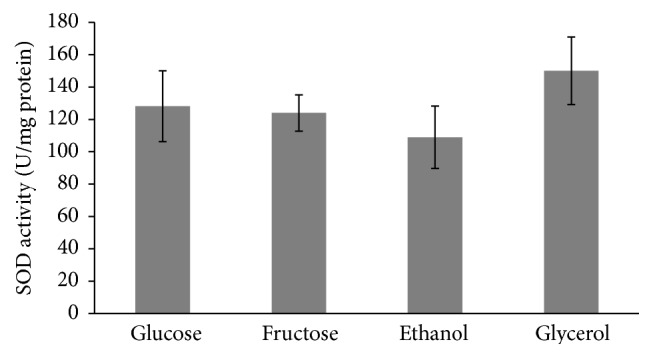
Activity of superoxide dismutase of S. cerevisiae growing on different carbon sources. Results are shown as the mean ± SEM (n = 5–7).
Figure 6.
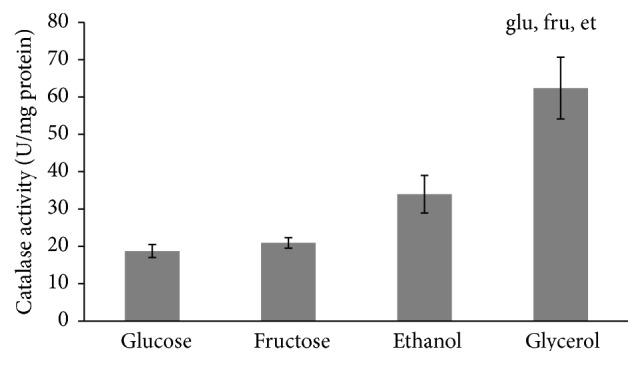
Activity of catalase of S. cerevisiae growing on different carbon sources. Results are shown as the mean ± SEM (n = 4-5). ∗Significantly different from respective values for cells growing on gluglucose, frufructose, and etethanol with P < 0.05.
Figure 7.
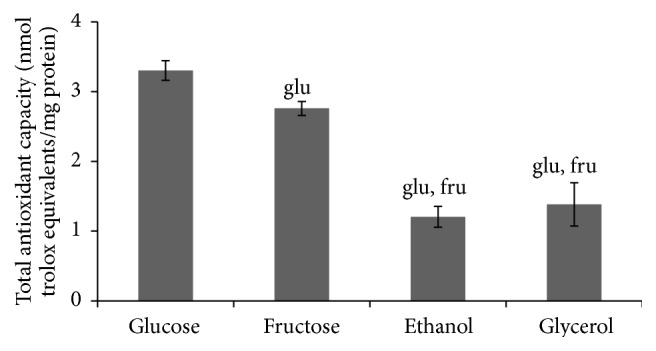
Total antioxidant capacity of S. cerevisiae growing on different carbon sources. Results are shown as the mean ± SEM (n = 6–10). Significantly different from respective values for cells growing on gluglucose and frufructose with P < 0.05.
4. Discussion
Hormesis is defined as a mild stress resulting in a life supporting beneficial effect of low doses of chemical, physical, or biological stressors that are unfavorable or lethal at their high doses [2, 3, 23, 24]. This phenomenon is observed in a variety of organisms and usually limited to the 30–60% increase in a biological function [25]. Hydrogen peroxide was recently found to play a crucial role in the induction of hormesis and stress cross-resistance in yeast [7, 8, 26]. However, its effect depends very much on the concentrations used as well as biochemical and physiological peculiarities of the cells. For instance, fructose-grown yeast exposed to low concentrations of H2O2 has been found to demonstrate higher reproductive ability than glucose-grown cells [16].
In order to expand our understanding of S. cerevisiae response to hydrogen peroxide we used a wide range of H2O2 concentrations (from 0.05 to 100 mM) and yeast cultivated on fermentable (glucose or fructose) and nonfermentable (glycerol or ethanol) carbon sources. All the investigated cell types demonstrated the biphasic dose-response relationship for effects of hydrogen peroxide on yeast reproductive ability, but the shape of hormetic curves was different (Figure 1). Both the studied types of cells cultivated on fermentable monosaccharides (glucose and fructose) demonstrated the sharp peak hormetic response but at different concentrations of hydrogen peroxide (0.15 mM H2O2 and 7.5 mM H2O2, resp.). Similarly to yeast grown in the presence of glucose, glycerol-grown cells have shown the hormetic response at low concentrations of hydrogen peroxide (0.05–0.15 mM H2O2). In contrast, hormetic response of ethanol-grown yeast was observed at a wide range of hydrogen peroxide concentrations (0.05–10.0 mM H2O2).
Different metabolism of the four carbon sources used in this study underlies various yeast hormetic responses to hydrogen peroxide. It is well known from either in vitro or in vivo studies that fructose is more potent glycoxidation agent than glucose and therefore capable of producing greater amounts of reactive intermediates like reactive carbonyl (RCS) and oxygen species (ROS) [27–30]. Recently we found a significantly higher ROS level (~2.0-fold) in fructose-grown yeast than that in glucose-grown yeast and therefore suggested that fructose provoked a mild oxidative stress that stimulated cellular defensive mechanisms, including SOD and catalase [16, 31]. This resulted in the acquisition of cellular resistance to lethal challenges and explained the higher survival of fructose-grown yeast than glucose-grown yeast under shock induced by high concentrations of H2O2 [16]. The findings of the present study are consistent with our previous suggestions and demonstrate that fructose-grown cells are more resistant to hydrogen peroxide than glucose-grown cells, and the peak hormetic responses in the first case are shifted to a higher concentration of H2O2.
Nonfermentable substrates like ethanol can provide yeast with energy produced via aerobic respiration, and leakage of electrons from the respiratory chain may lead to high ROS generation and induction of oxidative stress [20, 32–34]. Chronic oxidative stress and stimulation of defensive enzymes in yeast growing on ethanol can explain a broad peak hormetic response to hydrogen peroxide. Lower resistance to H2O2 of glycerol-grown yeast demonstrating the hormetic response at low concentrations of oxidant as compared to cells cultivated in the presence of ethanol may be a result of specificity of glycerol and ethanol metabolism in the yeast. Although both substrates need active respiration, that is, operation of the electron transport chain, they are metabolized in different ways. For example, ethanol is directly oxidized to acetyl-CoA and enters the citric acid cycle [35]. Glycerol is phosphorylated and further reduced to give dihydroxyacetone phosphate. Further, it can be metabolized either by gluconeogenesis or by glycolysis and the citric acid cycle [36]. Thus, yeast utilizing ethanol produces more ROS than yeast growing on fermentable substrates [20], and therefore ethanol provokes a mild oxidative stress and yeast tolerance to a wide range of H2O2 concentrations. Thus preliminary oxidative stress as a result of yeast growth on certain carbon sources plays an important role in the acquisition of cellular resistance to following severe challenge as well as H2O2-induced hormetic response in yeast.
Different rates of yeast growth on the four carbon sources (Figure 2) and metabolic activities of the four studied cell types (Figure 3) seem to be an important precondition for various hormetic responses of S. cerevisiae to hydrogen peroxide (Figure 1). As one explanation, the above-mentioned different phenotypes are associated with various intensities of oxidative stress in yeast grown in the presence of glucose, fructose, ethanol, and glycerol. The above suggestions are consistent with the data showing the level of oxidative stress markers (Figures 4 and 6).
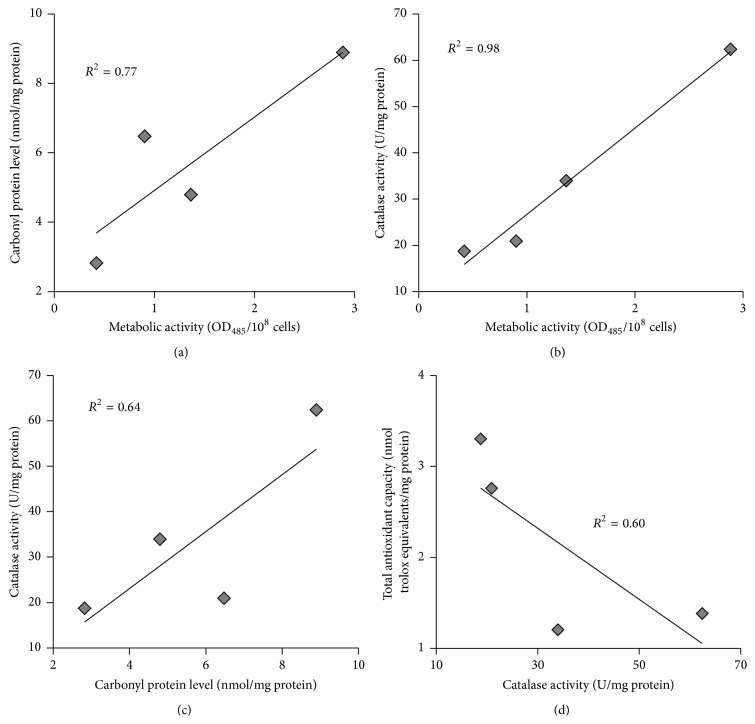
In living organisms, external factors can cause oxidative stress with different intensities. This has been put on the basis of modern classification of oxidative stress [3, 23]. Recent comparative analysis of glucose and fructose vital effects on yeast clearly revealed that yeast grown on fructose had higher metabolic activity and levels of carbonyl groups in proteins as well as other markers of oxidative stress [28]. It is also well known that yeast utilizing nonfermentable substrates like ethanol and glycerol produces more ROS than yeast growing on fermentable carbon sources [20], and therefore the intensity of oxidative stress is higher in the case of cell cultivation in the presence of ethanol and glycerol than glucose and fructose. In accordance with the previous findings and our suggestions above on different intensity of oxidative stress in the four studied cell types as a precondition of their various hormetic responses to hydrogen peroxide, the correlation analysis of the relationship between metabolic activity (Figure 3), level of oxidized proteins (Figure 4), and activity of catalase (Figure 6) gives a strong positive correlation between the parameters (Figures 8(a), 8(b), and 8(c)).
Figure 8.
Correlation analysis of data obtained with S. cerevisiae growing on different carbon sources. Correlating between (a) carbonyl protein levels and metabolic activities; (b) catalase activities and metabolic activities; (c) catalase activities and carbonyl protein levels; and (d) total antioxidant capacities and catalase activities.
It should be noted that the primary antioxidant enzymes, SOD and catalase, were usually found to demonstrate a strong relationship [11, 16]; however in the present study the enzymes showed different behaviors. Unlike catalase, activity of which was higher in yeast grown on nonfermentable carbon sources (Figure 6), no substantive differences were observed for the effect of glucose, fructose, ethanol, and glycerol on SOD activity (Figure 5).
Surprisingly, when the total antioxidant capacity data were plotted against catalase activity, the dependence demonstrated a complicated pattern, negative correlation (Figure 8(d)). It has been reported that total antioxidant activity of S. cerevisiae strongly depended on the thiol content, depletion of which led to decrease of the total antioxidant capacity [37]. We suggest that under conditions of this study catalase is an important determinant of yeast protection against oxidative damage during aerobic growth, with the four substrates used.
5. Conclusion
In general, our data and correlation analysis suggest that high rate of metabolism in yeast grown on certain carbon sources leads to oxidative stress, since the intracellular level of carbonyl proteins is increased in these cases. Enhanced catalase activity also reveals oxidative stress development; however this stress is rather mild, whereas severe oxidative stress inactivates antioxidant enzymes mainly through oxidation of their active centers or carbonylation of amino acids residues [16, 38, 39]. In turn, preliminary mild oxidative stress is an important precondition of the acquisition of cellular resistance to following severe oxidative stress as well as H2O2-induced hormetic response in yeast.
Acknowledgment
The authors are grateful to Professor Inoue for providing the yeast strain.
Conflict of Interests
The authors declare that there is no conflict of interests regarding the publication of this paper.
References
- 1.Calabrese E. J. Hormesis: why it is important to toxicology and toxicologists. Environmental Toxicology and Chemistry. 2008;27(7):1451–1474. doi: 10.1897/07-541.1. [DOI] [PubMed] [Google Scholar]
- 2.Martins I., Galluzzi L., Kroemer G. Hormesis, cell death and aging. Aging. 2011;3(9):821–828. doi: 10.18632/aging.100380. [DOI] [PMC free article] [PubMed] [Google Scholar]
- 3.Lushchak V. I. Dissection of the hormetic curve: analysis of components and mechanisms. Dose-Response. 2014;12(3):466–479. doi: 10.2203/dose-response.13-051.lushchak. [DOI] [PMC free article] [PubMed] [Google Scholar]
- 4.Calabrese V., Cornelius C., Dinkova-Kostova A. T., et al. Cellular stress responses, hormetic phytochemicals and vitagenes in aging and longevity. Biochimica et Biophysica Acta (BBA)—Molecular Basis of Disease. 2012;1822(5):753–783. doi: 10.1016/j.bbadis.2011.11.002. [DOI] [PubMed] [Google Scholar]
- 5.Berry D. B., Gasch A. P. Stress-activated genomic expression changes serve a preparative role for impending stress in yeast. Molecular Biology of the Cell. 2008;19(11):4580–4587. doi: 10.1091/mbc.E07-07-0680. [DOI] [PMC free article] [PubMed] [Google Scholar]
- 6.Milisav I., Poljsak B., Šuput D. Adaptive response, evidence of cross-resistance and its potential clinical use. International Journal of Molecular Sciences. 2012;13(9):10771–10806. doi: 10.3390/ijms130910771. [DOI] [PMC free article] [PubMed] [Google Scholar]
- 7.Semchyshyn H. M. Hormetic concentrations of hydrogen peroxide but not ethanol induce cross-adaptation to different stresses in budding yeast. International Journal of Microbiology. 2014;2014:5. doi: 10.1155/2014/485792.485792 [DOI] [PMC free article] [PubMed] [Google Scholar]
- 8.Ludovico P., Burhans W. C. Reactive oxygen species, ageing and the hormesis police. FEMS Yeast Research. 2014;14(1):33–39. doi: 10.1111/1567-1364.12070. [DOI] [PMC free article] [PubMed] [Google Scholar]
- 9.Cabiscol E., Piulats E., Echave P., Herrero E., Ros J. Oxidative stress promotes specific protein damage in Saccharomyces cerevisiae . The Journal of Biological Chemistry. 2000;275(35):27393–27398. doi: 10.1074/jbc.m003140200. [DOI] [PubMed] [Google Scholar]
- 10.Inoue Y., Matsuda T., Sugiyama K.-I., Izawa S., Kimura A. Genetic analysis of glutathione peroxidase in oxidative stress response of Saccharomyces cerevisiae . The Journal of Biological Chemistry. 1999;274(38):27002–27009. doi: 10.1074/jbc.274.38.27002. [DOI] [PubMed] [Google Scholar]
- 11.Bayliak M., Semchyshyn H., Lushchak V. Effect of hydrogen peroxide on antioxidant enzyme activities in Saccharomyces cerevisiae is strain-specific. Biochemistry. 2006;71(9):1013–1020. doi: 10.1134/s0006297906090100. [DOI] [PubMed] [Google Scholar]
- 12.Conconi A., Jager-Vottero P., Zhang X., Beard B. C., Smerdon M. J. Mitotic viability and metabolic competence in UV-irradiated yeast cells. Mutation Research/DNA Repair. 2000;459(1):55–64. doi: 10.1016/s0921-8777(99)00057-9. [DOI] [PubMed] [Google Scholar]
- 13.Levine R. L., Garland D., Oliver C. N., et al. Determination of carbonyl content in oxidatively modified proteins. Methods in Enzymology. 1990;186:464–478. doi: 10.1016/0076-6879(90)86141-H. [DOI] [PubMed] [Google Scholar]
- 14.Erel O. A novel automated direct measurement method for total antioxidant capacity using a new generation, more stable ABTS radical cation. Clinical Biochemistry. 2004;37(4):277–285. doi: 10.1016/j.clinbiochem.2003.11.015. [DOI] [PubMed] [Google Scholar]
- 15.Bradford M. M. A rapid and sensitive method for the quantitation of microgram quantities of protein utilizing the principle of protein-dye binding. Analytical Biochemistry. 1976;72(1-2):248–254. doi: 10.1016/0003-2697(76)90527-3. [DOI] [PubMed] [Google Scholar]
- 16.Semchyshyn H. M., Lozinska L. M. Fructose protects baker's yeast against peroxide stress: potential role of catalase and superoxide dismutase. FEMS Yeast Research. 2012;12(7):761–773. doi: 10.1111/j.1567-1364.2012.00826.x. [DOI] [PubMed] [Google Scholar]
- 17.González-Siso M. I., García-Leiro A., Tarrío N., Cerdán M. E. Sugar metabolism, redox balance and oxidative stress response in the respiratory yeast Kluyveromyces lactis . Microbial Cell Factories. 2009;8, article 46 doi: 10.1186/1475-2859-8-46. [DOI] [PMC free article] [PubMed] [Google Scholar]
- 18.Magherini F., Carpentieri A., Amoresano A., et al. Different carbon sources affect lifespan and protein redox state during Saccharomyces cerevisiae chronological ageing. Cellular and Molecular Life Sciences. 2009;66(5):933–947. doi: 10.1007/s00018-009-8574-z. [DOI] [PMC free article] [PubMed] [Google Scholar]
- 19.Van Raamsdonk J. M., Meng Y., Camp D., et al. Decreased energy metabolism extends life span in Caenorhabditis elegans without reducing oxidative damage. Genetics. 2010;185(2):559–571. doi: 10.1534/genetics.110.115378. [DOI] [PMC free article] [PubMed] [Google Scholar]
- 20.Costa V., Moradas-Ferreira P. Oxidative stress and signal transduction in Saccharomyces cerevisiae: insights into ageing, apoptosis and diseases. Molecular Aspects of Medicine. 2001;22(4-5):217–246. doi: 10.1016/s0098-2997(01)00012-7. [DOI] [PubMed] [Google Scholar]
- 21.Lushchak V. I. Free radical oxidation of proteins and its relationship with functional state of organisms. Biochemistry. 2007;72(8):809–827. doi: 10.1134/s0006297907080020. [DOI] [PubMed] [Google Scholar]
- 22.Lushchak V. I. Oxidative stress in yeast. Biochemistry. 2010;75(3):281–296. doi: 10.1134/s0006297910030041. [DOI] [PubMed] [Google Scholar]
- 23.Lushchak V. I. Classification of oxidative stress based on its intensity. EXCLI Journal. 2014;13:922–937. [PMC free article] [PubMed] [Google Scholar]
- 24.Calabrese E. J. Hormesis within a mechanistic context. Homeopathy. 2015;104(2):90–96. doi: 10.1016/j.homp.2015.01.002. [DOI] [PubMed] [Google Scholar]
- 25.Calabrese V., Cornelius C., Cuzzocrea S., Iavicoli I., Rizzarelli E., Calabrese E. J. Hormesis, cellular stress response and vitagenes as critical determinants in aging and longevity. Molecular Aspects of Medicine. 2011;32(4–6):279–304. doi: 10.1016/j.mam.2011.10.007. [DOI] [PubMed] [Google Scholar]
- 26.Mesquita A., Weinberger M., Silva A., et al. Caloric restriction or catalase inactivation extends yeast chronological lifespan by inducing H2O2 and superoxide dismutase activity. Proceedings of the National Academy of Sciences of the United States of America. 2010;107(34):15123–15128. doi: 10.1073/pnas.1004432107. [DOI] [PMC free article] [PubMed] [Google Scholar]
- 27.Spasojević I., Bajić A., Jovanović K., Spasić M., Andjus P. Protective role of fructose in the metabolism of astroglial C6 cells exposed to hydrogen peroxide. Carbohydrate Research. 2009;344(13):1676–1681. doi: 10.1016/j.carres.2009.05.023. [DOI] [PubMed] [Google Scholar]
- 28.Semchyshyn H. M., Lozinska L. M., Miedzobrodzki J., Lushchak V. I. Fructose and glucose differentially affect aging and carbonyl/oxidative stress parameters in Saccharomyces cerevisiae cells. Carbohydrate Research. 2011;346(7):933–938. doi: 10.1016/j.carres.2011.03.005. [DOI] [PubMed] [Google Scholar]
- 29.Sakai M., Oimomi M., Kasuga M. Experimental studies on the role of fructose in the development of diabetic complications. Kobe Journal of Medical Sciences. 2002;48(5-6):125–136. [PubMed] [Google Scholar]
- 30.Semchyshyn H. M., Miedzobrodzki J., Bayliak M. M., Lozinska L. M., Homza B. V. Fructose compared with glucose is more a potent glycoxidation agent in vitro, but not under carbohydrate-induced stress in vivo: potential role of antioxidant and antiglycation enzymes. Carbohydrate Research. 2014;384:61–69. doi: 10.1016/j.carres.2013.11.015. [DOI] [PubMed] [Google Scholar]
- 31.Semchyshyn H. M. Fructation in vivo: detrimental and protective effects of fructose. BioMed Research International. 2013;2013:9. doi: 10.1155/2013/343914.343914 [DOI] [PMC free article] [PubMed] [Google Scholar]
- 32.Lushchak V. I., Gospodaryov D. V. Catalases protect cellular proteins from oxidative modification in Saccharomyces cerevisiae . Cell Biology International. 2005;29(3):187–192. doi: 10.1016/j.cellbi.2004.11.001. [DOI] [PubMed] [Google Scholar]
- 33.Stanley D., Bandara A., Fraser S., Chambers P. J., Stanley G. A. The ethanol stress response and ethanol tolerance of Saccharomyces cerevisiae . Journal of Applied Microbiology. 2010;109(1):13–24. doi: 10.1111/j.1365-2672.2009.04657.x. [DOI] [PubMed] [Google Scholar]
- 34.Bleoanca I., Silva A. R. C., Pimentel C., Rodrigues-Pousada C., Menezes R. D. A. Relationship between ethanol and oxidative stress in laboratory and brewing yeast strains. Journal of Bioscience and Bioengineering. 2013;116(6):697–705. doi: 10.1016/j.jbiosc.2013.05.037. [DOI] [PubMed] [Google Scholar]
- 35.Faria-Oliveira F., Puga S., Ferreira C. Yeast: world's finest chef. In: Muzzalupo I., editor. Food Industry. chapter 23. Rijeka, Croatia: InTech; 2013. pp. 519–547. [DOI] [Google Scholar]
- 36.Påhlman A.-K., Granath K., Ansell R., Hohmann S., Adler L. The yeast glycerol 3-phosphatases Gpp1p and Gpp2p are required for glycerol biosynthesis and differentially involved in the cellular responses to osmotic, anaerobic, and oxidative stress. The Journal of Biological Chemistry. 2001;276(5):3555–3563. doi: 10.1074/jbc.m007164200. [DOI] [PubMed] [Google Scholar]
- 37.Balcerczyk A., Grzelak A., Janaszewska A., et al. Thiols as major determinants of the total antioxidant capacity. BioFactors. 2003;17(1–4):75–82. doi: 10.1002/biof.5520170108. [DOI] [PubMed] [Google Scholar]
- 38.Kim S. Y., Kwon O. J., Park J.-W. Inactivation of catalase and superoxide dismutase by singlet oxygen derived from photoactivated dye. Biochimie. 2001;83(5):437–444. doi: 10.1016/S0300-9084(01)01258-5. [DOI] [PubMed] [Google Scholar]
- 39.Costa V. M. V., Amorim M. A., Quintanilha A., Moradas-Ferreira P. Hydrogen peroxide-induced carbonylation of key metabolic enzymes in Saccharomyces cerevisiae: the involvement of the oxidative stress response regulators Yap1 and Skn7. Free Radical Biology and Medicine. 2002;33(11):1507–1515. doi: 10.1016/s0891-5849(02)01086-9. [DOI] [PubMed] [Google Scholar]


