Abstract
Atmospheric cold plasma (ACP) is a promising nonthermal technology effective against a wide range of pathogenic microorganisms. Reactive oxygen species (ROS) play a crucial inactivation role when air or other oxygen-containing gases are used. With strong oxidative stress, cells can be damaged by lipid peroxidation, enzyme inactivation, and DNA cleavage. Identification of ROS and an understanding of their role are important for advancing ACP applications for a range of complex microbiological issues. In this study, the inactivation efficacy of in-package high-voltage (80 kV [root mean square]) ACP (HVACP) and the role of intracellular ROS were investigated. Two mechanisms of inactivation were observed in which reactive species were found to either react primarily with the cell envelope or damage intracellular components. Escherichia coli was inactivated mainly by cell leakage and low-level DNA damage. Conversely, Staphylococcus aureus was mainly inactivated by intracellular damage, with significantly higher levels of intracellular ROS observed and little envelope damage. However, for both bacteria studied, increasing treatment time had a positive effect on the intracellular ROS levels generated.
INTRODUCTION
Atmospheric cold plasma (ACP) refers to nonequilibrated plasma generated at near-ambient temperatures and pressure. ACP is composed of particles, including free electrons, radicals, and positive and negative ions, but it is low in collision frequency of gas discharge compared to that with equilibrated plasma (1, 2). ACP technologies have widely been applied for many surface treatments and environmental processes. Recently, they have been studied for food sterilization and plasma medicine (2–5).
ACP provides inactivation effects against a wide range of microbes, mainly by the generation of cell-lethal reactive species (6–8). By discharging in air, groups of reactive species are generated, such as reactive oxygen species (ROS), reactive nitrogen species (RNS), UV radiation, energetic ions, and charged particles (5). However, the inactivation efficacy can be varied by changing the working gases, which results in different types or amounts of reactive species generated (9–11). ROS are often identified as the principal effecting species, with a relatively long half-life and strong antimicrobial effects, which are generated in oxygen-containing gases (12).
ROS generated during plasma discharge in air or oxygen-containing mixtures are assemblies of ozone, hydrogen peroxide, and singlet and atomic oxygen, while ozone is considered the most microbicidal species (13). With strong oxidative stress, cells are damaged by lipid peroxidation, enzyme inactivation, and DNA cleavage. The generation of plasma in air or a nitrogen-containing gas mixture can also generate NOx species. However, higher inactivation efficacy has been reported with the combined application of NO and H2O2 on Escherichia coli than that with a treatment with NO or H2O2 alone (14). Reactive nitrogen species are highly toxic and can lead to cell death by increasing DNA damage (15). One of the potential benefits of ACP as a sterilization or pasteurization technology is the reported low mutation level associated with it, which may be attributed to the “cocktail” of reactive species generated (16, 17). However, different patterns of cellular damage between Gram-negative and Gram-positive bacteria were observed in previous studies (18, 19). Moreover, the treatment parameter of mode of exposure has been previously described (13, 20); the inactivation mechanisms reported were similar under both direct and indirect exposure to the plasma. With regard to inactivation efficacy, indirect exposure to ACP had a reduced microbicidal effect in cases where there was no interaction with UV, electron beams, charged particles, and other short-lived species. However, the in-package treatment used in this study allows the contained recombination of reactive radicals, which might result in strong bactericidal effects, even with indirect exposure.
Thus, the inactivation mechanism of ACP is a possible result of the actions of reactive species, which correlate with process and system parameters. Reactive species reactions with Gram-negative and -positive bacteria are potentially different. To test this hypothesis, this study compared the inactivation mechanisms of high-voltage ACP (HVACP) against E. coli and Staphylococcus aureus to expand the understanding of the possible different patterns of damage against Gram-negative and Gram-positive bacteria, especially the action of reactive oxygen species. The interactive effects of intracellular ROS generation and DNA damage with treatment time were examined in conjunction with spectral diagnostics of the in-package process to elucidate the mechanism.
MATERIALS AND METHODS
Bacterial strains and growth conditions.
The bacterial strains used in this study were E. coli NCTC 12900 (nontoxigenic O157:H7) and Staphylococcus aureus ATCC 25923. The strains were chosen to represent both Gram-negative and Gram-positive bacteria and to facilitate comparisons with other studies. They are pathogens of relevance to the food industry and have multidrug resistance and a high rate of mutations (21, 22). E. coli NCTC 12900 was obtained from the National Collection of Type Cultures of the Health Protection Agency (HPA) (United Kingdom), and S. aureus was obtained from the microbiology stock culture of the School of Food Science and Environmental Health, Dublin Institute of Technology, Dublin, Ireland. The strains were maintained as frozen stocks at −70°C in the form of protective beads, which were plated onto tryptic soy agar (TSA) (Scharlau Chemie, Barcelona, Spain) and incubated overnight at 37°C to obtain single colonies before storage at 4°C.
Preparation of bacterial cell suspensions.
Cells were grown overnight (18 h) by inoculating isolated colonies of bacteria in tryptic soy broth without glucose (TSB-G) (Scharlau Chemie, Barcelona, Spain) at 37°C. Cells were harvested by centrifugation at 8,720 × g for 10 min. The cell pellet was washed twice with sterile phosphate-buffered saline (PBS) (Oxoid Ltd., United Kingdom). The pellet was resuspended in PBS, and the bacterial density was determined by measuring the absorbance at 550 nm using a McFarland standard (bioMérieux, Marcy l'Étoile, France). Finally, cell suspensions with a concentration of 108 CFU ml−1 were prepared in PBS.
HVACP system configuration.
The dielectric-barrier discharge (DBD) HVACP system used in this study consists of a high-voltage transformer (with input voltage of 230 V at 50 Hz) and a voltage variac (output voltage controlled within 0 to ∼120 kV) (Fig. 1). HVACP discharge was generated between two 15-cm-diameter aluminum electrodes separated by two Perspex (Perspex Distribution Ltd.) dielectric layers (10-mm and 1-mm thickness). The system was operated at a high voltage level of 80 kV (root mean square [kVRMS]) at atmospheric pressure. The voltage and input current characteristics of the system were monitored using an InfiniiVision 2000 X-Series oscilloscope (Agilent Technologies, Inc., USA). A polypropylene container, which acted as both a sample holder and an additional dielectric barrier, was placed between the two Perspex dielectric layers. The distance between the two electrodes was kept constant (2.2 cm) for all experiments.
FIG 1.
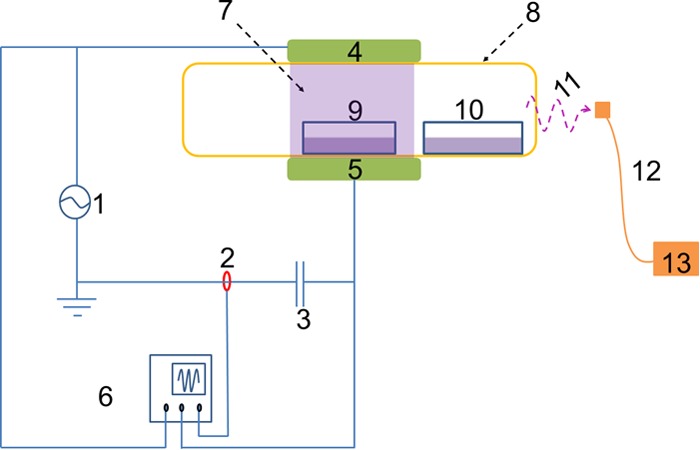
A schematic diagram of the HVACP device. 1, High voltage; 2, Bergoz current; 3, capacitor; 4, high-voltage electrode; 5, ground electrode; 6, oscilloscope; 7, plasma discharge; 8, sealed polypropylene (PP) container; 9, directly exposed; 10, indirectly exposed; 11, emission; 12, fiber optic cable; 13, spectrometer.
HVACP treatment.
For direct plasma treatment, a 10-ml bacterial cell suspension in phosphate-buffered saline (PBS) was aseptically transferred to a sterile plastic petri dish, which was placed in the center of the polypropylene container between the electrodes. For indirect plasma treatment, a separate container in which the sample petri dish was placed on the upper left corner of the container, outside the plasma-discharging area, was used. Each container was sealed in a high-barrier polypropylene bag (Cryovac; catalog no. B2630; Sealed Air Ltd., Duncan, SC, USA) using atmospheric air as a working gas for HVACP generation. Bacterial samples were then treated with HVACP at 80 kVRMS for 1, 3, and 5 min. After HVACP treatment, the samples were subsequently stored at room temperature for either 0, 1, or 24 h (23). Ozone concentrations were measured using Gastec gas tube detectors (product no. 18M; Gastec Corporation, Kanagawa, Japan) immediately after treatment and also after 1 or 24 h of storage. The containers were kept sealed to ensure the retention of contact with generated reactive species during posttreatment storage. Microbiological analyses were immediately applied after the respective posttreatment storage. All experiments were carried out in duplicate and replicated twice.
Microbiological analysis.
To quantify the effects of plasma treatment, 1 ml of treated samples was serially diluted in maximum recovery diluent (MRD) (Scharlau Chemie, Barcelona, Spain), and 0.1-ml aliquots of appropriate dilutions were surface plated on TSA. One milliliter and 0.1 ml of the treated sample were spread onto TSA plates, as described by the EN ISO 11290-2 method (ISO 11290-2:1998 [http://www.iso.org/iso/iso_catalogue/catalogue_tc/catalogue_detail.htm?csnumber=25570]). The limit of detection was 1 log CFU ml−1. The plates were incubated at 37°C for 24 h, and the CFU were counted. Any plates with no growth were incubated for up to 72 h and checked for the presence of colonies every 24 h. The results are reported in log CFU per milliliter.
Detection of reactive oxygen species after plasma treatment.
DCFH (2′,7′-dichlorodihydrofluorescein) is a cellular assay probe widely used for the detection of fluorescence in intracellular ROS. It revealed the concentrations of ROS in HVACP-treated samples.
After HVACP treatment and subsequent storage, cells were incubated with DCFH-diacetate (DA) (Sigma-Aldrich Ltd., Dublin, Ireland) at a final concentration of 5 μM in PBS for 15 min at 37°C. A 200-μl aliquot of each sample was transferred into a 96-well fluorescence microplate well (Fisher Scientific, United Kingdom) and measured by a Synergy HT multimode microplate reader (BioTek Instruments, Inc.) at excitation and emission wavelengths of 485 and 525 nm, respectively.
OES.
Optical emission spectroscopy (OES) of the discharge within empty packages was acquired with an Edmund Optics UV Enhanced Smart charge-coupled device (CCD) spectrometer with an optical fiber input. UV Enhanced Smart CCD spectrometers have been optimized for maximum performance in the UV and near-UV region and for multichannel operation with ultralow trigger delay. The spectral resolution of the system was 0.6 nm.
The fiber optic from the spectrometer was placed facing toward the package to allow the light to cross the center of the side wall of the polypropylene container. The fiber had an aperture of 0.22 mm and was optimized for use in the UV, visible, and near-infrared portions of the spectrum, with a wavelength range of 200 to 920 nm. A 5-mm-diameter lens collected light from a column across the diameter of the package and focused it onto a 200-μm multimode fiber. The other end of the 2-m-long fiber was connected to the spectrometer.
Cell membrane integrity.
Membrane integrity was examined by a determination of the release of intracellular materials absorbing at 260 and 280 nm (A260 and A280, respectively) (24). Untreated (bacterial cells in PBS) and HVACP-treated samples were centrifuged at 13,200 × g for 10 min. The untreated controls were used to determine the release of any intracellular material before HVACP treatment. A 200-μl supernatant of each sample was transferred to UV-transparent microtiter plate (Corning Life Science, USA) wells and measured at 260 nm and 280 nm by a Synergy HT multimode microplate reader.
DNA damage.
To further examine intracellular damage, double-strand DNA (dsDNA) concentrations were investigated after 24 h of storage, which provided adequate reaction time between ROS and cell components. SYBR green I [2-[N-(3-dimethylaminopropyl)-N-propylamino]-4-[2,3-dihydro-3-methyl-(benzo-1,3-thiazol-2-yl)-methylidene]-1-phenyl-quinolinium] is a highly sensitive detector of dsDNA and can be used to quantify nucleic acids. SYBR green I has been widely used in fluorescence analysis, real-time PCR, and biochip applications (25). In this study, it was used as an indicator of DNA damage with a digested cell solution. Lysozyme and lysostaphin hydrolyze the bacterial cell wall by breaking 1—4 bonds between N-acetyl-β-d-glucosamine (NAG), N-acetyl-β-d-muramic acid (NAM), and polyglycine cross-links present in the peptidoglycan (26).
Following HVACP treatment, the E. coli samples were incubated with 100 μg ml−1 lysozyme at 37°C for 4 h to break the cell envelope and release the intracellular DNA. Because of the different cellular structures in Gram-positive bacteria, the S. aureus samples were incubated with 100 μg ml−1 lysozyme and 10 μg ml−1 lysostaphin at 37°C for 4 h. Cell digestion effects were verified by colony counts on TSA plates. Cells without HVACP treatment were digested and used as a positive-control group, while untreated cells without digestion were used as negative controls. The bacterial envelope was considered completely digested when the survival rate was below the detection level.
After cell digestion, the solutions were incubated with SYBR green I (1:10,000 dilution; Sigma-Aldrich Ltd., Dublin, Ireland) at working concentration (1:1) for 15 min at 37°C. A 200-μl aliquot of each sample was transferred to a 96-well fluorescence microplate well (Fisher Scientific, United Kingdom) and measured at excitation and emission wavelengths of 485 and 525 nm, respectively, using a Synergy HT multimode microplate reader.
SEM.
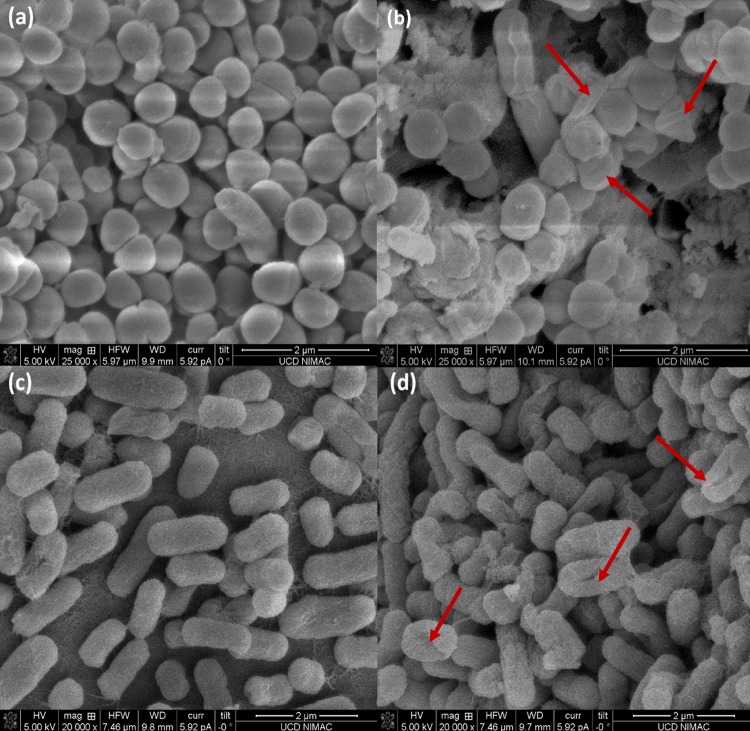
Bacterial samples in PBS exposed to plasma indirectly for a 1-min treatment with a posttreatment storage time of 24 h were selected for scanning electron microscopy (SEM) analysis. This was based on a noticeable difference in plasma inactivation efficacy with respect to posttreatment storage time. Bacterial cells were prepared as described by Thanomsub et al. (28) with minor modifications (27). Samples were then examined visually by using an FEI Quanta 3D field emission gun (FEG) dual-beam SEM (FEI Ltd., Hillsboro, OR, USA) at 5 kV.
Statistical analysis.
Statistical analysis was performed using SPSS 22.0 (SPSS, Inc., Chicago, IL, USA). The data represent the means from the results of experiments performed in duplicate and were replicated at least twice. The means were compared using analysis of variance (ANOVA) with Fisher's least significant difference (LSD) at the P ≤ 0.05 level.
RESULTS
Effect of treatment time and poststorage time on plasma inactivation efficacy.
The inactivation efficacy of HVACP against E. coli NCTC 12900 and S. aureus ATCC 25923 is shown in Tables 1 and 2. Inactivation was related to both treatment time and posttreatment storage time.
TABLE 1.
Surviving cell numbers of E. coli NCTC 12900 with respect to treatment and posttreatment storage times
| Posttreatment storage time (h) | Plasma treatment time (min) | Density by mode of plasma exposurea |
|||
|---|---|---|---|---|---|
| Direct |
Indirect |
||||
| Cell density (log10 CFU/ml) | SD | Cell density (log10 CFU/ml) | SD | ||
| 0 | 0b | 8.0 A | 0.0 | 8.0 A | 0.0 |
| 1 | 7.6 A | 0.1 | 7.3 B | 0.1 | |
| 3 | 4.3 B | 0.1 | 5.7 C | 0.1 | |
| 5 | 2.1 C | 0.7 | ND D | 0.0 | |
| 1 | 0b | 8.0 A | 0.0 | 8.0 A | 0.0 |
| 1 | 7.2 D | 0.1 | 7.1 B | 0.2 | |
| 3 | ND E | 0.0 | ND D | 0.0 | |
| 5 | ND E | 0.0 | ND D | 0.0 | |
| 24 | 0b | 8.0 A | 0.0 | 8.0 A | 0.0 |
| 1 | 5.9 DF | 0.1 | 6.1 BE | 0.8 | |
| 3 | ND E | 0.0 | ND D | 0.0 | |
| 5 | ND E | 0.0 | ND D | 0.0 | |
Different letters indicate a significant difference at the P ≤ 0.05 level between different treatment times and posttreatment storage times. ND, under detection limit.
Critical controls were provided as untreated samples with 0-, 1-, and 24-h posttreatment storage.
TABLE 2.
Surviving cell numbers of S. aureus ATCC 25923 with respect to treatment and posttreatment storage times
| Posttreatment storage time (h) | Plasma treatment time (min) | Density by mode of plasma exposurea |
|||
|---|---|---|---|---|---|
| Direct |
Indirect |
||||
| Cell density (log10 CFU/ml) | SD | Cell density (log10 CFU/ml) | SD | ||
| 0 | 0b | 7.9 A | 0.2 | 7.9 A | 0.2 |
| 1 | 6.1 B | 0.3 | 5.8 B | 0.3 | |
| 3 | 5.4 C | 0.6 | 5.3 C | 0.1 | |
| 5 | 1.8 D | 0.2 | 1.7 D | 0.1 | |
| 1 | 0b | 7.8 A | 0.2 | 7.8 A | 0.2 |
| 1 | 4.3 BF | 0.0 | 2.0 BF | 0.0 | |
| 3 | ND E | 0.0 | ND E | 0.0 | |
| 5 | ND E | 0.0 | ND E | 0.0 | |
| 24 | 0b | 7.8 A | 0.2 | 7.8 A | 0.2 |
| 1 | ND E | 0.0 | ND E | 0.0 | |
| 3 | ND E | 0.0 | ND E | 0.0 | |
| 5 | ND E | 0.0 | ND E | 0.0 | |
Different letters indicate a significant difference at the P ≤ 0.05 level between different treatment times and posttreatment storage times. ND, under detection limit.
Critical controls were provided as untreated samples with 0-, 1-, and 24-h posttreatment storage.
After 1 min of exposure of HVACP, E. coli samples decreased by around 2 log cycles in conjunction with 24-h posttreatment storage. When treatment time was increased to 3 min, bacterial populations were undetectable for both 1- and 24-h storage times. Without posttreatment storage, approximately 3.6- and 2.3-log cycle reductions were detected with direct and indirect exposure after 3 min of treatment, but further extending the treatment time to 5 min resulted in 6-log and at least 8-log cycle reductions for direct and indirect exposures, respectively (Table 1, P ≤ 0.05).
A similar trend of HVACP inactivation was recorded for S. aureus. With 24 h of storage, all treatment times used led to undetectable levels of bacteria, irrespective of the mode of exposure. Increasing the treatment time from 1 min to 3 or 5 min yielded undetectable levels with direct and indirect exposures, respectively, after 1 h of storage. With no posttreatment storage time, populations declined by approximately 1.8- and 6.1-log cycles when the treatment time was increased from 1 min to 5 min with direct exposure (Table 2, P ≤ 0.05). Similar effects were achieved with indirect exposure.
Effect on cell membrane integrity.
The absorbance at 260 and 280 nm, a measure commonly used for the quantification of DNA and protein concentration, can also indicate the release of intracellular DNA and protein and loss of cell integrity (24). Different trends in E. coli and S. aureus were observed from their absorbance at 260 nm measured following plasma treatment (Fig. 2 and 3).
FIG 2.
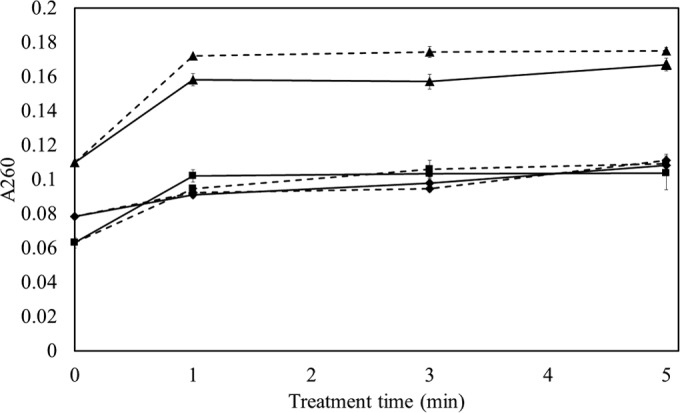
Absorbance of HVACP-treated E. coli NCTC 12900 suspension in PBS at 260 nm with different posttreatment storage times. The data points at 0 min of treatment time refer to untreated control stored for 0 h (■), 1 h (◆), and 24 h (▲) in PBS. Treatment times were 1, 3, and 5 min at 80 kVRMS at the different posttreatment storage times. Solid line, direct exposure; dotted line, indirect exposure.
FIG 3.
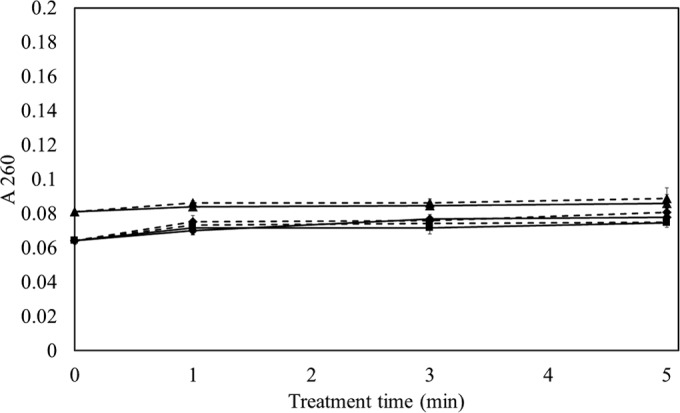
Absorbance of HVACP-treated S. aureus ATCC 25923 suspension in PBS at 260 nm with different posttreatment storage times. The data points at 0 min of treatment time refer to the untreated control stored for 0 h (■), 1 h (◆), and 24 h (▲) in PBS. Treatment times were 1, 3, and 5 min at 80 kVRMS at the different posttreatment storage times. Solid line, direct exposure; dotted line, indirect exposure.
For E. coli, all absorbance curves showed similar trends (Fig. 2). With 24 h of posttreatment storage, a sharp increase in absorbance followed by a steady stage indicated that the cell integrity was compromised within 1 min of HVACP treatment. In the case of the 0- and 1-h posttreatment storage samples, a sharp increase at 1 min of treatment was followed by a gradual increase in absorbance as a function of treatment time (P ≤ 0.05). In contrast, no leakage was recorded for S. aureus, even after 5 min of treatment (Fig. 3, P > 0.05). However, a small increase in absorbance was observed for the 24-h posttreatment storage sample group for both the control and treated samples. Similar trends were observed at 280 nm (data not shown).
Reactive oxygen and nitrogen species.
The emission spectrum is presented in Fig. 4a. Analysis of the discharge was carried out in air at 80 kVRMS over the range of 200 to 920 nm. Distinct peaks obtained in the near-UV and visible regions corresponded to strong emissions from N2 and N2+ excited species. The in-package ozone concentration after HVACP treatment was investigated using colorimetric tubes, which revealed its correlation with treatment and posttreatment storage times (Table 3). The in-package ozone densities were similar for each bacterial sample. Treatment time and posttreatment storage time had positive and negative effects, respectively, on the ozone concentration detected. The detected ozone concentrations were not significantly different from those of containers of E. coli or S. aureus samples with the same treatment parameters. No ozone was detected under either treatment condition after the 24-h posttreatment storage time. In air DBD ACPs, the well-known generation-depletion cycle of ozone is interlinked with that of nitrogen oxides through several gas phase reactions that generate N2O, NO, and O atoms starting from O2 and N2* (where the asterisk indicates the excited state of N2) (29). In Fig. 4b, one of the major emission intensities of the second positive N2 system (at 336.65 nm [Fig. 4a]) from the empty box and sample packages is shown.
FIG 4.
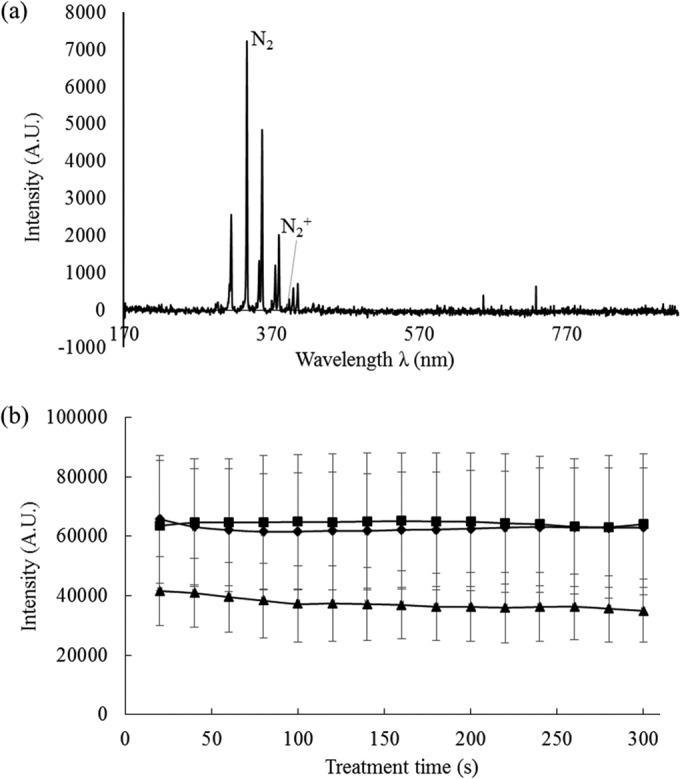
Emission spectrum of dielectric barrier discharge atmospheric cold plasma operating in air under atmospheric pressure. (a) Emission spectrum of empty box; (b) emission intensity at 336.65 nm. ■, empty box; ▲, direct exposure; ◆, indirect exposure. A.U., absorbance units.
TABLE 3.
In-package ozone concentration after different HVACP treatment and posttreatment storage times with both E. coli and S. aureus samples
| Posttreatment storage time (h) | Plasma treatment time (min) | Ozone concn (ppm)a |
|
|---|---|---|---|
| Direct | Indirect | ||
| 0 | 1 | 1,600 | 1,800 |
| 3 | 2,400 | 3,000 | |
| 5 | 4,200 | 4,400 | |
| 1 | 1 | 100 | 120 |
| 3 | 180 | 190 | |
| 5 | 330 | 350 | |
| 24 | 1 | ND | ND |
| 3 | ND | ND | |
| 5 | ND | ND | |
ND, nondetectable.
The concentrations of ozone and nitrogen oxides (O3, NO2, NO3, and N2O4) for this setup were quantified using absorption spectroscopy (OAS) and are reported elsewhere (29). The ozone measurements using the gas detectors are comparable to those reported using OAS.
The oxidant-sensing fluorescent probe DCFH-DA is a nonpolar dye, which is converted into the nonfluorescent polar derivative DCFH by cellular esterases and switched to highly fluorescent dichlorofluorescein (DCF) when oxidized by intracellular ROS and other peroxides (30). It has widely been used for intracellular detection with fluorescence analysis. The fluorescence signal correlated with the intracellular ROS density. Figure 5 shows the intracellular ROS density results of E. coli and S. aureus in PBS, in which a similar trend of ROS generation in response to HVACP is demonstrated for the two bacteria. With regard to the effect of mode of exposure, with indirect treatment, the ROS density increased gradually as a function of treatment time from 1 min to 5 min, compared with direct treatment, for which ROS density was lower with prolonged treatment.
FIG 5.
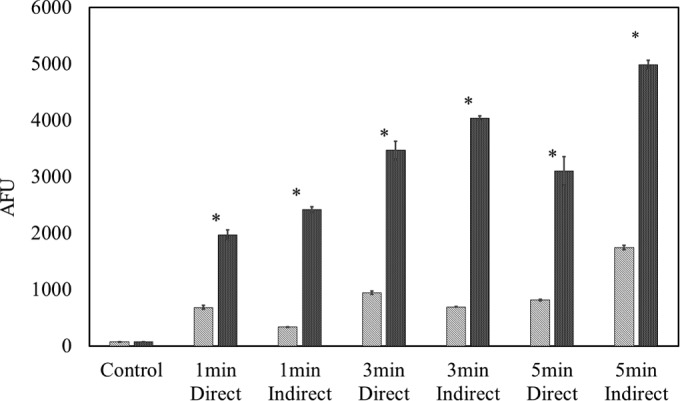
E. coli NCTC 12900 and S. aureus ATCC 25923 intracellular ROS density assay by DCFH-DA. Treatment times were 1, 3, and 5 min at 80 kVRMS with 0 h of posttreatment storage. Striped bars, E. coli NCTC 12900; dark shaded bars, S. aureus ATCC 25923. The presence of an asterisk (*) indicates a significant difference at the P ≤ 0.05 level between E. coli and S. aureus. Critical controls were provided as untreated samples with no posttreatment storage. AFU, arbitrary fluorescence units.
DNA damage.
Figure 6 presents the dsDNA quantities of E. coli and S. aureus before and after HVACP treatment. The control groups from the two bacteria obtained similar signal strengths, which infers similar initial DNA amounts from the samples. However, different signal levels were observed from the two treated strains. E. coli samples showed a reduction in fluorescence signal, which correlated with treatment time. However, there was only a trace of fluorescence signal from S. aureus samples after treatment (P ≤ 0.05).
FIG 6.
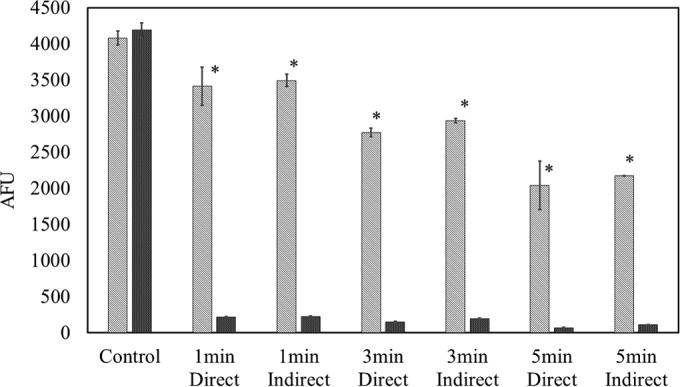
E. coli NCTC 12900 and S. aureus ATCC 25923 DNA quantification assay by SYBR green 1. Treatment times were 1, 3, and 5 min at 80 kVRMS with 24 h of posttreatment storage. Striped bars, E. coli NCTC 12900; dark shaded bars, S. aureus ATCC 25923. The presence of an asterisk (*) indicates a significant difference at the P ≤ 0.05 level between E. coli and S. aureus. Critical controls were provided as untreated samples with no posttreatment storage. AFU, arbitrary fluorescence units.
SEM.
From the SEM results (Fig. 7), more visible damage was evident on E. coli surfaces than on those of S. aureus, indicating cell breakage effects for E. coli inactivation, while HVACP treatment caused irregular shape and cell shrinkage in S. aureus.
FIG 7.
SEM images of control and treated cells after indirect exposure with plasma at 80 kVRMS for 1 min following 24 h of posttreatment storage. (a) Untreated S. aureus ATCC 25923; (b) treated S. aureus ATCC 25923; (c) untreated E. coli NCTC 12900; (d) treated E. coli NCTC 12900. Red arrows indicate the significantly different damaging patterns on cell envelopes of E. coli and S. aureus.
Proposed inactivation mechanism.
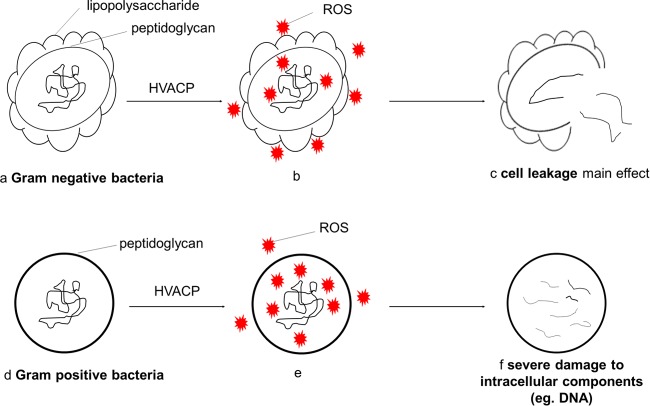
Figure 8 illustrates the proposed mechanism of action of ACP with Gram-negative and Gram-positive bacteria based on the results described here for E. coli and S. aureus. After HVACP treatment, the reactive oxygen species generated, which are associated with process and system parameters, attack both cell envelope and intracellular components. For Gram-negative cells, the cell envelope is the major target of ROS. Reactions of ROS with cell components cause disruption of the cell envelope and result in leakage, with some possible damage to intracellular components (e.g., DNA). For Gram-positive cells, the intracellular components are the major targets of ROS. Reactions of ROS will cause severe damage to intracellular components (e.g., DNA) but not cell leakage. Lower intracellular ROS in Gram-negative bacteria can be the result of both ROS depletion by cell envelope components and cell leakage.
FIG 8.
Proposed mechanism of action of HVACP with Gram-negative and Gram-positive bacteria. (a to c) Proposed inactivation mechanism of Gram-negative bacteria. (a) Structure of Gram-negative bacteria before treatment, in which the cell envelope consists of a thin layer of peptidoglycan and lipopolysaccharide; (b) ACP-generated ROS attacking both cell envelope and intracellular components, in which the cell envelope is the major target; (c) inactivation mainly caused by cell leakage, with some DNA damage possible. (d to f) Proposed inactivation mechanism of Gram-positive bacteria. (d) Structure of Gram-positive bacteria before treatment, in which the cell envelope consists of a thick rigid layer of peptidoglycan; (e) ACP-generated ROS attacking both cell envelope and intracellular components, in which intracellular materials are the major targets; (f) inactivation mainly caused by intracellular damage (e.g., DNA breakage) but not leakage.
DISCUSSION
From the inactivation efficacy results, there is clearly a strong effect of increasing treatment time, even without considering posttreatment storage time. However, a surviving population might be below the detection limit, with recovery possible during storage under some treatment and storage conditions. No further enrichment procedures were employed in this study. Incorporating the posttreatment storage time significantly increased the inactivation efficacy, especially with the 24-h posttreatment storage time, which might be attributed to the amount of reactive species generated and their extended reaction time with bacteria (Tables 1 and 2). Similar results were observed in our previous study (18). A posttreatment storage time for which antimicrobial efficacy is retained has a 2-fold potential advantage, whereby the initial exposure might be minimal with enhanced efficacy during storage, which is compatible with the treatment of sensitive samples. Additionally, a posttreatment storage stage is compatible with many industrial processes. However, with applications to the food, beverage, and pharmaceutical industries in mind, the strong oxidative effect with long HVACP exposure time might adversely affect some ingredients by inducing surface oxidation, which has been observed in ozone-related food sterilization technologies (31). A challenge for developing HVACP applications in the food industry is to optimize the dose or gas mixtures applied to ensure the minimization of microbiological risks while maintaining food quality characteristics.
A hypothetical mechanism of action of HVACP against E. coli and S. aureus was concluded, as shown in Fig. 8. Different reaction mechanisms with ROS and cell components are discussed below, as determined from reactive species and cell damage results.
The leakage studies recorded pointed to different modes of action. High leakage levels were observed with all treatment and posttreatment storage steps for E. coli (P ≤ 0.05) but not for S. aureus (P > 0.05) (Fig. 2 and 3). The cell walls of Gram-positive bacteria consist of peptidoglycan with a tight structure and strength, while Gram-negative bacteria are covered by a thin layer of peptidoglycan and an outer membrane of lipopolysaccharide. During plasma treatment, generated ROS can react with both lipopolysaccharide and peptidoglycan, thus breaking the molecular structure by damaging C—O, C—N, and C—C bonds (32–34). However, obvious leakage was observed from E. coli only. With the higher lipid content, lipid peroxidation may have taken place on lipopolysaccharides and resulted in breakage of the cell envelope (19). This might suggest that reactive species reacted with the cell wall in different patterns. Reactions with other cell wall components, such as peptidoglycan, might also be involved. Furthermore, Fig. 7 visually illustrates the difference between E. coli and S. aureus after HVACP treatment and further supports our hypothesis regarding the pattern of damage. The effect of shrinkage but not breakage has also been reported on another Gram-positive bacterium, Listeria monocytogenes (35).
As a main inactivation species, the in-package ozone level showed a strong correlation with treatment time and posttreatment storage time but not with the type of bacterium in the sample (Table 3). However, the fluorescent signal recorded for S. aureus was three times that of E. coli, thus indicating a much higher intracellular ROS density in S. aureus than that for E. coli (Fig. 5, P ≤ 0.05). A similar correlation of ROS generation with time was reported by other researchers using plasma jet treatment. Intracellular ROS increased over 5 min of treatment by air plasma from a jet (36), with a similar trend reported for the generation of RNS (37). Plasma treatment time determines the input energy during discharge. As the key reactive species for oxygen-containing working gases, the generation of ROS consumes most of the energy in air plasma. It has been suggested that in-package ROS can penetrate cell membranes by active transport across the lipid bilayer or transient opening of pores in the membrane (3). This might explain the correlation between treatment time and ozone/intracellular ROS. The mode of exposure also adds complexity, as an obvious difference in reactive species was observed from the OES and DCFH-DA assay according to mode of exposure (Fig. 4 and 5). Lower levels of reactive species were detected in samples exposed to direct plasma than in the indirectly exposed samples. This might be due to the quenching effect of liquid between electrodes on the ionization of gases. However, similar inactivation levels and cell component damage were recorded. During direct treatment, undetectable ROS, mostly very short-lived and transient species, might react immediately with cell components and be transformed. It appears that cells were damaged by the relatively long-lived species associated with indirect treatment, such as higher ozone levels.
After plasma discharge, the ozone concentrations in the gas phase were determined to be independent of the type of bacterium, while intracellular ROS levels were strongly correlated with both process parameter and target bacterium characteristic. This might contribute to the different reaction and diffusion patterns of ROS to the cells. Based on the absorbance results at 260 nm in Fig. 2 and 3, HVACP-generated ROS might react with the cell wall rather than enter the cell in E. coli samples, while ROS accumulates inside the S. aureus cells.
E. coli samples showed a reduction in fluorescence signal of DNA correlating with treatment time, as shown in Fig. 6. This trend elucidated that DNA damage has a plasma dose-dependent pattern. There was only a trace of fluorescence signal from S. aureus samples posttreatment, indicating greater DNA damage than with E. coli. It has been reported that plasma-induced oxidative stress damage in S. aureus is due to intracellular oxidative reactions (38).
Overall, treatment time and posttreatment storage time had strong effects on inactivation efficacy against E. coli and S. aureus in this study, with a lower impact observed for mode of plasma exposure. The amount of reactive species generated, including ozone, has been correlated with inactivation efficacy (12, 36, 39–41). Among the reactive species generated during HVACP treatment, ROS contributed as major antimicrobial factors. Their concentrations were governed by plasma dose and applied gas compositions (18). The generation of ozone as an indicator of ROS showed a time-dependent pattern, while intracellular ROS had a similar trend. During penetration, ROS might react with the lipid content in the cell membrane and cause certain kinds of damage. Compared with Gram-positive bacteria, the membranes of Gram-negative bacteria were more vulnerable. Visible damage as a result of plasma exposure was previously observed for E. coli (13).
A much higher intracellular ROS density detected in S. aureus showed the probable penetration of reactive species within the cell. At the same time, higher concentrations of reactive species overall might lead to more intracellular damage to cell components, such as DNA, which was clearly noted in this study. Since the total amount of ROS generated using any system or process setting is around the same level and is independent of the target bacterial characteristics, it is apparent that less cell envelope damage may be associated with more intracellular damage.
In this study, the HVACP inactivation efficacy of E. coli and S. aureus bacteria was correlated with process and system parameters (i.e., treatment time or posttreatment storage time). These determined the amount and reaction time of reactive species, which were the essential factors of antimicrobial reactions. Two different possible mechanisms of inactivation were observed in the selected Gram-negative and Gram-positive bacteria. Reactive species either reacted with the cell envelope or damaged intracellular components. E. coli was inactivated by cell envelope damage-induced leakage, while S. aureus was mainly eliminated by intracellular damage. Additionally, the different cell damage mechanisms might be due to different types of reactive species with regard to the mode of exposure. These findings are critical for the successful development of plasma applications in which the system and process parameters can be nuanced in relation to the target risk characteristics presented.
ACKNOWLEDGMENT
We declare no conflicts of interest.
Funding Statement
The research leading to these results has received funding from the European Community’s Seventh Framework Programme under grant agreement 285820.
REFERENCES
- 1.Bárdos L, Baránková H. 2010. Cold atmospheric plasma: sources, processes, and applications. Thin Solid Films 518:6705–6713. doi: 10.1016/j.tsf.2010.07.044. [DOI] [Google Scholar]
- 2.Misra NN, Tiwari BK, Raghavarao KSMS, Cullen PJ. 2011. Nonthermal plasma inactivation of food-borne pathogens. Food Eng Rev 3(3-4):159–170. [Google Scholar]
- 3.Sensenig R, Kalghatgi S, Cerchar E, Fridman G, Shereshevsky A, Torabi B, Arjunan KP, Podolsky E, Fridman A, Friedman G. 2011. Nonthermal plasma induces apoptosis in melanoma cells via production of intracellular reactive oxygen species. Ann Biomed Eng 39:674–687. doi: 10.1007/s10439-010-0197-x. [DOI] [PMC free article] [PubMed] [Google Scholar] [Retracted]
- 4.Dobrynin D, Wasko K, Friedman G, Fridman AA, Fridman G. 2011. Cold plasma sterilization of open wounds: live rat model. Plasma Med 1:109–114. doi: 10.1615/PlasmaMed.2011002698. [DOI] [Google Scholar]
- 5.Cullen PJ, Milosavljević V. 2015. Spectroscopic characterization of a radio-frequency argon plasma jet discharge in ambient air. Prog Theor Exp Phys 2015:063J001. [Google Scholar]
- 6.Kayes MM, Critzer FJ, Kelly-Wintenberg K, Roth JR, Montie TC, Golden DA. 2007. Inactivation of foodborne pathogens using a one atmosphere uniform glow discharge plasma. Foodborne Pathog Dis 4:50–59. doi: 10.1089/fpd.2006.62. [DOI] [PubMed] [Google Scholar]
- 7.Basaran P, Basaran-Akgul N, Oksuz L. 2008. Elimination of Aspergillus parasiticus from nut surface with low pressure cold plasma (LPCP) treatment. Food Microbiol 25:626–632. doi: 10.1016/j.fm.2007.12.005. [DOI] [PubMed] [Google Scholar]
- 8.Klämpfl TG, Isbary G, Shimizu T, Li Y-F, Zimmermann JL, Stolz W, Schlegel J, Morfill GE, Schmidt H-U. 2012. Cold atmospheric air plasma sterilization against spores and other microorganisms of clinical interest. Appl Environ Microbiol 78:5077–5082. doi: 10.1128/AEM.00583-12. [DOI] [PMC free article] [PubMed] [Google Scholar]
- 9.Lerouge S, Wertheimer M, Marchand R, Tabrizian M, Yahia L. 2000. Effect of gas composition on spore mortality and etching during low-pressure plasma sterilization. J Biomed Mater Res 51:128–135. [DOI] [PubMed] [Google Scholar]
- 10.Purevdorj D, Igura N, Ariyada O, Hayakawa I. 2003. Effect of feed gas composition of gas discharge plasmas on Bacillus pumilus spore mortality. Lett Appl Microbiol 37:31–34. doi: 10.1046/j.1472-765X.2003.01341.x. [DOI] [PubMed] [Google Scholar]
- 11.Zhang M, Oh JK, Cisneros-Zevallos L, Akbulut M. 2013. Bactericidal effects of nonthermal low-pressure oxygen plasma on S. Typhimurium LT2 attached to fresh produce surfaces. J Food Eng 119:425–432. doi: 10.1016/j.jfoodeng.2013.05.045. [DOI] [Google Scholar]
- 12.Joshi SG, Cooper M, Yost A, Paff M, Ercan UK, Fridman G, Friedman G, Fridman A, Brooks AD. 2011. Nonthermal dielectric-barrier discharge plasma-induced inactivation involves oxidative DNA damage and membrane lipid peroxidation in Escherichia coli. Antimicrob Agents Chemother 55:1053–1062. doi: 10.1128/AAC.01002-10. [DOI] [PMC free article] [PubMed] [Google Scholar]
- 13.Dobrynin D, Fridman G, Friedman G, Fridman A. 2009. Physical and biological mechanisms of direct plasma interaction with living tissue. New J Phys 11:115020. doi: 10.1088/1367-2630/11/11/115020. [DOI] [Google Scholar]
- 14.Boxhammer V, Morfill GE, Jokipii JR, Shimizu T, Klämpfl T, Li YF, Köritzer J, Schlegel J, Zimmermann JL. 2012. Bactericidal action of cold atmospheric plasma in solution. New J Phys 14:113042. doi: 10.1088/1367-2630/14/11/113042. [DOI] [Google Scholar]
- 15.Davies BW, Bogard RW, Dupes NM, Gerstenfeld TA, Simmons LA, Mekalanos JJ. 2011. DNA damage and reactive nitrogen species are barriers to Vibrio cholerae colonization of the infant mouse intestine. PLoS Pathog 7:e1001295. doi: 10.1371/journal.ppat.1001295. [DOI] [PMC free article] [PubMed] [Google Scholar]
- 16.Gaunt LF, Beggs CB, Georghiou GE. 2006. Bactericidal action of the reactive species produced by gas-discharge nonthermal plasma at atmospheric pressure: a review. IEEE Trans Plasma Sci 34:1257–1269. doi: 10.1109/TPS.2006.878381. [DOI] [Google Scholar]
- 17.Boxhammer V, Li Y, Köritzer J, Shimizu T, Maisch T, Thomas H, Schlegel J, Morfill G, Zimmermann J. 2013. Investigation of the mutagenic potential of cold atmospheric plasma at bactericidal dosages. Mutat Res 753:23–28. doi: 10.1016/j.mrgentox.2012.12.015. [DOI] [PubMed] [Google Scholar]
- 18.Han L, Patil S, Keener KM, Cullen PJ, Bourke P. 2014. Bacterial inactivation by high-voltage atmospheric cold plasma: influence of process parameters and effects on cell leakage and DNA damage. J Appl Microbiol 116:784–794. doi: 10.1111/jam.12426. [DOI] [PubMed] [Google Scholar]
- 19.Laroussi M, Mendis DA, Rosenberg M. 2003. Plasma interaction with microbes. New J Phys 5:41.41-41.10. doi: 10.1088/1367-2630/5/1/341. [DOI] [Google Scholar]
- 20.Okubo M, Kuroki T, Miyairi Y, Yamamoto T. 2004. Low-temperature soot incineration of diesel particulate filter using remote nonthermal plasma induced by a pulsed barrier discharge. IEEE Trans Ind Appl 40:1504–1512. doi: 10.1109/TIA.2004.836129. [DOI] [Google Scholar]
- 21.Braoudaki M, Hilton AC. 2004. Low level of cross-resistance between triclosan and antibiotics in Escherichia coli K-12 and E. coli O55 compared to E. coli O157. FEMS Microbiol Lett 235:305–309. doi: 10.1111/j.1574-6968.2004.tb09603.x. [DOI] [PubMed] [Google Scholar]
- 22.Brown DF. 2001. Detection of methicillin/oxacillin resistance in staphylococci. J Antimicrob Chemother 48:65–70. doi: 10.1093/jac/48.suppl_1.65. [DOI] [PubMed] [Google Scholar]
- 23.Ziuzina D, Patil S, Cullen PJ, Keener KM, Bourke P. 2013. Atmospheric cold plasma inactivation of Escherichia coli in liquid media inside a sealed package. J Appl Microbiol 114:778–787. doi: 10.1111/jam.12087. [DOI] [PubMed] [Google Scholar]
- 24.Virto R, Manas P, Alvarez I, Condon S, Raso J. 2005. Membrane damage and microbial inactivation by chlorine in the absence and presence of a chlorine-demanding substrate. Appl Environ Microbiol 71:5022–5028. doi: 10.1128/AEM.71.9.5022-5028.2005. [DOI] [PMC free article] [PubMed] [Google Scholar]
- 25.Zipper H, Brunner H, Bernhagen J, Vitzthum F. 2004. Investigations on DNA intercalation and surface binding by SYBR green I, its structure determination and methodological implications. Nucleic Acids Res 32:e103. doi: 10.1093/nar/gnh101. [DOI] [PMC free article] [PubMed] [Google Scholar]
- 26.Goldman E, Green LH. 2008. Practical handbook of microbiology, 2nd ed CRC Press, Boca Raton, FL. [Google Scholar]
- 27.Patil S, Valdramidis VP, Karatzas KAG, Cullen PJ, Bourke P. 2011. Assessing the microbial oxidative stress mechanism of ozone treatment through the responses of Escherichia coli mutants. J Appl Microbiol 111:136–144. doi: 10.1111/j.1365-2672.2011.05021.x. [DOI] [PubMed] [Google Scholar]
- 28.Thanomsub B, Anupunpisit V, Chanphetch S, Watcharachaipong T, Poonkhum R, Srisukonth C. 2002. Effects of ozone treatment on cell growth and ultrastructural changes in bacteria. J Gen Appl Microbiol 48:193–199. doi: 10.2323/jgam.48.193. [DOI] [PubMed] [Google Scholar]
- 29.Moiseev T, Misra N, Patil S, Cullen P, Bourke P, Keener K, Mosnier J. 2014. Post-discharge gas composition of a large-gap DBD in humid air by UV-Vis absorption spectroscopy. Plasma Sources Sci Technol 23:065033. doi: 10.1088/0963-0252/23/6/065033. [DOI] [Google Scholar]
- 30.Gomes A, Fernandes E, Lima JLFC. 2005. Fluorescence probes used for detection of reactive oxygen species. J Biochem Biophys Methods 65:45–80. doi: 10.1016/j.jbbm.2005.10.003. [DOI] [PubMed] [Google Scholar]
- 31.Kim J-G, Yousef AE, Dave S. 1999. Application of ozone for enhancing the microbiological safety and quality of foods: a review. J Food Prot 62:1071–1087. [DOI] [PubMed] [Google Scholar]
- 32.Chung TY, Ning N, Chu JW, Graves DB, Bartis E, Seog J, Oehrlein GS. 2013. Plasma deactivation of endotoxic biomolecules: vacuum ultraviolet photon and radical beam effects on lipid A. Plasma Process Polym 10:167–180. [Google Scholar]
- 33.Yusupov M, Neyts E, Khalilov U, Snoeckx R, Van Duin A, Bogaerts A. 2012. Atomic-scale simulations of reactive oxygen plasma species interacting with bacterial cell walls. New J Phys 14:093043. doi: 10.1088/1367-2630/14/9/093043. [DOI] [Google Scholar]
- 34.Yusupov M, Bogaerts A, Huygh S, Snoeckx R, van Duin AC, Neyts EC. 2013. Plasma-induced destruction of bacterial cell wall components: a reactive molecular dynamics simulation. J Phys Chem C 117:5993–5998. doi: 10.1021/jp3128516. [DOI] [Google Scholar]
- 35.Cullen PJ, Misra N, Han L, Bourke P, Keener K, O'Donnell C, Moiseev T, Mosnier JP, Milosavljević V. 2014. Inducing a dielectric barrier discharge plasma within a package. IEEE Trans Plasma Sci 42:2368–2369. doi: 10.1109/TPS.2014.2321568. [DOI] [Google Scholar]
- 36.Ali A, Kim YH, Lee JY, Lee S, Uhm HS, Cho G, Park BJ, Choi EH. 2014. Inactivation of Propionibacterium acnes and its biofilm by non-thermal plasma. Curr Appl Phys 14(Suppl 2):S142–S148. [Google Scholar]
- 37.Cheng X, Sherman J, Murphy W, Ratovitski E, Canady J, Keidar M. 2014. The effect of tuning cold plasma composition on glioblastoma cell viability. PLoS One 9:e98652. doi: 10.1371/journal.pone.0098652. [DOI] [PMC free article] [PubMed] [Google Scholar]
- 38.Zhang Q, Liang Y, Feng H, Ma R, Tian Y, Zhang J, Fang J. 2013. A study of oxidative stress induced by non-thermal plasma-activated water for bacterial damage. Appl Phys Lett 102:203701. doi: 10.1063/1.4807133. [DOI] [Google Scholar]
- 39.Arjunan KP, Friedman G, Fridman A, Clyne AM. 2012. Non-thermal dielectric barrier discharge plasma induces angiogenesis through reactive oxygen species. J R Soc Interface 9:147–157. doi: 10.1098/rsif.2011.0220. [DOI] [PMC free article] [PubMed] [Google Scholar]
- 40.Ishaq M, Kumar S, Varinli H, Han Z, Rider AE, Evans MD, Murphy AB, Ostrikov KK. 2014. Atmospheric gas plasma-induced ROS production activates TNF-ASK1 pathway for the induction of melanoma cancer cell apoptosis. Mol Biol Cell 25:1523–1531. [DOI] [PMC free article] [PubMed] [Google Scholar]
- 41.Brun P, Vono M, Venier P, Tarricone E, Deligianni V, Martines E, Zuin M, Spagnolo S, Cavazzana R, Cardin R, Castagliuolo I, Valerio AL, Leonardi A. 2012. Disinfection of ocular cells and tissues by atmospheric-pressure cold plasma. PLoS One 7:e33245. doi: 10.1371/journal.pone.0033245. [DOI] [PMC free article] [PubMed] [Google Scholar]


