

Summary
Sarcoidosis is a granulomatous inflammatory disorder of unknown aetiology. The increased frequency of activated lung CD4+ T cells with a T helper type 1 (Th1) cytokine profile in sarcoidosis patients is accompanied by a reduced proportion and/or impaired function of regulatory T cells (Tregs). Here we evaluated the expression of the inducible co‐stimulator (ICOS) on lung and blood CD4+ T cell subsets in sarcoidosis patients with different prognosis, by flow cytometry. Samples from the deep airways were obtained by bronchoalveolar lavage (BAL). We show that Tregs from the inflamed lung of sarcoidosis patients were characterized by a unique ICOShigh phenotype. High‐level ICOS expression was restricted to Tregs from the inflamed lung and was absent in blood Tregs of sarcoidosis patients as well as in lung and blood Tregs of healthy volunteers. In addition, lung Tregs exhibited increased ICOS expression compared to sarcoid‐specific lung effector T cells. Strikingly, ICOS expression on Tregs was in particularly high in the lungs of Löfgren's syndrome (LS) patients who present with acute disease which often resolves spontaneously. Moreover, blood monocytes from LS patients revealed increased ICOS‐L levels compared to healthy donors. Sarcoidosis was associated with a shift towards a non‐classical monocyte phenotype and the ICOS‐Lhigh phenotype was restricted to this particular monocyte subset. We propose a potential implication of the ICOS/ICOS‐L immune‐regulatory axis in disease activity and resolution and suggest to evaluate further the suitability of ICOS as biomarker for the prognosis of sarcoidosis.
Keywords: ICOS, ICOS‐L, Löfgren's syndrome, regulatory T cells, sarcoidosis
Introduction
Sarcoidosis is a systemic inflammatory disease of unknown aetiology that is characterized by non‐caseating epithelioid granuloma formations that may affect multiple organs, with the lung most commonly affected 1. Sarcoidosis occurs worldwide, among all races, but with a variable prevalence. For instance, in the Swedish population the prevalence of sarcoidosis is estimated at approximately 60/100 000 2. As a hallmark of lung sarcoidosis, high numbers of activated CD4+ T cells 3 and activated macrophages 4 that are involved in granuloma formation are found typically in bronchoalveolar lavage (BAL) fluid of patients. Usually, sarcoidosis lung T cells exhibit a T helper type 1 (Th1) cytokine profile showing increased production of interferon (IFN)‐γ and interleukin (IL)‐2 5, 6. A subgroup of sarcoidosis patients present with Löfgren's syndrome (LS), which is characterized by acute onset with bilateral hilar lymphadenopathy, erythema nodosum and/or bilateral ankle arthritis or periarticular inflammation, and usually fever. Patients with LS often show spontaneously resolving disease, while patients without LS (non‐LS; NLS) often present with an insidious onset and are likely to develop chronic disease. LS is correlated strongly with carriage of human leucocyte antigen D‐related (HLA‐DR)B1*0301 (DR3), and DR3+ patients typically show an expansion of T cell receptor (TCR) AV2S3+CD4+ T cells in the lungs 7. Based on this robust correlation it has been hypothesized that in DR3+ patients the HLA‐DR3 molecules present a sarcoidosis‐related antigen, which is recognized specifically by AV2S3+CD4+ T cells in the lung 8. Later, it was confirmed that AV2S3+CD4+ T cells constitute an effector T cell population characterized by the production of Th1 cytokines 9. Altogether, T cells are considered to play a central role in the inflammatory process of sarcoidosis 3, 10.
Regulatory T cells (Tregs) are considered to be essential for control of the ongoing inflammatory process 11. Importantly, for Swedish sarcoidosis patients a reduced Treg frequency in BAL CD4+ T cells has been reported and the remaining BAL Tregs display decreased expression of the Treg‐specific transcription factor forkhead box protein 3 (FoxP3). There was also a decreased expression of the immune‐regulatory cytokine IL‐10 in BAL CD4+ T cells 9. However, another study found increased frequencies of Tregs, but with a reduced capacity to inhibit cytokine secretion in sarcoidosis 12. Thus, the poor regulation of inflammation in sarcoidosis has been attributed to a reduced number and/or impaired function of Tregs.
The inducible co‐stimulator (ICOS) is a T cell co‐stimulatory molecule induced upon TCR ligation 13. ICOS provides a positive signal to T cells by binding to its ligand (ICOS‐L) on professional antigen‐presenting cells (APCs) such as B cells, macrophages and dendritic cells (DCs) 14, as well as other cell types, including endothelial 15 and epithelial 16 cells. Initially, ICOS was shown to enhance the proliferation and differentiation of T cells via the induction of certain cytokines such as IL‐4 17, IL‐5, interferon (IFN)‐γ and IL‐10 13. In particular, the interaction of ICOS with ICOS‐L is well known to superinduce the synthesis of IL‐10, a potent anti‐inflammatory cytokine 18. This observation suggested a crucial role of the ICOS/ICOSL pathway in immune regulation that has recently been increasingly appreciated. Consistently, IL‐10 producing Tregs and in particular naturally occurring Tregs were shown to express high levels of ICOS 19. Several human studies revealed strong evidence for the important contribution of ICOS in Treg function. For instance, newly diagnosed type 1 diabetic children had a defect in the induction of FoxP3 and ICOS expression 20. Furthermore, a substantial expression of ICOS on Tregs and decidual T cells was recognized to be crucial for preserving the immune homeostasis at the feto–maternal interface 21. Of note, the induction of T cell anergy and the suppressive capacity of CD4+ T cells were blocked by knocking down the ICOS molecule by RNA interference and by blocking ICOS/ICOS‐L interaction, respectively, in cells derived from healthy volunteers. Moreover, as a means of confirming the role of ICOS in immune regulation, CD4+ T cells from ICOS‐deficient patients were also shown to be completely resistant to anergy induction and further differentiation into suppressive T cells 22. Further, it has been shown that ICOS+ Tregs were reduced among patients with chronic inflammatory atherosclerosis 23 and ICOS‐expressing Tregs have been shown to possess superior suppressive capacities in human diseases 24.
Not only ICOS, but also its counterpart ICOS‐L, expressed on APCs, has recently been appreciated for its role in the regulation of immune responses 25. It has been shown that DCs expressing ICOS‐L attain immune‐regulatory properties. ICOS‐L expressed on DCs was shown exclusively to drive the generation of IL‐10‐producing Tregs 26, 27. Therefore, ICOS‐L is also being regarded as one of the co‐inhibitory molecules, as Treg‐mediated immune‐suppression is strictly dependent upon it 28.
Given the fact that sarcoidosis is a CD4+ T cell‐driven inflammatory disorder that involves dysregulated Treg frequencies and function and the well‐documented role of the ICOS/ICOS‐L axis in the regulation of inflammatory processes, we sought to evaluate the expression of ICOS and ICOS‐L on lung and blood CD4+ T cell subsets and on monocytes, respectively, in the context of pulmonary sarcoidosis. We included sarcoidosis patients with distinct clinical phenotypes (LS and NLS) associated with good and poor prognosis, respectively, as well as healthy control volunteers in the survey. The overall aim of the study was to gain a better understanding of the potential role of the ICOS/ICOS‐L immune regulatory axis for disease activity and resolution in sarcoidosis patients.
Materials and methods
Study subjects
Newly diagnosed sarcoidosis patients from the Stockholm region of Sweden were enrolled at the Lung Allergy Clinic, Karolinska University Hospital, Solna, Sweden. All patients had a clinical picture in accordance with pulmonary sarcoidosis that were determined by their symptoms (such as cough, dyspnoea and fatigue), chest radiography and pulmonary function tests. Furthermore, all patients underwent bronchoscopy for obtaining bronchoalveolar lavage fluid (BALF) samples. They were diagnosed with sarcoidosis according to criteria established by the World Association of Sarcoidosis and other Granulomatous Disorders (WASOG) 29. BALF was obtained from both sarcoidosis patients (n = 15) and self‐declared healthy controls (n = 6). Similarly, peripheral blood from venous puncture was also drawn subsequently from both sarcoidosis patients (n = 13) and healthy controls (n = 14). Sarcoidosis patients were subdivided further into LS and NLS. None of the patients received anti‐inflammatory or immunosuppressive medications. All study subjects gave written informed consent and the study was approved by the Regional Ethical Review Board in Stockholm. The characteristics of the patients and healthy BAL sample donors are outlined in Table 1. The basic characteristics of healthy blood donors (n = 8) (excluding BAL sample donors, who also donated blood) include their average age of 45 years (34–63); gender (two men/six women); and smoking history (no smokers/eight non‐smokers). Healthy controls who underwent bronchoscopy had normal lung function as determined by dynamic spirometry [forced expiratory volume in one second (FEV1), forced vital capacity (FVC)] and normal chest X‐ray.
Table 1.
Characteristics of sarcoidosis patients and healthy controls undergoing bronchoscopy with BAL.
| Löfgren's syndrome | Non‐Löfgrens syndrome | Healthy controls | |
|---|---|---|---|
| Basic characteristics | |||
| No of individuals (n) | 7 | 8 | 6 § |
| Age at sample collection (years) | 40 (32–51) | 44 (32–65) | 24 (21–30) |
| Gender (men/women) | 5/2 | 6/2 | 3/3 |
| Smoking (smokers/never/ex‐smokers) | 4/3/0 | 1/3/3/n.d. | 1/5/0 |
| Chest X‐ray stage (0/I/II/III/IV/n.d.**) | 0/3/2/0/0/2 | 0/2/4/1/0/1 | 6/0/0/0/0/0 |
| HLA‐DR3+/DR3– * | 6/1 | 2/6 | – |
| BAL analysis | |||
| Recovery (% of instilled volume) | 62·8 (52–77) | 58·7 (44–80) | 78·5 (72–84) ¤ |
| Total cell numbers (×106) | 38·0 (17·8–59·7) | 25 (12·1–43·9) | 17·1 (13·1–23·2) $ |
| Total cell concentration (×106/l) | 244·3 (102·3–382) | 172·6 (85·4–269·8) | 88·3 (62·4–119·6) $$ |
| BAL differential cell counts | |||
| % Macrophages | 71·3 (29·5–95) | 77·0 (67·6–91) | 91·9 (82–97·8) ¤ |
| % Lymphocytes | 26·1 (4·5–68·5) | 20·7 (9–30·6) | 6·6 (1·8–17) ¤ |
| % Neutrophils | 1·8 (0·5–3·3) | 1·5 (0–4) | 1·4 (0·4–2·6) |
| % Eosinophils | 0·4 (0–1·4) | 0·3 (0–0·6) | 0·1 (0–0·2) |
| BAL T cell markers | |||
| CD4/CD8 ratio | 16·3 (2·2–54) | 5·4 (1·5–11·5) | 1·8 (0·7–3·4) $$ |
| % TCR AV2S3+ CD4 T cells | 23·3 (3·6–48·6) | 8·2 (2·7–34·4) | 4·7 (2·1–6·5) |
| Pulmonary function tests | |||
| VC (%) | 83·6 (68–96) (n = 6) | 80·4 (57–99) (n = 5) | – † |
| FEV1 (%) | 86·1 (64–107) (n = 6) | 85·4 (60–113) (n = 7) | – |
| DLCO (%) | 79·3 (56–111) (n = 3) | 75 (57–89) (n = 4) | – |
¤ P ≤ 0·05; for comparison with non‐Löfgren's syndrome;
$ P ≤ 0·05;
$$ P ≤ 0·01 for comparison with Löfgren's syndrome;
*For two of the patients the classification as DR3+ or DR3– was based on the presence or absence, respectively, of a T cell receptor (TCR) AV2S3+ expansion in brochoalveolar lavage (BAL);
†Described in Methods;
§In addition to these individuals, who provided BAL and blood samples, eight other healthy controls provided only blood samples (see methods). Data are shown as median (min–max). Pulmonary function tests (values show % of predicted); VC = vital capacity; FEV1 = forced expiratory volume in 1 s; DLCO = diffusing capacity of the lung for carbon monoxide; chest X‐ray tests, stage 0 = normal; stage I = bilateral hilar lymphoma (BHL); stage II = BHL with parenchymal infiltrates; stage III = parenchymal infiltrates; stage IV = fibrotic changes and volume reduction; **n.d. = not defined; n = number of patients.
Bronchoscopy and BAL cell handling
Bronchoscopy was performed according to the previously described method 30. Briefly, before bronchoscopy, patients or healthy controls were given local anaesthetics. Bronchoscopy was performed with a flexible fiberoptic bronchoscope. BAL was performed by passing the bronchoscope either transorally or transnasally and it was wedged into the middle‐lobe bronchus. For BALF collection, five 50 ml aliquots of prewarmed phosphate‐buffered saline (PBS) were sequentially instilled and aspirated. The recovered BALF was collected in a siliconized plastic bottle that was kept on ice and transported immediately to the laboratory for further analysis. The mean recovery of the instilled PBS was 61% (min–max range 44–80%).
The BALF was strained through a dacron net (Millipore, Billerica, MA, USA) in order to remove debris. Subsequently, BAL cells were pelleted from the fluidic part by centrifuging at 400 g at 4°C for 10 min and pelleted BAL cells were resuspended in RPMI‐1640 medium (Sigma‐Aldrich, St Louis, MO, USA). Cells were counted in a Bürker chamber and the cell viability was determined by Trypan blue exclusion. Differential counts were performed by cytocentrifugation (Cytospin 2; Shandon Southern Products Ltd, Runcorn, UK) at 50 g for 3 min before the cells were stained by May–Grünwald–Giemsa.
Peripheral blood mononuclear cells (PBMCs)
Whole blood from sarcoidosis patients and healthy controls was collected into sodium heparinized tubes. PBMCs were isolated using Ficoll‐Paque PLUS (GE Healthcare, Uppsala, Sweden), according to the standard laboratory protocol. The isolated mononuclear cells were then counted in a Bürker chamber and stained with respective antibody cocktails (see below) for the flow cytometric analysis.
HLA typing
HLA‐DR typing was performed on DNA using polymerase chain reaction (PCR) with sequence‐specific primers 31.
Flow cytometry
As a routine diagnostic procedure, BAL cells were analysed by flow cytometry for the ratio of CD4/CD8 and also for the frequency of AV2S3+CD4+ T cells. For this study, the following markers on BAL lymphocytes, blood lymphocytes and blood monocytes were analysed by flow cytometry: for the T cell panel, cells were stained with fluorescent‐labelled monoclonal antibodies against CD3‐Pacific blue (558117; BD Bioscience, San Jose, CA, USA), CD4‐allophycocyanin (APC)‐H7 (641398; BD Bioscience), CD8‐Amcyan (339188; BD Bioscience), AV2S3‐fluorescein isothiocyanate (FITC) (TCR2663; NordicBiolabs, Täby, Sweden), ICOS‐APC (17‐9948‐41, eBioscience), FoxP3‐PE (124776‐71; AH Diagnostics, Aarhus, Denmark). The FoxP3 staining was performed according to the instruction manual using the FoxP3 staining kit (72‐5776‐40; AH Diagnosics). For the monocyte panel, cells were stained with CD14‐APC‐Cy7 (25‐0149‐41; eBioscience), CD16‐FITC (11‐0168; eBioscience) and ICOS‐L‐PE (12‐5889‐41; eBioscience). Mouse serum was used as Fc‐block. ICOS and ICOS‐L expression were measured as MFI (median fluorescent intensity) following background deduction. Flow cytometric analysis was performed using a FACS Canto II (BD Biosciences) and the FACS Diva software version 6·1·2.
Statistical analysis
The differences in the frequencies of T cell subsets and monocytes between sarcoidosis patients (combined patients or grouped into LS and NLS) and healthy controls were determined using either the non‐parametric Mann–Whitney U‐test or the Kruskal–Wallis test with Dunn's post‐test (in the figures, the lower, mid and upper horizontal lines of the boxes represent the 25th, 50th and 75th percentiles, respectively; the vertical lines extend from the 10th to the 90th percentiles). Wilcoxon's signed‐rank test was used for the comparison between BAL and blood in the same individuals. All statistical analyses were performed by GraphPad Prism version 5·02 (GraphPad Software Inc., San Diego, CA, USA). A two‐tailed P‐value < 0·05 was considered significant.
Results
Regulatory CD4+ T cells from the inflamed lung of sarcoidosis patients are characterized by high‐level ICOS expression
Because sarcoidosis is considered a CD4+ T cell‐mediated inflammatory disease, we first compared the percentages of CD4+ T cells and CD4+FoxP3+ Tregs in BAL obtained from sarcoidosis patients and healthy controls. In line with published data 9, we confirmed significantly increased frequencies of BAL CD4+ T cells and an overall decreased proportion of BAL FoxP3+CD4+ T cells (Tregs) in sarcoidosis patients (Fig. 1a,b). Interestingly, the ICOS expression level (depicted as mean fluorescent intensity, MFI) on BAL Tregs, but not on total BAL CD4+ T cells, was increased significantly in sarcoidosis patients when compared to corresponding BAL T cell subsets from healthy controls (Fig. 1b and Supporting information, Fig. S1a). Moreover, comparing ICOS expression on BAL Tregs with that on total BAL CD4+ T cells within the same donor, we found significantly increased ICOS expression on Tregs compared to total CD4+ T cells in sarcoidosis patients (Fig. 1c). As expected, increased ICOS expression on BAL Tregs was observed as well in healthy controls, although the overall ICOS expression level was markedly below that observed on Tregs from sarcoidosis patients (Fig. 1d).
Figure 1.
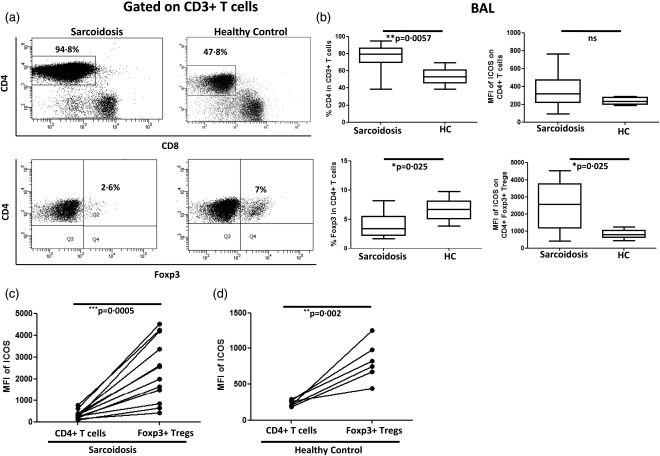
Increased ICOS expression on brochoalvolar lavage (BAL) regulatory T cells (Tregs) of sarcoidosis patients. (a) Representative fluorescence activated cell sorter (FACS) dot‐plot gated on BAL CD3+ T cells showing the frequencies of CD4+ T cells and CD4+ forkhead box protein 3 (FoxP3)+ Tregs in sarcoidosis patients and healthy controls. (b) Box‐plots represent % CD4+ T cells in sarcoidosis patients (n = 14) and normal controls (n = 6) (upper left) and ICOS expression level (as mean fluorescence intensity = MFI) on CD4+ T cells in patients and controls (upper right). Similarly, box‐plots represent % Tregs in sarcoidosis patients (n = 13) and healthy controls (n = 6) (lower left) as well as inducible co‐stimulator (ICOS) expression (as MFI) on Tregs in patients and controls (lower right). P‐values were calculated using the Mann–Whitney U‐test. (c) Paired comparison was performed for comparing MFI of ICOS between total CD4+ T cells and Tregs among the sarcoidosis patients and (d) healthy controls. P‐values were calculated using Wilcoxon's matched‐pairs test. The lines indicate T cell population and subpopulation derived from the same patient.
To reinforce this finding and to avoid the potential impact of the Treg population within the total CD4+ T cell pool on our results, we further compared the expression of ICOS between BAL Tregs (CD4+FoxP3+ T cells) and BAL non‐Tregs (CD4+FoxP3– T cells)) from the same donors. Results were essentially the same, i.e. we observed significantly higher ICOS expression on BAL Tregs than on BAL non‐Tregs and an overall higher ICOS expression on Tregs from sarcoidosis patients compared to healthy controls (Supporting information, Fig. S1b). Comparing peripheral blood samples from sarcoidosis patients and healthy controls, we did not find significant differences either in the frequencies of CD4+ T cells and Tregs or in the expression levels of ICOS on both total CD4+ T cells and Tregs (data not shown). Of note, we observed elevated ICOS expression on blood Tregs when compared to blood non‐Tregs, however, with a similar expression pattern in both sarcoidosis patients and healthy controls (Supporting information, Fig. S1c). Moreover, there were no significant differences in ICOS expression on non‐Tregs (or effector cells) between sarcoidosis patients and healthy controls in BAL and blood (Supporting information, Fig. S1d,e), respectively. As these data suggest a particularly high ICOS expression on Tregs at the site of inflammation, i.e. in the inflamed lung, we next directly compared ICOS expression on Tregs obtained from the airways and the peripheral blood of sarcoidosis patients and healthy controls. Indeed, we found that ICOS expression was increased significantly on BAL Tregs compared to blood Tregs in sarcoidosis patients but not in controls (Fig. 2a–c). Taken together, we found elevated ICOS expression, particularly on Tregs isolated from the site of ongoing inflammation, the lung, of sarcoidosis patients.
Figure 2.
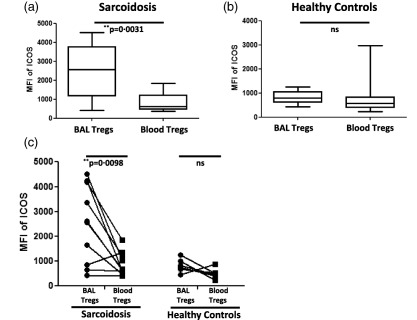
Inducible co‐stimulator (ICOS)high regulatory T cells (Tregs) are present in the lung but not the blood of sarcoidosis patients and are absent in healthy controls. (a) Box‐plots represent the mean fluorescence intensity (MFI) of ICOS on brochoalvolar lavage (BAL) Tregs (n = 13) and peripheral blood Tregs (n = 11) of sarcoidosis patients. (b) Box‐plots represent the MFI of ICOS on BAL Tregs (n = 6) and peripheral blood Tregs (n = 14) of healthy controls. P‐values were calculated using the Mann–Whitney U‐test. (c) Paired comparisons were performed for comparing MFI of ICOS on BAL Tregs and blood Tregs within the same sarcoidosis patients (n = 10) and healthy controls (n = 6). P‐values were calculated using Wilcoxon's matched‐pairs test. The lines indicate T cell subpopulation in BAL and blood derived from the same patient and control.
Löfgren's syndrome is associated with elevated ICOS expression on regulatory T cells in the inflamed lung
Next, we investigated ICOS expression on Tregs from sarcoidosis patients with and without LS and NLS. As mentioned in the Introduction, these groups differ in clinical manifestations, with LS patients generally having a good prognosis, often with spontaneous disease resolution. We did not find any significant differences regarding the frequencies of BAL Tregs between the groups (Fig. 3a). However, ICOS expression on BAL Tregs from LS patients was increased markedly when compared to the healthy control group (Fig. 3a), and there was a tendency to higher ICOS expression on BAL Tregs in LS compared to NLS patients. Elevated ICOS expression was found on BAL Tregs when compared to total BAL CD4+ T cells both in LS (Fig. 3b) and NLS (Fig. 3c) patients.
Figure 3.
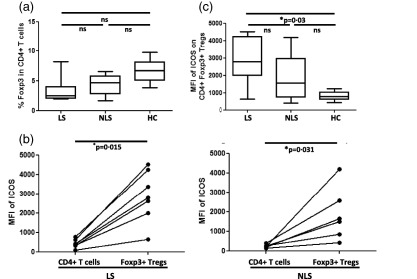
Elevated inducible co‐stimulator (ICOS) expression on brochoalvolar lavage (BAL) regulatory T cells (Tregs) of Löfgren's syndrome (LS) patients. (a) Box‐plots represent comparative analysis for % Tregs (left) and mean fluorescence intensity (MFI) of ICOS on Tregs (right) in LS (n = 7), non‐Löfgren's syndrome (NLS) (n = 6) and healthy controls (n = 6). P‐values were calculated using one‐way analysis of variance (anova) non‐parametric Kruskal–Wallis test with Dunn's post‐test. (b,c) Paired comparisons were performed for comparing MFI of ICOS between total CD4+ T cells and Tregs in LS and NLS patients. P‐values were calculated using Wilcoxon's matched‐pairs test. The lines indicate T cell population and subpopulation derived from the same patient.
Again we addressed whether ICOS expression on Tregs is increased specifically at the site of inflammation, i.e. the affected lung. Strikingly, while this was indeed the case for LS patients who showed significantly increased expression of ICOS on BAL Tregs compared to blood Tregs (Fig. 4a), this was not true for Tregs obtained from NLS patients (Fig. 4b). A direct comparison of ICOS expression on BAL and blood Tregs in patients from whom matched BAL and blood samples were available revealed a strong tendency to elevated ICOS expression on BAL Tregs (Fig. 4c). However, due probably to the limited number of patients included in this survey, the data did not reach statistical significance. In conclusion, our data suggest increased expression of ICOS on BAL Tregs especially in LS patients who, in contrast to NLS patients, are characterized by their capacity to recover spontaneously from sarcoidosis.
Figure 4.
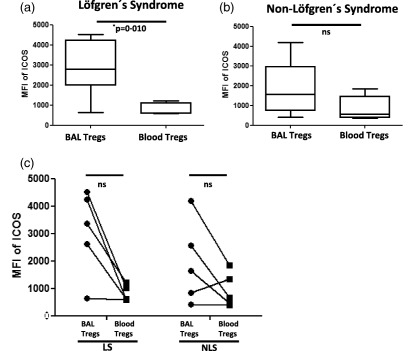
Löfgren's syndrome (LS) is characterized by the specific increase of inducible co‐stimulator (ICOS) expression on lung regulatory T cells (Tregs), which is more pronounced than in non‐Löfgren's syndrome (NLS). (a) Box‐plots represent the mean fluorescence intensity (MFI) of ICOS on brochoalvolar lavage (BAL) Tregs (n = 7) and blood Tregs (n = 5) in LS patients. (b) Similarly, box‐plots represent the MFI of ICOS on BAL Tregs (n = 6) and blood Tregs (n = 6) in the NLS patients. P‐values were calculated using the Mann–Whitney U‐test. (c) Paired comparison was performed for comparing MFI of ICOS between BAL Tregs and blood Tregs among the same LS and NLS patients. P‐values were calculated using Wilcoxon's matched‐pairs test. The lines indicate T cell subpopulation in BAL and blood derived from the same patient.
ICOS expression on disease‐associated TCR AV2S3+ CD4+ T effector cells is comparable to that observed on polyclonal CD4+ T cells
As DR3+ sarcoidosis patients (typically with LS) virtually always show an accumulation of highly activated and differentiated TCR AV2S3+CD4+ T effector cells in the bronchoalveolar space, we next sought to characterize ICOS expression on this particular subset of T effector cells. As depicted in Supporting information, Fig. S2, we neither observed any significant differences in ICOS expression between BAL AV2S3+CD4+ T cells and total CD4+ T cells in samples obtained from HLA‐DR3+ sarcoidosis patients, nor when AV2S3+CD4+ BAL T cells from DR3+ sarcoidosis patients were compared to the total CD4+ BAL T cells of healthy controls (Supporting information, Fig. S2a). Furthermore, there was no difference in ICOS expression between AV2S3+CD4+ T effector cells and AV2S3–CD4+ T cells (Supporting information, Fig. S2b). We also compared the expression level of ICOS on AV2S3+CD4+ T effector cells to Tregs in BAL fluid from DR3+ sarcoidosis patients and, more specifically, from LS patients. As observed previously for the polyclonal CD4+ T cell pool (Figs 1 and 3), we found a significantly increased expression of ICOS on BAL Tregs from sarcoidosis (Fig. 5a) as well as from LS (Fig. 5b) patients when compared to AV2S3+CD4+ T effector cells. Thus, we show that with respect to ICOS expression levels, disease‐associated AV2S3+CD4+ T effector cells do not differ from the polyclonal BAL CD4+ T cells with different TCR usages.
Figure 5.
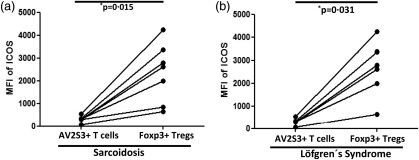
Sarcoidosis patients exhibit increased inducible co‐stimulator (ICOS) expression on brochoalvolar lavage (BAL) regulatory T cells (Tregs) and modest ICOS expression on BAL disease‐related T effector cells. Paired comparisons were performed for comparing mean fluorescence intensity (MFI) of ICOS between the expanded AV2S3+ CD4+ T cells (which represent sarcoid‐specific effector cells) and BAL Tregs of (a) human leucocyte antigen D‐related (HLA‐DR3+ sarcoidosis patients and (b) HLA‐DR3+ LS patients. P‐values were calculated using Wilcoxon's matched‐pairs test. The lines indicate T cell subpopulations in BAL derived from the same patient.
Sarcoidosis is associated with a shift towards a non‐classical monocyte phenotype and elevated ICOS‐L expression level on this monocyte subset
As ICOS mediates its immune regulatory function by binding to its ligand 14, we next analysed the expression of ICOS‐L on total blood monocytes from sarcoidosis patients and healthy controls. Interestingly, we observed a significantly increased expression of ICOS‐L on sarcoidosis blood monocytes when compared to healthy controls (Supporting information, Fig. S3a). Furthermore, when subdividing the patients into LS and NLS, we noticed an increased expression of ICOS‐L on monocytes from LS patients compared to healthy controls (Supporting information, Fig. S3b) that is in accordance with increased ICOS expression on BAL Tregs specifically in this patient subset (Fig. 3a). Based on these data, we classified monocytes further into classical and non‐classical monocytes on the basis of their CD14 and CD16 expression profile (Fig. 6a). The non‐classical monocytes are usually considered as proinflammatory cells 32, 33. As expected for an inflammatory disease such as sarcoidosis, we observed a shift in the monocyte population with significantly increased proportion of proinflammatory non‐classical monocytes and decreased frequencies of classical monocytes among the sarcoidosis patients when compared to healthy controls (Fig. 6b). Also, the expression of ICOS‐L on non‐classical monocytes was significantly higher in patients than in controls (Fig. 6b), while no differences with respect to ICOS‐L expression level were observed on classical monocytes. Only minor differences were observed regarding the monocyte composition and ICOS‐L expression on monocyte subsets among LS and NLS patients (data not shown), leading to the overall conclusion that sarcoidosis is associated with an increased frequency of proinflammatory non‐classical monocytes in the peripheral blood which display increased ICOS‐L expression, while only marginal differences exist between LS and NLS patient subgroups. There was a significantly increased frequency of intermediate monocytes (CD14++CD16+) in sarcoidosis patients compared to controls (Supporting information, Fig. S3c). However, no significant difference was observed in ICOSL expression on intermediate monocytes (Supporting information, Fig. S3d).
Figure 6.
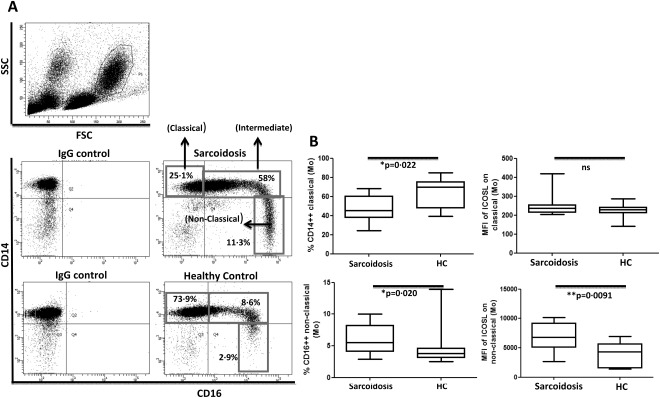
Increased proportion of non‐classical blood monocytes with higher inducible co‐stimulator ligand (ICOS‐L) expression in sarcoidosis patients. (a) Representative fluorescence activated cell sorter (FACS) dot‐plot gated on blood monocyte populations in peripheral blood mononuclear cells (PBMCs) showing the frequencies of classical, intermediate and non‐classical (proinflammatory) monocytes in sarcoidosis patients (n = 11) and healthy controls (n = 13). (b) Box‐plots represent the % CD14highCD16low monocytes (classical) in sarcoidosis patients and healthy controls (upper left) and the intensities of ICOS‐L [as mean fluorescence intensity (MFI)] on classical monocytes in patients and controls (upper right). Box‐plots represent the % CD14lowCD16high monocytes (non‐classical) in sarcoidosis patients and healthy controls (lower left) and the intensities of ICOS‐L (as MFI) on non‐classical monocytes in patients and controls (lower right). P‐values were calculated using the Mann–Whitney U‐test.
Discussion
To our knowledge, this is the first study to investigate the expression of ICOS on T cells and its counterpart ICOS‐L on monocytes in patients with sarcoidosis. In fact, several studies have been published previously showing an apparent role of ICOS expressed on cells of the inflamed tissues in perpetuating inflammatory disease pathogenesis 34, 35, 36. The main reason for showing ICOS to be involved in disease propagation, rather than in the regulation of inflammation, might be due to the fact that ICOS expression was analysed in general on the total CD4+ T cell pool either at the site of inflammation or in the periphery. In this study, we subdivided T cells into regulatory T cells (CD4+FoxP3+ Tregs), sarcoid‐specific effector T cells (AV2S3+CD4+ T cells) and non‐regulatory T cells (CD4+FoxP3– T cells) for evaluating ICOS expression levels. In line with a previous study 9, we observed reduced Treg frequencies in BAL from sarcoidosis patients. However, the remaining Tregs were found to possess high‐level ICOS expression. This ICOShigh Treg phenotype was found specifically at the site of inflammation, suggesting a potential link to enhanced Treg activation and/or function in the inflamed lung of sarcoidosis patients. Of note, ICOS expression on Tregs has already been shown to amplify the proliferation 37 and to enhance the suppressive functions of Tregs 38. Mechanistically, it has been shown that ICOS+ Tregs secrete both IL‐10 and transforming growth factor (TGF)‐β which, in turn, suppress the function of several cell types including DCs and T cells, respectively 19. Thus, our observation that ICOS expression is increased on Tregs in the inflamed lungs of sarcoidosis patients is of potential interest in light of the fact that sarcoidosis is considered a T cell‐mediated inflammatory disease, and disease control may be directly dependent upon the presence of highly potent Tregs. Importantly, we observed the highest ICOS expression on BAL Tregs from LS patients who have been demonstrated previously to exhibit reduced Th1 responses 39, and are known to be able to recover spontaneously from acute sarcoidosis within 2–3 years following disease onset. Therefore, it is tempting to speculate that one possible reason for the spontaneous resolution in LS patients might be linked mechanistically to the presence of highly efficacious ICOShigh Tregs.
Generally, high‐level ICOS expression on T cells was shown to be limited to the inflammatory zone during the disease progression 36. Similarly, we show here that elevated ICOS expression is limited to Tregs present at the inflammatory site (lung) and is not found on peripheral blood Tregs from sarcoidosis patients. Moreover, increased ICOS expression on lung Tregs was evident only in the sarcoidosis patients and was not observed in healthy controls, underlining the fact that ICOS over‐expressing Tregs in the lung of sarcoidosis patients exhibit an ‘inflammation‐seeking’ phenotype. Accumulation of ICOShigh Tregs in the inflamed tissue might be due to the high probability of migrating ICOS+ Tregs that might express the chemokine receptor CXCR3 guiding them into the inflamed lungs 40. Therefore, we may speculate that the chemoattraction of ICOS+ Tregs from the periphery to, or their induction/expansion in, the inflamed lungs might represent a mechanism counteracting ongoing inflammation in the lung which is particularly efficient in LS patients who recover spontaneously from acute lung sarcoidosis. In support of this, we have shown previously that IL‐10 expression in BAL CD4+ T cells of LS patients did not differ significantly from that of healthy controls, but was reduced significantly in NLS patients 9. We may speculate that ICOShigh Tregs in BAL might be the source for IL‐10 expression in LS patients 19. In line with this hypothesis, it was shown very recently that spontaneous resolution from acute sarcoidosis was accompanied mainly by the restoration of functional Tregs with highly suppressive capabilities 41.
The mechanisms behind disease resolution in sarcoidosis have not been established definitively. AV2S3+CD4+ T effector cells have been proposed to play a significant role in eliminating a so far unknown sarcoidosis antigen and thus promote spontaneous resolution in DR3+ patients 42, In addition, Tregs are thought to be a prerequisite for sarcoidosis resolution, and different underlying mechanisms are currently discussed. One study showed that Tregs from sarcoidosis patients are partially dysfunctional in suppressing tumour necrosis factor (TNF‐α) and IFN‐γ 12, whereas another study demonstrated that sarcoidosis is associated with Tregs dysfunctional in suppression of cytokine secretion and proliferation 41. Of note, these studies were based on blood Tregs. Importantly, our study clearly showed high‐level ICOS expression exclusively on lung but not on blood Tregs in sarcoidosis patients. In this context, it has been shown that ICOShigh Tregs have a stronger suppressive capacity than ICOSlow Tregs 43. Also, in the study by Miyara et al. 12, the suppressive nature of sarcoid BAL Tregs seemed to be more robust when compared to that of blood Tregs, which may account for the presence of Tregs with increased ICOS expression in the lung of sarcoidosis patients, although this issue has not been addressed specifically.
ICOS has also been shown to be involved in T helper cell function supporting antibody production and in the secretion of Th1 and Th17 cytokines in the context of human autoimmune diseases 34, 35, 36. It was therefore of interest to determine ICOS expression on effector cells being involved in the pathogenesis of sarcoidosis. In this study, we focused on disease‐related AV2S3+CD4+ T effector cells that are known to display a highly activated phenotype (CD69+, CD28+ and HLA‐DR+) with lesser expression of CD25 44. Thus, AV2S3+CD4+ T cells have been classified as effector cells, as they possess negligible FoxP3 expression 9 and also produce proinflammatory cytokines such as IFN‐γ and TNF‐α when stimulated in vitro 45. Intriguingly, despite their well‐documented T effector cell phenotype, the expression of ICOS on BAL AV2S3+CD4+ T cells from sarcoidosis patients was multifold lower than on Tregs from the same patients. Not only AV2S3+CD4+ T effector cells, but also other CD4+ T cells consisting of FoxP3– naive and potential effector cells present in the polyclonal CD4+ BAL T cell pool were characterized by a low ICOS expression compared to Tregs, as there was no difference in ICOS expression on non‐Tregs between patients and controls. Thus, based on its expression pattern, ICOS seems to play a prominent role in sarcoidosis Tregs (most pronounced in LS Tregs), but is induced only modestly on sarcoidosis T effector cells.
In addition to our finding that ICOS expression is elevated on Tregs in the inflamed lung of sarcoidosis patients, it was an interesting observation that this corresponded with an elevated ICOS‐L expression on sarcoid total blood monocytes. Moreover, monocyte classification based on CD14 and CD16 expression revealed that the proportion of circulating non‐classical and intermediate blood monocytes were increased among our Swedish sarcoidosis patient cohort, which is partly consistent with an earlier study performed in Japanese patients 46. However, that study was performed before the current classification into three monocyte subsets was adopted in 2011 47. A shift within the monocyte population towards the proinflammatory non‐classical monocytes has been documented, as well in other human inflammatory diseases such as Kawasaki syndrome 48, rheumatoid arthritis 32, atherosclerosis 33 and obesity 49. Furthermore, elevated levels of proinflammatory monocytes were also reported during mycobacterial infection 50, which is one of the postulated causative agents for sarcoidosis. Therefore, it was not unexpected to also notice the increased proportion of non‐classical monocytes in inflammatory sarcoidosis. What was, however, not predictable from previous studies was our finding that non‐classical blood monocytes from sarcoidosis patients display elevated ICOS‐L expression. Importantly, the up‐regulation of ICOS‐L on human DCs, especially plasmacytoid DCs (pDCs), has already been shown to drive the generation of IL‐10‐producing Tregs 26, 28. Furthermore, the up‐regulation of ICOS‐L on monocytes/DCs could be induced by inflammatory cytokines such as IFN‐γ 51, and possibly TNF‐α 52, both potent cytokines implicated in sarcoidosis pathogenesis 5, 53. Notably, inflammatory cytokines such as TNF‐α and IL‐6 can act as a driving factor for the generation of IL‐10‐producing Tregs through ICOS/ICOS‐L interactions 27. As a possible limitation regarding the monocyte analysis, it should be mentioned that although the great majority of natural killer (NK) cells are confined to the lymphocyte population (based on forward‐ and side‐scatter properties in flow cytometric analysis) we cannot exclude the possibility that some CD16+ NK cells may be present in the monocyte gate. To avoid this potential error source, future studies should include a pan‐monocyte marker, as was suggested recently 54.
In light of our finding that in sarcoidosis patients ICOShigh Tregs are detected in the inflamed lungs, and that this is accompanied by an increased proportion of non‐classical monocytes which over‐express ICOS‐L, we hypothesize that the ICOS/ICOS‐L axis might indeed be involved critically in the regulation of ongoing T cell‐mediated inflammation in the lung. This is corroborated further by the observation that especially LS patients, with the capacity to spontaneously recover from the disease, display high‐level ICOS expression on BAL Tregs and elevated ICOS‐L expression on blood monocytes. However, further functional studies are needed to confirm experimentally the functional implication of ICOS/ICOS‐L in the course and/or resolution of sarcoidosis. For future studies, we also need to consider the fact that FoxP3 alone could not be considered as a definitive marker to define Treg populations in human subjects, unless it is confirmed by functional studies 55. Moreover, prospective studies should be performed to clarify whether those LS patients who recover exhibit higher ICOS expression on BAL Tregs compared to patients who do not recover.
If this were held true, the ICOS expression level on BAL Tregs could be considered as a potential new prognostic marker for sarcoidosis. Of note, we have shown previously in a murine infection model that targeting ICOS on T cells by ICOS‐specific agonistic antibodies can increase the Treg to T effector cell ratio, thus resulting in reduced immune‐mediated pneumonia 56. A better understanding of the contribution of the ICOS/ICOS‐L axis in disease progression and/or recovery might therefore also identify ICOS as a potential therapeutic target for specific immune intervention in sarcoidosis.
Disclosure
The authors have no disclosures.
Author contributions
P. S. performed the experiments; P. S. analysed the data; P. S., D. B. and J. W. designed the study; P. S. wrote the paper; D. B., J. W., J. G. and A. E. revised the manuscript. All authors read and approved the final manuscript.
Supporting information
Additional Supporting information may be found in the online version of this article at the publisher's web‐site:
Fig. S1. Increased inducible co‐stimulator (ICOS) expression on brochoalvolar lavage (BAL) forkhead box protein 3 (FoxP3)+CD4+ regulatory T cells (Tregs) compared to BAL FoxP3–CD4+ non‐Tregs in sarcoidosis patients. (a) Representative fluorescence activated cell sorter (FACS) plot gated on BAL CD3+CD4+ T cells showing the expression of ICOS on CD4+ T cells in a sarcoidosis patient and a healthy control [gating according to the respective immunoglobulin (Ig)G isotype controls] (upper panel). Representative FACS plot gated on BAL CD3+CD4+ T cells showing the expression of FoxP3 versus ICOS in a sarcoidosis patient and a healthy control (gating according to the respective IgG isotype controls) (lower panel). Paired comparisons were performed for comparing mean fluorescence intensity (MFI) of ICOS on FoxP3+CD4+ Tregs and FoxP3–CD4+ non‐Treg cells in BAL (b) and blood (c) of sarcoidosis patients and healthy controls. P‐values were calculated using Wilcoxon's matched‐pairs test. The lines indicate T cell subpopulations in BAL and blood derived from the same patient and control. Box‐plots represent MFI of ICOS on FoxP3–CD4+ non‐Treg cells in BAL (d) and blood (e) of sarcoidosis patients and healthy controls. P‐values were calculated using the Mann–Whitney U‐test.
Fig. S2. Inducible co‐stimulator (ICOS) expression does not differ between AV2S3+ effector and total CD4+ T cells in brochoalvolar lavage (BAL) of sarcoidosis patients. (a) Box‐plots represent mean fluorescence intensity (MFI) of ICOS on BAL T cell subsets of sarcoidosis patients and healthy controls. Here, MFI of ICOS was analysed in sarcoid‐specific T cell receptor (TCR) AV2S3+CD4+ T effector cells (n = 7) and total CD4+ T cells in DR3+ sarcoidosis patients (n = 7), as well as total CD4+ T cells in healthy controls (n = 6). P‐values were calculated using the Kruskal–Wallis test after Dunn's post‐test. (b) A paired comparison was performed for comparing MFI of ICOS between AV2S3+ and AV2S3–CD4+ T cells in DR3+ patients. The P‐value was calculated using Wilcoxon's matched‐pairs test. The lines indicate T cell subpopulations derived from BAL of the same patient.
Fig. S3. Increased inducible co‐stimulator ligand (ICOS‐L) expression on peripheral blood monocytes of sarcoidosis patients. (a) Box‐plots represent mean fluorescence intensity (MFI) of ICOS‐L on total monocytes of sarcoidosis patients (n = 11) and healthy controls (n = 13). (b) Box‐plots represent MFI of ICOS‐L on total monocytes of Löfgren's syndrome (LS) (n = 5), non‐Löfgren's syndrome (NLS) (n = 6) patients and healthy controls (n = 13). (c) Box‐plots represent the % CD14++CD16+ monocytes (intermediate) in sarcoidosis patients and healthy controls. (d) Box‐plot represent the intensities of ICOS‐L (as MFI) on intermediate monocytes in patients and controls. P‐values were calculated using the Mann–Whitney U‐test and Kruskal–Wallis test after Dunn's post‐test.
Acknowledgements
This study was funded by the Alexander‐von‐Humboldt Foundation providing a postdoctoral fellowship to P. S., and by the Swedish Heart–Lung Foundation, the Swedish Research Council, the Stockholm County Council, the Mats Kleberg Foundation and by Karolinska Institutet. D. B. received financial support from the President's Initiative and Networking Fund of the Helmholtz Association of German Research Centers (HGF) under contract number W2/W3‐029. The authors thank Margitha Dahl, Gunnel de Forest, Helene Blomqvist and Benita Dahlberg for skillful technical assistance. We also thank all the participants in the study for their kind donation of BAL and blood samples for our research.
References
- 1. Newman LS, Rose CS, Maier LA. Sarcoidosis. N Engl J Med 1997; 336:1224–34. [DOI] [PubMed] [Google Scholar]
- 2. Milman N, Selroos O. Pulmonary sarcoidosis in the Nordic countries 1950–1982. Epidemiology and clinical picture. Sarcoidosis 1990; 7:50–7. [PubMed] [Google Scholar]
- 3. Hunninghake GW, Crystal RG. Pulmonary sarcoidosis: a disorder mediated by excess helper T‐lymphocyte activity at sites of disease activity. N Engl J Med 1981; 305:429–34. [DOI] [PubMed] [Google Scholar]
- 4. Venet A, Hance AJ, Saltini C, Robinson BW, Crystal RG. Enhanced alveolar macrophage‐mediated antigen‐induced T‐lymphocyte proliferation in sarcoidosis. J Clin Invest 1985; 75:293–301. [DOI] [PMC free article] [PubMed] [Google Scholar]
- 5. Robinson BW, McLemore TL, Crystal RG. Gamma interferon is spontaneously released by alveolar macrophages and lung T lymphocytes in patients with pulmonary sarcoidosis. J Clin Invest 1985; 75:1488–95. [DOI] [PMC free article] [PubMed] [Google Scholar]
- 6. Müller‐Quernheim J, Saltini C, Sondermeyer P, Crystal RG. Compartmentalized activation of the interleukin 2 gene by lung T lymphocytes in active pulmonary sarcoidosis. J Immunol 1986; 137:3475–83. [PubMed] [Google Scholar]
- 7. Grunewald J, Berlin M, Olerup O, Eklund A. Lung T‐helper cells expressing T‐cell receptor AV2S3 associate with clinical features of pulmonary sarcoidosis. Am J Respir Crit Care Med 2000; 161:814–8. [DOI] [PubMed] [Google Scholar]
- 8. Wahlström J, Dengjel J, Persson B et al Identification of HLA‐DR‐bound peptides presented by human bronchoalveolar lavage cells in sarcoidosis. J Clin Invest 2007; 117:3576–82. [DOI] [PMC free article] [PubMed] [Google Scholar]
- 9. Idali F, Wahlström J, Müller‐Suur C, Eklund A, Grunewald J. Analysis of regulatory T cell associated forkhead box P3 expression in the lungs of patients with sarcoidosis. Clin Exp Immunol 2008; 152:127–37. [DOI] [PMC free article] [PubMed] [Google Scholar]
- 10. Grunewald J, Eklund A. Role of CD4+ T cells in sarcoidosis. Proc Am Thorac Soc 2007; 4:461–4. [DOI] [PMC free article] [PubMed] [Google Scholar]
- 11. Tang Q, Bluestone JA. The Foxp3+ regulatory T cell: a jack of all trades, master of regulation. Nat Immunol 2008; 9:239–44. [DOI] [PMC free article] [PubMed] [Google Scholar]
- 12. Miyara M, Amoura Z, Parizot C et al The immune paradox of sarcoidosis and regulatory T cells. J Exp Med 2006; 203:359–70. [DOI] [PMC free article] [PubMed] [Google Scholar]
- 13. Hutloff A, Dittrich AM, Beier KC et al ICOS is an inducible T‐cell co‐stimulator structurally and functionally related to CD28. Nature 1999; 397:263–6. [DOI] [PubMed] [Google Scholar]
- 14. Yoshinaga SK, Whoriskey JS, Khare SD et al T‐cell co‐stimulation through B7RP‐1 and ICOS. Nature 1999; 402:827–32. [DOI] [PubMed] [Google Scholar]
- 15. Klingenberg R, Autschbach F, Gleissner C et al Endothelial inducible costimulator ligand expression is increased during human cardiac allograft rejection and regulates endothelial cell‐dependent allo‐activation of CD8+ T cells in vitro . Eur J Immunol 2005; 35:1712–21. [DOI] [PubMed] [Google Scholar]
- 16. Nakazawa A, Dotan I, Brimnes J et al The expression and function of costimulatory molecules B7H and B7‐H1 on colonic epithelial cells. Gastroenterology 2004; 126:1347–57. [DOI] [PubMed] [Google Scholar]
- 17. Dong C, Juedes AE, Temann UA et al ICOS co‐stimulatory receptor is essential for T‐cell activation and function. Nature 2001; 409:97–101. [DOI] [PubMed] [Google Scholar]
- 18. Witsch EJ, Peiser M, Hutloff A et al ICOS and CD28 reversely regulate IL‐10 on re‐activation of human effector T cells with mature dendritic cells. Eur J Immunol 2002; 32:2680–6. [DOI] [PubMed] [Google Scholar]
- 19. Ito T, Hanabuchi S, Wang YH et al Two functional subsets of FOXP3+ regulatory T cells in human thymus and periphery. Immunity 2008; 28:870–80. [DOI] [PMC free article] [PubMed] [Google Scholar]
- 20. Honkanen J, Skarsvik S, Knip M, Vaarala O. Poor in vitro induction of FOXP3 and ICOS in type 1 cytokine environment activated T‐cells from children with type 1 diabetes. Diabetes Metab Res Rev 2008; 24:635–41. [DOI] [PubMed] [Google Scholar]
- 21. Nagamatsu T, Barrier BF, Schust DJ. The regulation of T‐cell cytokine production by ICOS‐B7H2 interactions at the human fetomaternal interface. Immunol Cell Biol 2011; 89:417–25. [DOI] [PubMed] [Google Scholar]
- 22. Tuettenberg A, Huter E, Hubo M et al The role of ICOS in directing T cell responses: ICOS‐dependent induction of T cell anergy by tolerogenic dendritic cells. J Immunol 2009; 182:3349–56. [DOI] [PubMed] [Google Scholar]
- 23. Ghourbani Gazar S, Andalib A, Hashemi M, Rezaei A. CD4+Foxp3+ Treg and its ICOS+ subsets in patients with myocardial infarction. Iran J Immunol 2012; 9:53–60. [PubMed] [Google Scholar]
- 24. Faget J, Sisirak V, Blay JY, Caux C, Bendriss‐Vermare N, Ménétrier‐Caux C. ICOS is associated with poor prognosis in breast cancer as it promotes the amplification of immunosuppressive CD4+ T cells by plasmacytoid dendritic cells. Oncoimmunology 2013; 2:e23185. [DOI] [PMC free article] [PubMed] [Google Scholar]
- 25. Faget J, Bendriss‐Vermare N, Gobert M et al ICOS‐ligand expression on plasmacytoid dendritic cells supports breast cancer progression by promoting the accumulation of immunosuppressive CD4+ T cells. Cancer Res 2012; 72:6130–41. [DOI] [PubMed] [Google Scholar]
- 26. Ito T, Yang M, Wang YH et al Plasmacytoid dendritic cells prime IL‐10‐producing T regulatory cells by inducible costimulator ligand. J Exp Med 2007; 204:105–15. [DOI] [PMC free article] [PubMed] [Google Scholar]
- 27. Ogata M, Ito T, Shimamoto K et al Plasmacytoid dendritic cells have a cytokine‐producing capacity to enhance ICOS ligand‐mediated IL‐10 production during T‐cell priming. Int Immunol 2013; 25:171–82. [DOI] [PubMed] [Google Scholar]
- 28. Conrad C, Gregorio J, Wang YH et al Plasmacytoid dendritic cells promote immunosuppression in ovarian cancer via ICOS costimulation of Foxp3(+) T‐regulatory cells. Cancer Res 2012; 72:5240–9. [DOI] [PMC free article] [PubMed] [Google Scholar]
- 29. American Thoracic Society. Medical Section of the American Lung Association, Statement on sarcoidosis. Joint Statement of the American Thoracic Society (ATS), the European Respiratory Society (ERS) and the World Association of Sarcoidosis and Other Granulomatous Disorders (WASOG) adopted by the ATS Board of Directors and by the ERS Executive Committee, February 1999. Am J Respir Crit Care Med 1999; 160:736–55. [DOI] [PubMed] [Google Scholar]
- 30. Eklund A, Blaschke E. Relationship between changed alveolar‐capillary permeability and angiotensin converting enzyme activity in serum in sarcoidosis. Thorax 1986; 41:629–34. [DOI] [PMC free article] [PubMed] [Google Scholar]
- 31. Olerup O, Zetterquist H. HLA‐DR typing by PCR amplification with sequence‐specific primers (PCR‐SSP) in 2 hours: an alternative to serological DR typing in clinical practice including donor‐recipient matching in cadaveric transplantation. Tissue Antigens 1992; 39:225–35. [DOI] [PubMed] [Google Scholar]
- 32. Kawanaka N, Yamamura M, Aita T et al CD14+CD16+ blood monocytes and joint inflammation in rheumatoid arthritis. Arthritis Rheum 2002; 46:2578–86. [DOI] [PubMed] [Google Scholar]
- 33. Merino A, Buendia P, Martin‐Malo A, Aljama P, Ramirez R, Carracedo J. Senescent CD14+CD16+ monocytes exhibit proinflammatory and proatherosclerotic activity. J Immunol 2011; 186:1809–15. [DOI] [PubMed] [Google Scholar]
- 34. Usui Y, Takeuchi M, Yamakawa N et al Expression and function of inducible costimulator on peripheral blood CD4+ T cells in Behçet's patients with uveitis: a new activity marker? Invest Ophthalmol Vis Sci 2010; 51:5099–104. [DOI] [PubMed] [Google Scholar]
- 35. Yang JH, Zhang J, Cai Q et al Expression and function of inducible costimulator on peripheral blood T cells in patients with systemic lupus erythematosus. Rheumatology (Oxf) 2005; 44:1245–54. [DOI] [PubMed] [Google Scholar]
- 36. Sato T, Kanai T, Watanabe M et al Hyperexpression of inducible costimulator and its contribution on lamina propria T cells in inflammatory bowel disease. Gastroenterology 2004; 126:829–39. [DOI] [PubMed] [Google Scholar]
- 37. Sim GC, Martin‐Orozco N, Jin L et al IL‐2 therapy promotes suppressive ICOS+ Treg expansion in melanoma patients. J Clin Invest 2014; 124:99–110. [DOI] [PMC free article] [PubMed] [Google Scholar]
- 38. Vocanson M, Rozieres A, Hennino A et al Inducible costimulator (ICOS) is a marker for highly suppressive antigen‐specific T cells sharing features of TH17/TH1 and regulatory T cells. J Allergy Clin Immunol 2010; 126:280–9. [DOI] [PubMed] [Google Scholar]
- 39. Idali F, Wikén M, Wahlström J et al Reduced Th1 response in the lungs of HLA‐DRB1*0301 patients with pulmonary sarcoidosis. Eur Respir J 2006; 27:451–9. [DOI] [PubMed] [Google Scholar]
- 40. Imanguli MM, Cowen EW, Rose J et al Comparative analysis of FoxP3(+) regulatory T cells in the target tissues and blood in chronic graft versus host disease. Leukemia 2014; 28:2016–27. [DOI] [PMC free article] [PubMed] [Google Scholar]
- 41. Oswald‐Richter KA, Richmond BW, Braun NA et al Reversal of global CD4+ subset dysfunction is associated with spontaneous clinical resolution of pulmonary sarcoidosis. J Immunol 2013; 190:5446–53. [DOI] [PMC free article] [PubMed] [Google Scholar]
- 42. Wikén M, Grunewald J, Eklund A, Wahlström J. Multiparameter phenotyping of T‐cell subsets in distinct subgroups of patients with pulmonary sarcoidosis. J Intern Med 2012; 271:90–103. [DOI] [PubMed] [Google Scholar]
- 43. Strauss L, Bergmann C, Szczepanski MJ, Lang S, Kirkwood JM, Whiteside TL. Expression of ICOS on human melanoma‐infiltrating CD4+CD25highFoxp3+ T regulatory cells: implications and impact on tumor‐mediated immune suppression. J Immunol 2008; 180:2967–80. [DOI] [PubMed] [Google Scholar]
- 44. Katchar K, Wahlström J, Eklund A, Grunewald J. Highly activated T‐cell receptor AV2S3(+) CD4(+) lung T‐cell expansions in pulmonary sarcoidosis. Am J Respir Crit Care Med 2001; 163:1540–5. [DOI] [PubMed] [Google Scholar]
- 45. Wikén M, Ostadkarampour M, Eklund A et al Antigen‐specific multifunctional T‐cells in sarcoidosis patients with Lofgren's syndrome. Eur Respir J 2012; 40:110–21. [DOI] [PubMed] [Google Scholar]
- 46. Okamoto H, Mizuno K, Horio T. Circulating CD14+ CD16+ monocytes are expanded in sarcoidosis patients. J Dermatol 2003; 30:503–9. [DOI] [PubMed] [Google Scholar]
- 47. Zawada AM, Rogacev KS, Rotter B et al SuperSAGE evidence for CD14++CD16+ monocytes as a third monocyte subset. Blood 2011; 118:e50–61. [DOI] [PubMed] [Google Scholar]
- 48. Katayama K, Matsubara T, Fujiwara M, Koga M, Furukawa S. CD14+CD16+ monocyte subpopulation in Kawasaki disease. Clin Exp Immunol 2000; 121:566–70. [DOI] [PMC free article] [PubMed] [Google Scholar]
- 49. Poitou C, Dalmas E, Renovato M et al CD14dimCD16+ and CD14+CD16+ monocytes in obesity and during weight loss: relationships with fat mass and subclinical atherosclerosis. Arterioscler Thromb Vasc Biol 2011; 31:2322–30. [DOI] [PubMed] [Google Scholar]
- 50. Vanham G, Edmonds K, Qing L et al Generalized immune activation in pulmonary tuberculosis: co‐activation with HIV infection. Clin Exp Immunol 1996; 103:30–4. [DOI] [PMC free article] [PubMed] [Google Scholar]
- 51. Aicher A, Hayden‐Ledbetter M, Brady WA et al Characterization of human inducible costimulator ligand expression and function. J Immunol 2000; 164:4689–96. [DOI] [PubMed] [Google Scholar]
- 52. Richter G, Hayden‐Ledbetter M, Irgang M et al Tumor necrosis factor‐alpha regulates the expression of inducible costimulator receptor ligand on CD34(+) progenitor cells during differentiation into antigen presenting cells. J Biol Chem 2001; 276:45686–93. [DOI] [PubMed] [Google Scholar]
- 53. Fehrenbach H, Zissel G, Goldmann T et al Alveolar macrophages are the main source for tumour necrosis factor‐alpha in patients with sarcoidosis. Eur Respir J 2003; 21:421–8. [DOI] [PubMed] [Google Scholar]
- 54. Ferrer DG, Jaldín‐Fincati JR, Amigone JL et al Standardized flow cytometry assay for identification of human monocytic heterogeneity and LRP1 expression in monocyte subpopulations: decreased expression of this receptor in nonclassical monocytes. Cytometry A 2014; 85:601–10. [DOI] [PubMed] [Google Scholar]
- 55. Sakaguchi S, Miyara M, Costantino CM, Hafler DA. FOXP3+ regulatory T cells in the human immune system. Nat Rev Immunol 2010; 10:490–500. [DOI] [PubMed] [Google Scholar]
- 56. Sakthivel P, Gereke M, Breithaupt A et al Attenuation of immune‐mediated influenza pneumonia by targeting the inducible co‐stimulator (ICOS) molecule on T cells. PLOS ONE 2014; 9:e100970 40] [DOI] [PMC free article] [PubMed] [Google Scholar]
Associated Data
This section collects any data citations, data availability statements, or supplementary materials included in this article.
Supplementary Materials
Additional Supporting information may be found in the online version of this article at the publisher's web‐site:
Fig. S1. Increased inducible co‐stimulator (ICOS) expression on brochoalvolar lavage (BAL) forkhead box protein 3 (FoxP3)+CD4+ regulatory T cells (Tregs) compared to BAL FoxP3–CD4+ non‐Tregs in sarcoidosis patients. (a) Representative fluorescence activated cell sorter (FACS) plot gated on BAL CD3+CD4+ T cells showing the expression of ICOS on CD4+ T cells in a sarcoidosis patient and a healthy control [gating according to the respective immunoglobulin (Ig)G isotype controls] (upper panel). Representative FACS plot gated on BAL CD3+CD4+ T cells showing the expression of FoxP3 versus ICOS in a sarcoidosis patient and a healthy control (gating according to the respective IgG isotype controls) (lower panel). Paired comparisons were performed for comparing mean fluorescence intensity (MFI) of ICOS on FoxP3+CD4+ Tregs and FoxP3–CD4+ non‐Treg cells in BAL (b) and blood (c) of sarcoidosis patients and healthy controls. P‐values were calculated using Wilcoxon's matched‐pairs test. The lines indicate T cell subpopulations in BAL and blood derived from the same patient and control. Box‐plots represent MFI of ICOS on FoxP3–CD4+ non‐Treg cells in BAL (d) and blood (e) of sarcoidosis patients and healthy controls. P‐values were calculated using the Mann–Whitney U‐test.
Fig. S2. Inducible co‐stimulator (ICOS) expression does not differ between AV2S3+ effector and total CD4+ T cells in brochoalvolar lavage (BAL) of sarcoidosis patients. (a) Box‐plots represent mean fluorescence intensity (MFI) of ICOS on BAL T cell subsets of sarcoidosis patients and healthy controls. Here, MFI of ICOS was analysed in sarcoid‐specific T cell receptor (TCR) AV2S3+CD4+ T effector cells (n = 7) and total CD4+ T cells in DR3+ sarcoidosis patients (n = 7), as well as total CD4+ T cells in healthy controls (n = 6). P‐values were calculated using the Kruskal–Wallis test after Dunn's post‐test. (b) A paired comparison was performed for comparing MFI of ICOS between AV2S3+ and AV2S3–CD4+ T cells in DR3+ patients. The P‐value was calculated using Wilcoxon's matched‐pairs test. The lines indicate T cell subpopulations derived from BAL of the same patient.
Fig. S3. Increased inducible co‐stimulator ligand (ICOS‐L) expression on peripheral blood monocytes of sarcoidosis patients. (a) Box‐plots represent mean fluorescence intensity (MFI) of ICOS‐L on total monocytes of sarcoidosis patients (n = 11) and healthy controls (n = 13). (b) Box‐plots represent MFI of ICOS‐L on total monocytes of Löfgren's syndrome (LS) (n = 5), non‐Löfgren's syndrome (NLS) (n = 6) patients and healthy controls (n = 13). (c) Box‐plots represent the % CD14++CD16+ monocytes (intermediate) in sarcoidosis patients and healthy controls. (d) Box‐plot represent the intensities of ICOS‐L (as MFI) on intermediate monocytes in patients and controls. P‐values were calculated using the Mann–Whitney U‐test and Kruskal–Wallis test after Dunn's post‐test.