

Summary
Neurocysticercosis is caused by the establishment of Taenia solium cysticerci in the central nervous system. It is considered that, during co‐evolution, the parasite developed strategies to modulate the host's immune response. The action mechanisms of regulatory T cells in controlling the immune response in neurocysticercosis are studied in this work. Higher blood levels of regulatory T cells with CD4+CD45RO+forkhead box protein 3 (FoxP3)high and CD4+CD25highFoxP3+CD95high phenotype and of non‐regulatory CD4+CD45RO+FoxP3med T cells were found in neurocysticercosis patients with respect to controls. Interestingly, regulatory T cells express higher levels of cytotoxic T lymphocyte antigen 4 (CTLA‐4), lymphocyte‐activation gene 3 (LAG‐3), programmed death 1 (PD‐1) and glucocorticoid‐induced tumour necrosis factor receptor (GITR), suggesting a cell‐to‐cell contact mechanism with dendritic cells. Furthermore, higher IL‐10 and regulatory T cell type 1 (Tr1) levels were found in neurocysticercosis patients’ peripheral blood, suggesting that the action mechanism of regulatory T cells involves the release of immunomodulatory cytokines. No evidence was found of the regulatory T cell role in inhibiting the proliferative response. Suppressive regulatory T cells from neurocysticercosis patients correlated negatively with late activated lymphocytes (CD4+CD38+). Our results suggest that, during neurocysticercosis, regulatory T cells could control the immune response, probably by a cell‐to‐cell contact with dendritic cells and interleukin (IL)‐10 release by Tr1, to create an immunomodulatory environment that may favour the development of T. solium cysticerci and their permanence in the central nervous system.
Keywords: cysticerci, dendritic cells, neurocysticercosis, regulatory T cells, Taenia solium
Introduction
Neurocysticercosis (NC) is an endemic disease in most countries of Latin America, Asia and Africa. NC is caused by the larval stage of Taenia solium (cysticercus), which establishes in the central nervous system (CNS) after reaching it in the form of a hexacanth embryo (oncosphere). The incidence of NC has increased progressively in developed countries of North America and Europe due to immigration 1, 2.
NC affects immunocompetent hosts, and it is noteworthy that the parasite is able to establish and develop in different areas of the CNS, circumventing the host immune response. Cellular immunity is suppressed in the most severe forms of the disease 3, 4. This suppression can be attributed to the action of peripheral and central regulatory T cells (Tregs), which were found increased in these severe NC patients. Indeed, T. solium cysticerci have been reported as able to promote Treg generation both in vivo and in vitro 5, 6. It is feasible that the parasite could drive the immunity elicited by the host to promote a favourable environment for its own survival 6. This strategy has been demonstrated in other parasitic diseases, such as cerebral malaria and cutaneous leishmaniasis 7, 8.
It is well known that Tregs can modulate the specific immunity through different suppressive mechanisms 9. Tregs may produce interleukin (IL)‐10, IL‐35 and transforming growth factor (TGF)‐β, which can act together to inhibit the production of proinflammatory cytokines and the proliferative immune response 10, 11, 12. Moreover, IL‐35 and TGF‐β may also promote de‐novo generation of Tregs 13, 14. Another known mechanism for Treg action involves higher expression levels of the IL‐2 receptor α chain (CD25), resulting in a deprivation of IL‐2 for effector T cells and the inhibition of T cell proliferation. In recent years, further modulatory functions of Tregs have been reported. Tregs express the ectoenzymes CD39 and CD73, which produce adenosine; in turn, this nucleoside suppresses the function of effector T cells by activating the adenosine receptor 2A (A2AR) 9. Tregs also express cytotoxic T lymphocyte antigen 4 (CTLA‐4) (CD152) and lymphocyte‐activation gene 3 (LAG‐3) (CD223), which can interact with CD80/CD86 and major histocompatibility complex II (MHC‐II) (CD74) 9, 15 suppressing the activation and maturation of dendritic cells (DC) and inducing a tolerogenic phenotype 9, 16, 17 which, in turn, induces de‐novo Treg generation 18. Tregs also express programmed death 1 (PD‐1) (CD279), which can prevent CD28‐mediated activation and down‐regulate the expression of proinflammatory cytokines 19, 20. Glucocorticoid‐induced tumour necrosis factor receptor (TNFR) family‐related gene (GITR) (CD357) is another molecule expressed by Tregs that may inhibit T cell activation 21.
This study is aimed to explore the mechanisms that mediate the function of Tregs during NC. This information will improve our understanding of the host–parasite relationship and the factors that participate in the control of the immune response during this parasitic disease.
Materials and methods
NC patients and control subjects
A total of 20 NC patients (13 male, mean age 54·15 ± 9·97 years and seven female, mean age 36·29 ± 4·54 years) who attended at Instituto Nacional de Neurología y Neurocirugía and Centro Médico Nacional Siglo XXI in Mexico City were included into the study. Diagnosis was based on clinical manifestations (seizures, focal deficit and intracranial hypertension) and on neuroradiological studies (showing viable cysticerci). Blood samples from NC patients were collected before any cysticidal treatment was administered. Cerebrospinal fluid (CSF) samples were obtained by lumbar puncture from 11 patients. Blood samples from 16 healthy volunteers (six male, mean age 36·33 ± 11·33 and 10 female, mean age 42·60 ± 10·67) were also included as controls.
A number of central (CSF) and peripheral (blood) immunological parameters were evaluated.
Nineteen NC patients showed multiple vesicular cysticerci, while one patient had only a single parasite. Eighteen patients exhibited extraparenchymal cysts, 16 in the subarachnoid space of the base and two in the ventricles. Two patients showed parenchymal cysticerci.
Ethical considerations
The present study fulfilled all regulations for research with human subjects as required by Mexican law and international regulations. It also complied with all ethical aspects considered in the General Rules of Health for Clinical Investigation. Ethics Committee at Instituto Nacional de Neurología y Neurocirugía, México, approved the protocol. Written informed consent was obtained from all participants. Patients were informed that the samples obtained would be used for this work.
Cell phenotype
The phenotype of cell populations in peripheral blood mononuclear cells (PBMCs) and CSF was determined. The following antibodies were used to characterize the phenotype of regulatory T cells: mouse anti‐human CD4 allophycocyanin (APC) cyanin 7 (Cy7) [isotype immunoglobulin (Ig)G1k], mouse anti‐human CD25 APC (isotype IgG1k), rat anti‐human forkhead box protein 3 (FoxP3) phycoerythrin (PE) (isotype IgG2ak), mouse anti‐human CD45RO peridinin chlorophyll (PerCP) Cy5·5 (isotype IgG2aK) and mouse anti‐human CD127 fluorescein isothiocyanate (FITC) (isotype IgG1K). To measure the expression of molecules participating in the mechanism associated with cell–cell contact, the following antibodies were used in PBMCs: mouse anti‐human CD4 APC Cy7 (isotype IgG1k), mouse anti‐human CD25 APC (isotype IgG1k), mouse anti‐human CTLA‐4 (CD152) PE (isotype IgG2ak) and mouse anti‐human LAG‐3 (CD223) PerCP Cy5·5 (goat isotype IgG).
The presence of PD‐1 (CD279) was assessed using the mouse anti‐human PD‐1 PerCP Cy5 (isotype IgG1K) antibody on CD4+CD25high peripheral Tregs. The presence of other regulatory molecules on CD4+CD25high Tregs was assessed using the mouse anti‐human GITR FITC (isotype IgG1K) or mouse anti‐human CD95 FITC (isotype IgG1K) antibodies. The PBMC regulatory T cell type 1 (Tr1) phenotype was assessed by using the mouse anti‐human CD4 APC Cy7 (isotype IgG1k), mouse anti‐human CD25 APC (isotype IgG1k) and rat anti‐human IL‐10 PE (isotype IgG1k) antibodies. Anti‐human FoxP3, anti‐human CTLA‐4 and anti‐human IL‐10 antibodies were used for intracellular staining with the eBioscience kit (eBioscience, Santa Clara, CA, USA). For intracellular staining with anti‐human IL‐10 antibodies, cells were pretreated with 2 µl brefeldin A (5 mg/ml) for 4 h at 37°C/5% CO2.
The dendritic cells (DCs) phenotype from PBMCs was characterized using the following antibodies: mouse anti‐human CD11c PerCp‐eFluor 710 (isotype IgG1k), mouse anti‐human human leucocyte antigen D‐related (HLA‐DR) (CD74) FITC (isotype IgG2ak), mouse anti‐human CD86 APC (isotype IgG1k) and mouse anti‐human CD40 PE (isotype IgG1k). The phenotype of tolerogenic DCs from PBMCs was determined by using the following antibodies: mouse anti‐human CD11c PerCp‐eFluor 710 (isotype IgG1k), mouse anti‐human signalling lymphocytic activation molecule 1 (SLAMF1) (CD150), PE (isotype IgG1k), mouse anti‐human CD205 FITC (isotype IgG2bk) and mouse anti‐human ILT3 (CD85K) APC (isotype IgG1k).
To assess lymphocyte activation, PBMCs were stained by using the following antibodies: mouse anti‐human CD3 FITC (isotype IgG1k), mouse anti‐human CD4 PerCP Cy5·5 (isotype IgG1k), mouse anti‐human CD69 PE (isotype IgG1k) and mouse anti‐human CD38 PE (isotype IgG1k).
Most antibodies and reagents used for cell staining were purchased from Affymetrix/ eBioscience. All antibodies were titrated for optimal detection of positive populations prior to use, following the manufacturer's recommended concentrations.
Measurements for cytometry analysis of Tregs included: (1) classic phenotype (CD4+CD25highFoxP3+) 22; (2) suppressive phenotype (CD4+CD25highFoxP3+CD127low): in this context, a low or negative expression of CD127 was associated with suppressive Tregs according to previous reports 23; (3) activated phenotype (CD4+CD45RO+FoxP3high); (4) resting phenotype (CD4+CD45RO‐FoxP3low); and (5) non‐Treg phenotype (CD4+CD45RO+FoxP3medium) 24, 25. For cytometry analysis of the classic Treg phenotype, cells were gated according to CD4 expression and forward‐scatter properties. Gated cells were then analysed for double CD25high and FoxP3+ expression.
To analyse the Treg suppressive phenotype, total lymphocytes were first gated according to forward‐/side‐scatter properties; CD4+ and CD25high‐positive cells were selected from these gated cells. A third gate was established according to FoxP3 and CD127 expression. All events read as FoxP3+/CD127low were considered to be suppressive Tregs. For other Treg phenotypes, CD4+ lymphocytes were gated according CD45RO and FoxP3 expression. CD45RO+/FoxP3high cells were regarded as active Tregs; CD45RO+/FoxP3medium cells were considered as non‐Tregs and cells CD45RO‐/FoxP3low were regarded as resting Tregs.
Treg cells were also characterized from CD4+ gated cells according to the double expression of CD25high, along with one of the following: CTLA‐4, LAG‐3, PD‐1, IL‐10, GITR or CD95.
To analyse the phenotype of DCs, cells were first gated according to forward‐/side‐scatter properties. Gated cells were then analysed for double expression of CD11c and one of the following: HLA‐DR, CD86 or CD40 for active DCs, and SLAMF1, CD205 or immunologlobulin‐like transcript 3 (ILT3) for tolerogenic DCs.
For the analysis of CD4 activated populations, cells were gated according to CD3 expression and forward‐scatter properties. Total CD3+ cells were analysed for double expression of CD4 and CD69 or CD4 and CD38.
Most antibodies and reagents used for cell staining were purchased from Affymetrix/ eBioscience.
Fluorescence activated cell sorter (FACS)Calibur and FACSAria cytometers were used for data acquisition. The Cytometer Cell Quest software (Becton Dickinson, Franklin Lakes, NJ, USA) was used for data analysis.
Cytokines
IL‐2, IL‐4, IL‐6, IL‐10, IL‐35 and TGF‐β levels in plasma and CSF were measured with commercial sandwich enzyme‐linked immunosorbent assay (ELISA) kits. TGF‐β was measured with the human/mouse TGF‐β1 ELISA Ready‐Set‐Go kit, which includes a heat‐and acid‐treatment to measure all TGF‐β1 isoforms. Detection limits were: 2 pg/ml for IL‐12, IL‐4, IL‐6, IL‐10 and IL‐35; 4 pg/ml for IL‐5; and 60 pg/ml for TGF‐β. All analyses were run in duplicate.
Most ELISA kits were purchased from Affymetrix/eBioscience. Human IL‐35 kit was purchased from Biolegend (San Diego, CA, USA).
Lymphocyte proliferation
PBMCs were recovered from 10 ml of venous blood from 20 patients and 16 controls by Ficoll‐Paque (Amersham Life Sciences, Little Chalfont, UK). PBMCs, 10 × 106 cell/ml, were labelled with carboxyfluorescein diacetate succinimidyl ester (CFSE) 5 μM in phosphate‐buffered saline (PBS) supplemented with 10% fetal bovine serum and incubated for 5 min at 37ºC. Cells were washed three times with cool RPMI‐1640 (Gibco BRL, Grand Island, NY, USA), 10% fetal calf serum (FCS) (Gibco BRL). After washing, 1 × 10⁵ cells were incubated with 200 μl of RPMI‐1640 plus 1% antibiotic (penicillin and streptomycin) (Gibco BRL) supplemented with 10% human AB type serum and 50 μM of 2‐mercaptoethanol (Sigma, St Louis, MO, USA). Cells were stimulated with either phytohaemagglutinin A (PHA) 1 : 50 (Gibco BRL), total extract of T. solium cysticercal soluble antigens (20 μg/well) or antigens from vesicular fluid (20 μg/well). After 4 days of culture, cells were harvested and the total proliferative response was analysed with CFSE marker. For analysing proliferative Tregs, lymphocyte cells were gated according to forward‐/side‐scatter properties. Proliferative cells were gated according to CFSE and CD4 markers. A new gate was set in the proliferative zone of CD4+ according to the CD25 and FoxP3 markers. Tregs were considered as CD4+CD25highFoxP3+. Data were acquired using a FACScalibur cytometer and analysed with the Cytometer Cell Quest software (Becton Dickinson).
Cysticercal antigens
Briefly, T. solium cysticerci were obtained from muscles of naturally infected pigs and cultivated for 3 days in RPMI‐1640 plus 1% antibiotic (penicillin and streptomycin) and 10% FCS (both purchased from Gibco BRL) for 3 days before use, to eliminate host molecules. At this time of culture, no anti‐cysticerci immunoglobulins were detected by ELISA (data not shown) in cysticercal extracts, an indication that harvested cystecerci were mostly free of the host's immunological molecules. After culture, cysticerci were frozen, macerated and centrifuged for 30 min at 3500 g. The supernatant containing soluble proteins was collected as total extract. The vesicular fluid was collected by puncturing each cysticercus.
Statistical analysis
Data were processed in spss version 21 (IBM Corporation). Variables are reported as mean ± standard deviation (s.d.). Differences between groups were calculated with Student's t‐test or Mann–Whitney U‐test, as appropriate. A P‐value less than 0·05 was regarded as significant.
Results
Blood levels of regulatory T cells are increased in NC patients
The percentage of CD4+ cells in peripheral blood did not differ significantly between healthy controls and NC patients. As shown in Table 1, significant differences between patients and controls were found in the analysed Treg phenotypes. Higher levels of activated Tregs CD4+CD45RO+FoxP3high (P = 0.001) and CD4+CD25highFoxP3+CD95high (P = 0·002) and non‐Treg cells CD4+CD45RO+FoxP3med (P = 0.001) were found in the peripheral blood of NC patients with respect to healthy controls. No differences were observed in the levels of resting Treg CD4+CD45RO‐FoxP3low phenotype, either in suppressive Treg CD4+CD25highFoxP3+CD127low or in the classical Treg CD4+CD25high FoxP3+ phenotypes.
Table 1.
Levels of regulatory T cell phenotypes in neurocysticercosis (NC) patients and controls.
| Phenotype | NC patients (%) | Controls (%) | P |
|---|---|---|---|
| CD4+CD25highFoxP3+ | 4·80 ± 2·83 | 3·01 ± 2·68 | 0·064 |
| CD4+CD45RO+FoxP3high | 2·19 ± 0·96 | 0·98 ± 0·87 | 0·001* |
| CD4+CD45RO+FoxP3med | 8·83 ± 2·75 | 5·24 ± 2·50 | 0·001* |
| CD4+CD45RO–FoxP3low | 4·34 ± 1·62 | 3·56 ± 2·45 | 0·308 |
| CD4+CD25highFoxP3+CD127low | 15·37 ± 14·68 | 17·96 ± 14·9 | 0·606 |
| CD4+CD25highFoxP3+CD95high | 1·58 ± 1·19 | 0·40 ± 0·47 | 0·002* |
| CD4+ | 35·98 ± 16·58 | 36·14 ± 11·17 | 0·974 |
Significantly different between NC patients and controls with 95% confidence. FoxP3 = forkhead box protein 3.
Tregs are found in the cerebrospinal fluid of NC patients
Cells were found in the CFS of 11 patients in concentrations ranging from 6·8 × 104 to 2·78 × 106 cells/ml. Different Treg phenotypes were detected: classical CD4+CD25high FoxP3+ (7·39 ± 4·94 cells/ml); activated CD4+CD45RO+FoxP3high (5·10 ± 6·28 cells/ml); suppressive CD4+CD25highFoxP3+CD127low (35·10 ± 36·50 cells/ml); resting CD4+CD45RO‐FoxP3low (1·76 ± 0·59 cells/ml) and non‐Treg CD4+CD45RO‐FoxP3med (13·81 ± 1·762 cells/ml). A k‐related test was performed comparing the level of the aforementioned cell populations (P = 0·038). Positive correlations were found between the central and peripheral levels of suppressive Tregs (r = 0·982, P < 0·001) and between the central levels of activated Tregs with the peripheral levels of suppressive Tregs (r = 0·982, P = 0·003).
Tregs express molecules known to be involved in cell‐to‐cell contact with DCs
As shown in Fig. 1, NC patients express higher levels of CTLA‐4, LAG‐3, GITR and PD‐1 in Tregs than healthy controls (P < 0·05). A positive correlation was found between CTLA‐4+ Tregs and LAG‐3+ Tregs (r = 0·892, P < 0·001).
Figure 1.
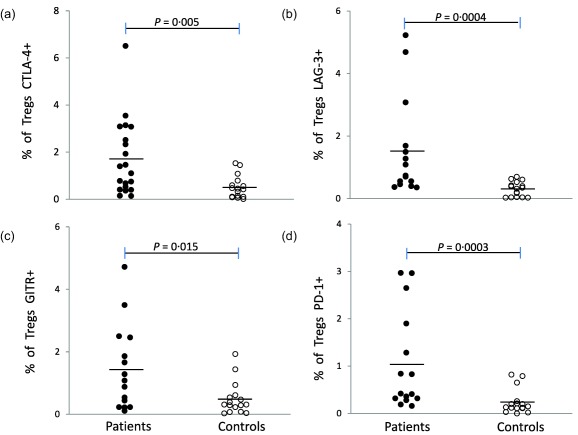
Regulatory T cell (Treg) expression levels of cytotoxic T lymphocyte antigen 4 (CTLA‐4), lymphocyte‐activation gene 3 (LAG‐3), glucocorticoid‐induced tumour necrosis factor receptor (GITR) and programmed cell death 1 (PD‐1) in neurocysticercosis (NC) patients and controls. Individual data are shown for Tregs: (a) CTLA‐4+, (b) LAG‐3+, (c) GITR+ and (d) PD‐1+. Total CD4+ cells were gated according to the double expression of CD25high and CTLA‐4, LAG‐3, PD‐1 or GITR. *Significantly different between NC patients and controls with 95% confidence.
As DCs present the ligands for the suppressive molecules CTLA‐4, LAG‐3, GITR and PD‐1, their phenotype was studied. As shown in Table 2, increased levels of HLA‐DR and the suppressive molecules SLAMF1 and CD205 were found in NC patients with respect to controls.
Table 2.
Levels of regulatory and activating molecules on dendritic cells in neurocysticercosis (NC) patients and controls.
| Phenotype | NC patients (%) | Controls (%) | P |
|---|---|---|---|
| SLAMF1+CD11c+ | 7·77 ± 5·71 | 3·43 ± 1·25 | 0·015* |
| CD205+CD11c+ | 22·63 ± 15·83 | 10·25 ± 9·68 | 0·029* |
| ILT3+CD11c+ | 38·45 ± 27·87 | 35·08 ± 20·28 | 0·715 |
| HLA‐DR+CD11c+ | 71·16 ± 19·80 | 57·18 ± 16·51 | 0·048* |
| CD86+CD11c+ | 43·86 ± 24·83 | 39·16 ± 19·39 | 0·573 |
| CD40+CD11c+ | 9·07 ± 8·41 | 6·52 ± 8·38 | 0·430 |
Significantly different between NC patients and controls with 95% confidence. HLA‐DR = human leucocyte antigen D‐related; SLAMF1 = signalling lymphocytic activation molecule 1; ILT3 = immunologlobulin‐like transcript 3.
Levels of regulatory cytokines in NC patients
The three main regulatory cytokines were found in CSF in widely varying concentrations among patients. IL‐10 ranged from 23·64 to 319·14 pg/ml, TGF‐β from 245·24 to 7305·65 pg/ml and IL‐35 from 1·10 to 26·80 pg/ml. Central TGF‐β levels correlated positively with the percentage of central activated Tregs (r = 0·989, P = 0·011) and central suppressive Tregs (r = 0·976, P = 0·004).
Additionally, linear regression analyses showed that both CSF TGF‐β and IL‐35 levels are related to peripheral activated Treg phenotype (P = 0·048 and P = 0·011, respectively).
In the periphery, only IL‐10 levels were found increased (P = 0·003) (Fig. 2). Interestingly, Tr1 cells (CD4+CD25highIL‐10+), the main producers of IL‐10, were also found increased in NC patients (P = 0·028) with respect to controls (1·04 ± 1·32 and 0·26 ± 0·33, respectively). A positive correlation was found between Tr1 and CTLA‐4+ Tregs (r = 0·868, P < 0·001), as well as LAG‐3+ Tregs (r = 0·705, P = 0·003) and PD‐1+ Tregs (r = 0·528, P = 0·043).
Figure 2.
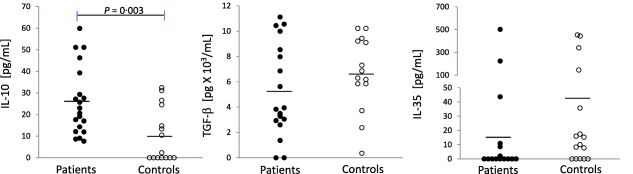
Peripheral levels of regulatory cytokines. Plasma was tested by enzyme‐linked immunosorbent assay (ELISA) for interleukin (IL)‐10, transforming growth factor (TGF)‐β and IL‐35 in patients and controls. *Significantly different between neurocysticercosis (NC) patients and controls. P < 0·005.
Peripheral IL‐35 level correlated positively with the three central phenotypes of Tregs: suppressive (r = 0·969, P = 0·001), classic (r = 0·914, P =0·002) and activated (r = 0·989, P = 0·001).
Treg levels are not increased in in‐vitro proliferating lymphocytes
Both specific and non‐specific proliferative immune responses were evaluated (Table 3). The specific proliferative response induced by total and vesicular cysticercal extracts was increased significantly in NC patients compared to controls (P < 0·05). The non‐specific proliferative response to PHA was similar in both groups. The percentage of Tregs was not modified in the proliferating cells, disregarding the proliferation observed.
Table 3.
Proliferative levels of PBMCs after specific and non‐specific stimulus.
| Total proliferation (%) | Treg proliferation (%) | |||||
|---|---|---|---|---|---|---|
| Stimulus | Patients | Controls | P | Patients | Controls | P |
| PHA | 47·95 ± 32·42 | 44·41 ± 20·71 | 0·710 | 6·45 ± 16·07 | 14·62 ± 16·44 | 0·218 |
| Cysticercal vesicular extract | 24·10 ± 31·28 | 4·79 ± 5·96 | 0·024* | 0·11 ± 0·17 | 0·34 ± 0·76 | 0·336 |
| Cysticercal total extract | 22·98 ± 30·53 | 5·49 ± 3·80 | 0·046* | 0·36 ± 0·55 | 1·05 ± 1·74 | 0·236 |
Significantly different between neurocysticercosis (NC) patients and controls with 95% confidence. PHA = phytohaemagglutinin; Treg = regulatory T cell.
Effector immune response during NC
To explore the effector immune response exerted by CD4 T cells, the levels of early (CD69) and late (CD38) activation in CD4 cells were determined. Both CD4+CD69+ and CD4+CD38+ levels were similar in patients and controls (4·39 ± 3·84 versus 5·83 ± 10·51, respectively, for CD4+CD69+ and 17·89 ± 13·20 versus 17·96 ± 11·13, respectively, for CD4+CD38+). A statistically significant negative correlation between peripheral suppressive Tregs and CD4+CD38+ cells was found in NC patients (r = −0·527, P = 0·025). In addition, the levels of IL‐2, IL‐4, IL‐5 and IL‐6 cytokines, most of them inflammatory, were measured in CSF and plasma (Fig. 3). IL‐5 and IL‐6 were found in CSF. Interestingly, lower IL‐5 and IL‐6 peripheral levels were found in NC patients with respect to controls (P < 0·05). A positive correlation was also found between peripheral IL‐2 levels and both central classic Tregs (r = 0·783, P = 0·022) and activated Tregs (r = 0·989, P = 0·001).
Figure 3.
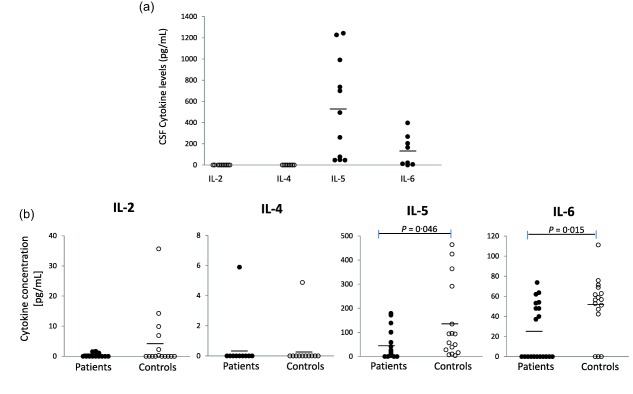
Inflammatory cytokines in the central and peripheral compartments. Cerebrospinal (CSF) and plasma were tested by enzyme‐linked immunosorbent assay (ELISA) for interleukin (IL)‐2, IL‐4, IL‐5 and IL‐6. (a) Central (CSF, a k‐related test was performed, P < 0·001), and (b) peripheral levels in patients and controls. *Significantly different between neurocysticercosis (NC) patients and controls. P < 0·005.
Discussion
Treg recruitment from the periphery to the central nervous system in human NC has been reported previously 5. To deepen our understanding of this phenomenon, the levels of several Treg phenotypes, both in the CNS and in peripheral blood, are reported here. In this context, the case of Tregs with low CD127 expression, which has been reported as a suppressive phenotype, is interesting 23. Previous studies have shown that the differential expression of CD45RO and FoxP3 could distinguish activated and functional Tregs 24, 25. According to our data, NC patients show an increase in the levels of both activated Tregs and non‐Tregs , but not of resting Tregs. These findings could be associated with the plasticity exhibited by Tregs 26. Depending on the environment, Treg cells could lose or re‐acquire the suppressive function 27. Sakaguchi et al. have proposed that the changes in the expression of FoxP3 and in the functionality of Tregs could be mediated by epigenetic changes 28. Certain conditions promote stable epigenetic changes, allowing the maintenance of FoxP3+ expression and the suppressive function in the long term 27, 28. Thus, it is possible that non‐Treg cells could be in transition to Tregs during NC.
The observed increase in the level of phenotypically activated Tregs in NC patients allows us to propose that Tregs have an active and functional phenotype during NC. More importantly, the levels of two phenotypes associated with a suppressive function (CD4+CD45RO+FoxP3high and CD4+CD25highFoxP3+CD127low) are correlated between the periphery and the site where the parasite establishes (CSF), a finding that may suggest that Tregs are exercising a suppressive action in CSF.
A mechanism through which Tregs exert their function is direct cell–cell contact 9. In this situation, Tregs interact with DCs through PD‐1, CTLA‐4, LAG‐3 and GITR, inducing a tolerogenic DC phenotype 20, 29. These molecules were found highly expressed in Treg cells from NC patients with respect to controls. A positive significant correlation between CTLA‐4+ Tregs and LAG‐3+ Tregs suggests that Tregs could express both molecules during NC. It is known that CTLA‐4 has 10 times more affinity to its ligand than CD80/CD86, and LAG‐3 interacts with HLA‐DR in DCs, preventing antigen presentation 9.
The significant increase in the expression of HLA‐DR, SLAMF1 and CD205 on DCs suggest a tolerogenic phenotype, as reported previously in vitro 6. Additionally, increased plasmatic levels of Tr1 and IL‐10 were found in NC patients. Thus, it is feasible that Tregs promote a tolerogenic DC phenotype which, in turn, induces Tr1 cells, as reported previously 30. The positive correlations between Treg CTLA‐4, LAG‐3 and PD‐1 with Tr1 in NC patients support this supposition. It is probable that the release of IL‐10 by Tr1 cells could promote an immunoregulatory environment during NC.
In addition, other cytokines such as TGF‐β and IL‐35, which could be produced by Tregs, may also participate in controlling the immune response. Our data demonstrate the presence of TGF‐β, IL‐35 and IL‐10 in CSF from NC patients. In this context, a positive correlation was found between central TGF‐β levels and central suppressive and activated Treg phenotypes (CD4+CD25highFoxP3+CD127low and CD4+CD45RO+FoxP3high). Moreover, we found a significant relation between central TGF‐β and IL‐35 levels and peripheral activated Tregs (CD4+CD45RO+FoxP3high), suggesting an important interaction between the central response and that of periphery, as TGF‐β and IL‐35 promotes Tregs 13, 31. Interestingly, peripheral IL‐35 levels correlate positively with suppressive, classic and activated Treg phenotypes at the central compartment, suggesting the importance of these peripheral cytokines in the central Treg response as IL‐35 promotes Tregs 31. Finally, our data show that central levels of IL‐10, TGF‐β and IL‐35 in NC patients could be relevant for the parasite establishment by promoting a regulatory‐driven, permissive environment.
Conversely, considering that severe NC patients show a depressed peripheral cellular immune response 3 and that previous findings suggest that cysticerci may promote Treg cells in vitro 6, we challenged the hypothesis that Tregs would increase its proliferation, exceeding that of effector cells during parasite stimulation. The number of Tregs was determined at the end of the assay, but no difference was found between patients and controls. Thus, our hypothesis was discarded and Tregs do not seem to be involved in controlling the specific proliferative immune response.
With regard to the inflammatory response, lower levels of IL‐5 and IL‐6 were found in NC patients, which suggest that Tregs could be inhibiting effector T cells 22, 23. Additionally, a negative correlation was found between suppressive Tregs (CD4+CD25highFoxP3+CD127low) and T CD4+CD38+cells, which supports this idea.
Interestingly, IL‐2 correlates positively with classic and activated central Tregs. These data are consistent with the fact that IL‐2 is a growth factor for Tregs 32; it also suggests that IL‐2 could be used by Tregs during NC.
Tregs play a preponderant role in controlling the immune response in other parasitic infections. In fact, depleting these cells decreases the number of parasites in Chagas’ disease 33. A number of studies describe some mechanisms for Treg suppressive actions and their effect in parasitic diseases. For example, in the infections by Plasmodium vivax, Wuchereria bancrofti and Mansonella perstans, host Tregs express CTLA‐4, LAG‐3 and GITR, suggesting a possible interaction between Tregs and DCs. In addition, the presence of Tregs is related to higher parasite loads 34, 35. Conversely, parasites such as Trypanosoma cruzi, Plasmodium falciparum, P. vivax and Heligmosomoides polygyrus exploit the production of imunomodulatory cytokines such as IL‐10 and TGF‐β by Tregs to promote parasite growth 34, 36, 37, 38. This study is the first to extensively characterize the different Treg populations and their mechanisms of action during human NC. Our data suggest that Tregs may act by promoting a modulatory environment that favours the survival of the parasite.
In conclusion, our data suggest that Tregs suppress the immune response against the parasite during neurocysticercosis, probably by interacting with DCs through CTLA‐4, LAG‐3, PD‐1 and GITR. This interaction could be promoting a tolerogenic DC phenotype which, in turn, induces Tr1 cells. Tr1 cells could then release IL‐10 and create an immunomodulatory environment that would favour the development of T. solium cysticerci and its permanence in the host's central nervous system. Further studies will be conducted to confirm that Tregs actually suppress the immune response through direct contact with DCs.
Disclosure
The authors declare no conflict of interest regarding the publication of this paper.
Author contributions
A. A.‐S., D. D. Á.‐L., D. C.‐H., M. H. and F. G.‐V. performed the experiments; A. F. and J. V.‐P. provided samples from human patients; A. A.‐S. and G. C. performed the statistical analysis; A. A.‐S., G. F., E. S. and L. A.‐P. designed the study protocol. A. A.‐S., G. C., G. F., E. S. and L. A.‐P. wrote the paper.
Acknowledgements
This study was supported by CONACYT (CB‐2008‐01 100708, CB‐2011‐01 167278) and by DGAPA IN213911, Mexico. Juan Francisco Rodriguez copy‐edited the English version of this paper. The authors thank Carlos Castellanos Barba for his technical assistance in flow cytometry.
References
- 1. Sciutto E, Fragoso G, Fleury A et al Taenia solium disease in humans and pigs: an ancient parasitosis disease rooted in developing countries and emerging as a major health problem of global dimensions. Microbes Infect 2000; 2:1875–90. [DOI] [PubMed] [Google Scholar]
- 2. Fabiani S, Bruschi F. Neurocysticercosis in Europe: still a public health concern not only for imported cases. Acta Trop 2013; 128:18–26. [DOI] [PubMed] [Google Scholar]
- 3. Chavarria A, Fleury A, Bobes RJ, Morales J, Fragoso G, Sciutto E. A depressed peripheral cellular immune response is related to symptomatic neurocysticercosis. Microbes Infect 2006; 8:1082–9. [DOI] [PubMed] [Google Scholar]
- 4. Adalid‐Peralta L, Fragoso G, Fleury A, Sciutto E. Mechanisms underlying the induction of regulatory T cells and its relevance in the adaptive immune response in parasitic infections. Int J Biol Sci 2011; 7:1412–26. [DOI] [PMC free article] [PubMed] [Google Scholar]
- 5. Adalid‐Peralta L, Fleury A, García‐Ibarra TM et al Human neurocysticercosis: in vivo expansion of peripheral regulatory T cells and their recruitment in the central nervous system. J Parasitol 2012; 98:142–8. [DOI] [PubMed] [Google Scholar]
- 6. Adalid‐Peralta L, Arce‐Sillas A, Fragoso G et al Cysticerci drive dendritic cells to promote in vitro and in vivo Tregs differentiation. Clin Dev Immunol 2013; 2013 :981468. [DOI] [PMC free article] [PubMed] [Google Scholar]
- 7. Amante FH, Stanley AC, Randall LM et al A role for natural regulatory T cells in the pathogenesis of experimental cerebral malaria. Am J Pathol 2007; 171:548–59. [DOI] [PMC free article] [PubMed] [Google Scholar]
- 8. Bourreau E, Ronet C, Darcissac E et al Intralesional regulatory T‐cell suppressive function during human acute and chronic cutaneous leishmaniasis due to Leishmania guyanensis . Infect Immun 2009; 77:1465–74. [DOI] [PMC free article] [PubMed] [Google Scholar]
- 9. Vignali DA, Collison LW, Workman CJ. How regulatory T cells work. Nat Rev Immunol 2008; 8:523–32. [DOI] [PMC free article] [PubMed] [Google Scholar]
- 10. Roncarolo MG, Gregori S, Bacchetta R, Battaglia M. Tr1 cells and the counter‐regulation of immunity: natural mechanisms and therapeutic applications. Curr Top Microbiol Immunol 2014; 380:39–68. [DOI] [PubMed] [Google Scholar]
- 11. Gu J, Lu L, Chen M et al TGF‐β‐induced CD4+FOXP3+ T cells attenuate acute graft‐versus‐host disease by suppressing expansion and killing of effector CD8+ cells. J Immunol 2014; 193:3388–97. [DOI] [PMC free article] [PubMed] [Google Scholar]
- 12. Li X, Mai J, Virtue A et al IL‐35 is a novel responsive anti‐inflammatory cytokine: A new system of categorizing anti‐inflammatory cytokines. PLOS ONE 2012; 7:e33628. [DOI] [PMC free article] [PubMed] [Google Scholar]
- 13. Yamagiwa S, Gray JD, Hashimoto S, Horwitz DA. A role for TGF‐beta in the generation and expansion of CD4+CD25+ regulatory T cells from human peripheral blood. J Immunol 2001; 166:7282–9. [DOI] [PubMed] [Google Scholar]
- 14. Collison LW, Chaturvedi V, Henderson AL et al IL‐35‐mediated induction of a potent regulatory T cell population. Nat Immunol 2010; 11:1093–101. [DOI] [PMC free article] [PubMed] [Google Scholar]
- 15. Sansom DM, Walker LS. The role of CD28 and cytotoxic T‐lymphocyte antigen‐4 (CTLA‐4) in regulatory T‐cell biology. Immunol Rev 2006; 212:131–48. [DOI] [PubMed] [Google Scholar]
- 16. Kowalczyk A, D'Souza CA, Zhang L. Cell‐extrinsic CTLA4‐mediated regulation of dendritic cell maturation depends on STAT3. Eur J Immunol 2014; 44:1143–55. [DOI] [PubMed] [Google Scholar]
- 17. Tan PH, Yates JB, Xue SA et al Creation of tolerogenic human dendritic cells via intracellular CTLA4: a novel strategy with potential in clinical immunosuppression. Blood 2005; 106:2936–43. [DOI] [PubMed] [Google Scholar]
- 18. Rutella S, Danese S, Leone G. Tolerogenic dendritic cells: cytokine modulation comes of age. Blood 2006; 108:1435–40. [DOI] [PubMed] [Google Scholar]
- 19. Keir ME, Francisco LM, Sharpe AH. PD‐1 and its ligands in T‐cell immunity. Curr Opin Immunol 2007; 19:309–14. [DOI] [PubMed] [Google Scholar]
- 20. Hafalla JC, Claser C, Couper KN et al The CTLA‐4 and PD‐1/PD‐L1 inhibitory pathways independently regulate host resistance to plasmodium‐induced acute immune pathology. PLOS Pathog 2012; 8:e1002504. [DOI] [PMC free article] [PubMed] [Google Scholar]
- 21. Yu KY, Kim HS, Song SY, Min SS, Jeong JJ, Youn BS. Identification of a ligand for glucocorticoid‐induced tumor necrosis factor receptor constitutively expressed in dendritic cells. Biochem Biophys Res Commun 2003; 310:433–8. [DOI] [PubMed] [Google Scholar]
- 22. Hori S, Nomura T, Sakaguchi S. Control of regulatory T cell development by the transcription factor FOXP3. Science 2003; 299:1057–61. [DOI] [PubMed] [Google Scholar]
- 23. Sakaguchi S, Miyara M, Costantino CM, Hafler DA. FOXP3+ regulatory T cells in the human immune system. Nat Rev Immunol 2010; 10:490–500. [DOI] [PubMed] [Google Scholar]
- 24. Miyara M, Yoshioka Y, Kitoh A et al Functional delineation and differentiation dynamics of human CD4+ T cells expressing the FoxP3 transcription factor. Immunity 2009; 30:899–911. [DOI] [PubMed] [Google Scholar]
- 25. Takata Y, Nakamoto Y, Nakada A et al Frequency of CD45RO+ subset in CD4+CD25high regulatory T cells associated with progression of hepatocellular carcinoma. Cancer Lett 2011; 307:165–73. [DOI] [PubMed] [Google Scholar]
- 26. Duarte JH, Zelenay S, Bergman ML, Martins AC, Demengeot J. Natural Treg cells spontaneously differentiate into pathogenic helper cells in lymphopenic conditions. Eur J Immunol 2009; 39:948–55. [DOI] [PubMed] [Google Scholar]
- 27. Miyao T, Floess S, Setoguchi R et al Plasticity of Foxp3(+) T cells reflects promiscuous Foxp3 expression in conventional T cells but not reprogramming of regulatory T cells. Immunity 2012; 36:262–75. [DOI] [PubMed] [Google Scholar]
- 28. Sakaguchi S, Vignali DA, Rudensky AY, Niec RE, Waldmann H. The plasticity and stability of regulatory T cells. Nat Rev Immunol 2013; 13:461–7. [DOI] [PubMed] [Google Scholar]
- 29. Liang B, Workman C, Lee J et al Regulatory T cells inhibit dendritic cells by lymphocyte activation gene‐3 engagement of MHC class II. J Immunol 2008; 180:5916–26. [DOI] [PubMed] [Google Scholar]
- 30. Pletinckx K, Vaeth M, Schneider T et al Immature dendritic cells convert anergic non‐regulatory T cells into Foxp3‐ IL‐10+ regulatory T cells by engaging CD28 and CTLA‐4. Eur J Immunol 2015; 45:480–91. [DOI] [PubMed] [Google Scholar]
- 31. Collison LW, Workman CJ, Kuo TT et al The inhibitory cytokine IL‐35 contributes to regulatory T‐cell function. Nature 2007; 450:566–9. [DOI] [PubMed] [Google Scholar]
- 32. Huang W, Jeong AR, Kannan AK, Huang L, August A. IL‐2‐inducible T cell kinase tunes T regulatory cell development and is required for suppressive function. J Immunol 2014; 193:2267–72. [DOI] [PMC free article] [PubMed] [Google Scholar]
- 33. Bonney KM, Taylor JM, Thorp EB, Epting CL, Engman DM. Depletion of regulatory T cells decreases cardiac parasitosis and inflammation in experimental Chagas disease. Parasitol Res 2015; 114:1167–78. [DOI] [PMC free article] [PubMed] [Google Scholar]
- 34. Bueno LL, Morais CG, De Araújo FF et al Plasmodium vivax: induction of CD4+CD25+FoxP3+ regulatory T cells during infection are directly associated with level of circulating parasites. PLOS ONE 2010; 5:e9623. [DOI] [PMC free article] [PubMed] [Google Scholar]
- 35. Metenou S, Coulibaly YI, Sturdevant D et al Highly heterogeneous, activated, and short‐lived regulatory T cells during chronic filarial infection. Eur J Immunol 2014; 44:2036–47. [DOI] [PMC free article] [PubMed] [Google Scholar]
- 36. De Araújo FF, Vitelli‐Avelar DM, Teixeira‐Carvalho A et al Regulatory T cells phenotype in different clinical forms of Chagas’ disease. PLOS Negl Trop Dis 2011; 5:e992. [DOI] [PMC free article] [PubMed] [Google Scholar]
- 37. Walther M, Tongren JE, Andrews L et al Upregulation of TGF‐beta, FOXP3, and CD4+CD25+ regulatory T cells correlates with more rapid parasite growth in human malaria infection. Immunity 2005; 23:287–96. [DOI] [PubMed] [Google Scholar]
- 38. Grainger JR, Smith KA, Hewitson JP et al Helminth secretions induce de novo T cell FoxP3 expression and regulatory function through the TGF‐β pathway. J Exp Med 2010; 207:2331–41.] [DOI] [PMC free article] [PubMed] [Google Scholar]