Abstract
Objective:
Heavy drinking is common on college campuses, with a marked increase from high school to freshman year. Programs addressing heavy campus drinking often personalize prevention protocols to fit a student’s demography and prior drinking characteristics. Few efforts have individualized approaches to address a person’s vulnerability through his or her low level of response (low LR) to alcohol.
Method:
This article describes the recently completed 55-week outcome in drinking quantities and problems for the >90% of 500 participants in a prevention program at a U.S. university (62% female, mean age = 18 years) who completed a 4-week series of 50-minute videos delivered via the Internet. We evaluated whether, for low LRs, participation in an educational approach that focused on a low LR (the LR-based [LRB] condition) was associated with better outcomes than a state-of-the-art (SOTA) general education or with a no-intervention control condition.
Results:
Using a mixed-design analysis of variance and focusing on the most closely ethnically matched high and low LR pairs, students with low LRs in the LRB condition demonstrated the greatest decreases in usual and maximum drinks over the 55 weeks, especially when compared with closely ethnically matched students with high LRs. Low LR controls showed the highest drinking values over time.
Conclusions:
This study underscores the potential importance of targeting a person’s specific preexisting vulnerability toward heavy drinking when he or she enters college. The approach can be used in a relatively inexpensive protocol of video education sessions delivered via the Internet.
Heavy drinking (e.g., consuming four or more standard drinks on an occasion) is seen in almost half of college students, and alcohol use disorders are observed in about 20% of 18- to 29-year-olds (Hingson et al., 2009; Johnston et al., 2015; Kessler et al., 2005). Such heavy drinking contributed to injuries in more than 10% of college students and overall shortens life spans by about 10% in the general population (Hingson et al., 2009; Lundin et al., 2015). More than half of college drinkers report blackouts, two thirds have become physically sick from drinking, and alcohol contributes to sexual aggression among college men (Abbey et al., 2014; Barnett et al., 2014; Johnston et al., 2015; Testa et al., 2015).
Genetic influences explain more than 50% of the risk for heavy drinking and alcohol problems and operate through intermediate characteristics such as impulsivity and a person’s alcohol response (King et al., 2014; Newlin & Renton, 2010; Schuckit, 2014). The latter includes low levels of response (low LRs), which is observed predominantly for sedating effects of alcohol at peak and falling blood alcohol concentrations. The low LR is most closely related to the amount of alcohol consumed per event, perhaps as drinkers consume as much alcohol as they need to get the desired effects (e.g., Schuckit et al., 2011a, 2011b). Such genetically influenced characteristics that are present early in the drinking career offer opportunities to identify individuals at elevated risk before their problems escalate.
Once people vulnerable to alcohol problems are found, working with them to alter environmental mediators of their predisposition may be more likely to change behaviors and carry fewer risks than modifying the large number of genes likely to contribute to these conditions (Schuckit, 2014). Our group has identified several mediators of how a low LR enhances problematic drinking, including selecting heavier drinking peers who reinforce high consumption, developing expectations that drunkenness is desirable, experiencing higher stress related to heavy drinking, and using alcohol to cope with stress (Borsari & Carey, 2001, 2003; Fromme & D’Amico, 2000; Patrick et al., 2010; Schuckit et al., 2011b; Veenstra et al., 2007). These findings raise the possibility that identifying individuals with low LRs and working to minimize the impact of the partial mediators of the effect of this phenotype on heavier drinking might diminish high consumption related to lower LR.
Prevention programs might be most effective when the message is given in a manner most meaningful to recipients by personalizing the information to fit their background (Cronce & Larimer, 2011; Miller et al., 2015). Although most efforts have focused on giving feedback based on a person’s demography and drinking pattern (Carey et al., 2007; Larimer & Cronce, 2007), a few prevention protocols have placed an emphasis on preexisting phenotypes, such as impulsivity, in an effort to decrease problematic alcohol and illicit drug use (Conrod et al., 2010, 2013; Newton et al., 2012).
Considering the usual drinking onset in the mid-teens (Faden, 2006), it might be advantageous to implement interventions early in the drinking career, especially during transitions associated with heavy drinking, such as moving from home to enter college (Fromme et al., 2008; Mallett et al., 2013). Here, a person moves away from frequent contact with parents and long-time friends to an environment in which heavy drinking is more common. The proportion of drinking students increases 60% between high school and college, and drunkenness with associated problems increases by almost 50%. These figures differ by race/ethnicity, with, for example, the heaviest drinking in Hispanic and European American (EA) students, and less drinking by African American (AA) and Asian students. Ethnic differences are also seen for the low LR to alcohol (Ehlers et al., 2004; Eng et al., 2007; Pedersen & McCarthy, 2013).
Our group developed a relatively inexpensive to implement, Internet-based, heavy drinking prevention protocol that focuses on the low LR to alcohol as a phenotype associated with heavier drinking and alcohol-related problems. The overall goals were to modify well-established components of campus-based prevention programs (e.g., Borsari & Carey, 2001; Carey et al., 2007; Larimer & Cronce, 2007) to address a specific genetically influenced preexisting risk factor for excessive alcohol intake (Schuckit, 2014). The first step was a pilot study of 64 drinking but not alcohol-dependent freshmen who were selected as high and low LR pairs based on a median split on the Self-Rating of the Effects of Alcohol (SRE) questionnaire (Schuckit et al., 2012). LR pairs were randomly assigned to watch one of two sets of videos, and their drinking patterns were assessed for 8 weeks. As described below, both sets used motivational interviewing principles and personalized feedback to teach drinking refusal skills and ways to deal with stress, and to develop accurate social norm beliefs and perceptions of alcohol’s effects. In the state-of-the-art (SOTA) condition, the information was offered without emphasis on any one model of risk, whereas the second set emphasized how low LRs increase drinking and alcohol problems (the LR-based [LRB] condition). At follow-up, low LR students decreased usual and maximum drinking quantities almost twice as much in the LRB versus the SOTA protocol. Subjects with higher LRs tended to do better when in the SOTA condition.
The second article presented the 8-week outcome for a new group of 500 freshmen who are part of the current study (Schuckit et al., 2015). For those in the LRB and SOTA conditions, 99% watched all four videos and correctly answered questions assessing comprehension. Data at 8 weeks were available on 227 matched pairs after deleting dropouts and their matched partners. Drinking practices across baseline, 4 weeks, and 8 weeks indicated that low LR subjects in the LRB condition demonstrated greater decreases in maximum drinks, with a trend in the same direction for usual drinks (p = .06), compared with low LR participants in the SOTA and control conditions. Students with high LRs had better outcomes when in the SOTA protocol. Those findings were most robust when suboptimally ethnically matched pairs were not included.
The current article builds on the same protocol to report the 55-week course of drinking quantities for low and high LR subjects in the LRB, SOTA, and control conditions. We tested three hypotheses: (a) participation in either LRB or SOTA video protocols would be associated with greater decreases in usual and maximum alcohol quantities compared with controls, (b) low LR subjects would do best in the LRB, and (c) high LR subjects would do best in the SOTA condition.
Method
Subjects
Following approval by the University of California, San Diego Human Protections Committee, recruitment of subjects, education condition assignments, video creations, and assessment procedures were implemented, as described in detail in an earlier article (Schuckit et al., 2015). A questionnaire using items from the Semi-Structured Assessment for the Genetics of Alcoholism (SSAGA) interview (Bucholz et al., 1994; Hesselbrock et al., 1999) was distributed to freshmen to review their demography, drinking/drug use, and related diagnoses from the Diagnostic and Statistical Manual of Mental Disorders, Fourth Edition (DSM-IV; American Psychiatric Association, 1994). Students also filled out the SRE to measure LR as the average number of standard drinks for up to four effects (initial feeling any effect of alcohol, slurring speech, stumbling, and unwanted falling asleep) during the approximate first five times of drinking (SRE First 5) (Schuckit et al., 2011a). The SRE has a Cronbach’s α of .88 for these subjects and repeat reliabilities of .66 (Ray et al., 2007; Schuckit et al., 1997).
After we excluded nondrinkers and those with lifetime alcohol/drug dependence, schizophrenia, or antisocial personality disorder, a median split on the SRE was used to identify individuals with low and high LR who were matched on sex, ethnicity, and recent alcohol quantities and frequencies. Ethnicity matches were most accurate among self-reported EA and Asian individuals but were not precise among other ethnicities where, because of small numbers, AA, Middle Eastern, Pacific Islander, Malay, and Filipino students were often matched together. Also, occasionally self-identified White Hispanics (meaning Hispanic but not AA) were matched with non-Hispanic EAs to optimize similarities in drinking parameters. More than 80% of eligible students agreed to participate, and the process continued until 250 LR pairs were enrolled.
Pairs of students with high and low LRs were randomly assigned to the LRB, SOTA, and control conditions stratified by sex, alcohol quantity and frequency, and race/ethnicity. Most students were in video versus control conditions to optimize comparisons of outcomes across the LRB and SOTA protocols.
Interventions and outcome measures
LRB and SOTA subjects were paid $20 for viewing each 45- to 50-minute video on a website available for viewing anywhere 24 hours a day for 7 days and for answering questions about major issues covered in that module. The four LRB and four SOTA videos were didactic lectures by the first author and incorporated motivational interviewing techniques. Videos gave feedback on participants’ beliefs about social norms, risks of consuming more than three drinks per occasion, accurate expectations of alcohol’s effects, how to identify and cope with stress, and related topics by asking viewers to write down answers to questions early in the videos and later presenting the optimal answer (Borsari & Carey, 2003; King & Chassin, 2008; Neighbors et al., 2007). The videos also addressed ways to decrease drinking, discussed how to refuse drinks, emphasized a person’s ability to change, and helped viewers set realistic goals for altering drinking behaviors (Borsari & Carey, 2001, 2003; Carey et al., 2007; Larimer & Cronce, 2007). However, only the LRB protocol gave examples of how a low LR can relate to peer pressures, alcohol expectancies, stress, and drinking in producing heavier drinking (e.g., Schuckit et al., 2011a). The SOTA videos contained a range of examples to demonstrate major points but did not emphasize LR.
Follow-up
When originally recruited, in order to facilitate follow-up, participants listed three informants likely to know their future whereabouts, along with their phone numbers and email addresses. Online assessments of all subjects using SSAGA-based questions about interval drinking occurred a month after the last video and up to every 3 months for most intervals, with payment of $20 for each. Subjects were regularly sent emails with humorous cartoons and reminders about their next assessment and/or video, were notified again the night before the next step was scheduled, and were recontacted several days later if they had not responded.
Analyses
Using SPSS Version 18.0 for all analyses, we evaluated maximum and usual drinking quantities over time using a 2 LR Group × 3 Education Conditions × 4 Racial/Ethnic Groups (EA, Asian, White Hispanic, and other) × 7 Time Points mixed-design analysis of variance (ANOVA), with time as the repeated measure, including an evaluation of the LR × Education Condition × Time three-way interaction. Both higher order and linear contrasts were used depending on whether the outcomes indicated linear changes in alcohol use over time or presented variable patterns of increases and decreases in drinking. Reflecting skewed distributions for drinking patterns, data were evaluated using log or square root transformations, depending on the distribution of values. SPSS multiple imputation was used for missing data for the 12 subjects with one missing data point (the maximum allowed for these analyses), and effect sizes were determined using partial eta-squared (ηp2). The comparisons across the six groups in Table 1 were carried out using SPSS ANOVAs for continuous (F values) and chi-square for categorical variables.
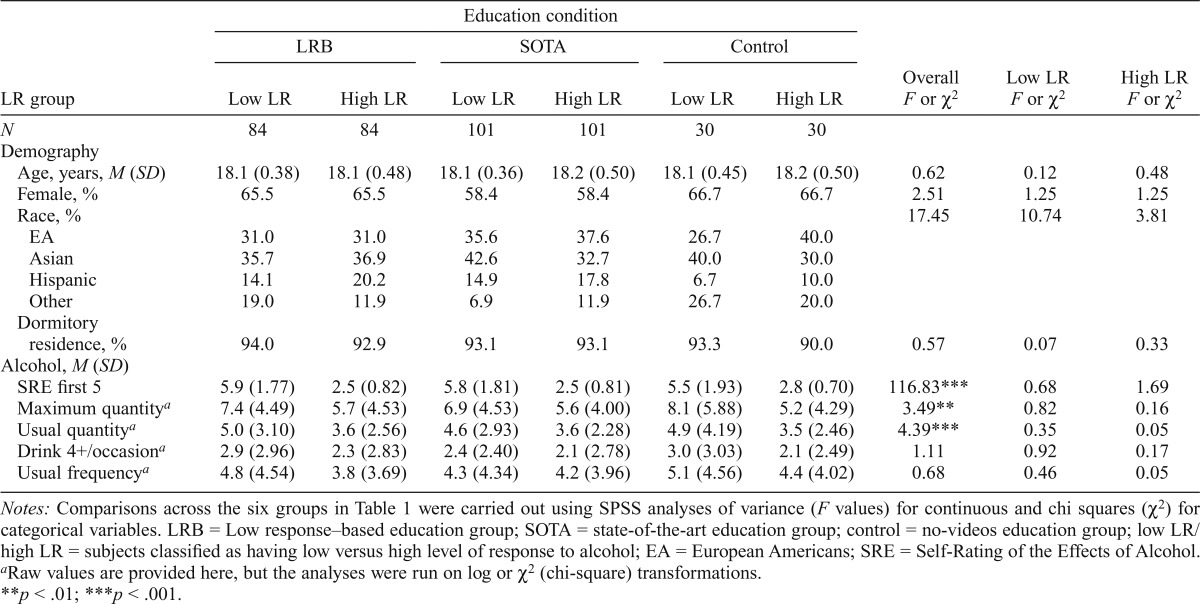
Table 1.
Demography, alcohol, and drug characteristics at baseline (Time 1) across the three education conditions for 215 pairs (430 subjects).
| LR group | Education condition |
Overall F or χ2 | Low LR F or χ2 | High LR F or χ2 | |||||
| LRB |
SOTA |
Control |
|||||||
| Low LR | High LR | Low LR | High LR | Low LR | High LR | ||||
| N | 84 | 84 | 101 | 101 | 30 | 30 | |||
| Demography | |||||||||
| Age, years, M (SD) | 18.1 (0.38) | 18.1 (0.48) | 18.1 (0.36) | 18.2 (0.50) | 18.1 (0.45) | 18.2 (0.50) | 0.62 | 0.12 | 0.48 |
| Female, % | 65.5 | 65.5 | 58.4 | 58.4 | 66.7 | 66.7 | 2.51 | 1.25 | 1.25 |
| Race, % | 17.45 | 10.74 | 3.81 | ||||||
| EA | 31.0 | 31.0 | 35.6 | 37.6 | 26.7 | 40.0 | |||
| Asian | 35.7 | 36.9 | 42.6 | 32.7 | 40.0 | 30.0 | |||
| Hispanic | 14.1 | 20.2 | 14.9 | 17.8 | 6.7 | 10.0 | |||
| Other | 19.0 | 11.9 | 6.9 | 11.9 | 26.7 | 20.0 | |||
| Dormitory residence, % | 94.0 | 92.9 | 93.1 | 93.1 | 93.3 | 90.0 | 0.57 | 0.07 | 0.33 |
| Alcohol, M (SD) | |||||||||
| SRE first 5 | 5.9 (1.77) | 2.5 (0.82) | 5.8 (1.81) | 2.5 (0.81) | 5.5 (1.93) | 2.8 (0.70) | 116.83*** | 0.68 | 1.69 |
| Maximum quantitya | 7.4 (4.49) | 5.7 (4.53) | 6.9 (4.53) | 5.6 (4.00) | 8.1 (5.88) | 5.2 (4.29) | 3.49** | 0.82 | 0.16 |
| Usual quantitya | 5.0 (3.10) | 3.6 (2.56) | 4.6 (2.93) | 3.6 (2.28) | 4.9 (4.19) | 3.5 (2.46) | 4.39*** | 0.35 | 0.05 |
| Drink 4+/occasiona | 2.9 (2.96) | 2.3 (2.83) | 2.4 (2.40) | 2.1 (2.78) | 3.0 (3.03) | 2.1 (2.49) | 1.11 | 0.92 | 0.17 |
| Usual frequencya | 4.8 (4.54) | 3.8 (3.69) | 4.3 (4.34) | 4.2 (3.96) | 5.1 (4.56) | 4.4 (4.02) | 0.68 | 0.46 | 0.05 |
Notes: Comparisons across the six groups in Table 1 were carried out using SPSS analyses of variance (F values) for continuous and chi squares (χ2) for categorical variables. LRB = Low response-based education group; SOTA = state-of-the-art education group; control = no-videos education group; low LR/high LR = subjects classified as having low versus high level of response to alcohol; EA = European Americans; SRE = Self-Rating of the Effects of Alcohol.
Raw values are provided here, but the analyses were run on log or χ2 (chi-square) transformations.
p < .01;
p < .001.
Results
Subjects
Of the 500 subjects, 462 (92.4%) completed the 55-week protocol. These included 215 LR pairs (N = 430) in which both low and high LR members remained in the study, among which 145 pairs (n = 290) were optimal ethnically matched EA, Asian, or Hispanic pairs.
Table 1 presents baseline demographic and substancerelated characteristics for the full sample of 215 low and high LR pairs, with data offered separately for the LRB, SOTA, and control conditions. There were no significant overall differences in demography or residence across the six subgroups (low and high LR subjects in the LRB, SOTA, and control conditions), nor within low LR or high LR subjects across the LRB, SOTA, and control conditions. The approximately 13% of the 215 subjects whose race/ethnicity was listed as “other” included 5.3% Filipino/Malay, 3.0% South Asian, and 2.1% AA as well as less than 2% each who identified themselves as Pacific Islander, Native American, or Middle Eastern. By design, SRE values were significantly different across the six groups but were similar within low LRs and high LRs across the LRB, SOTA, and control conditions. Baseline alcohol consumption was similar for usual drinking frequencies and occasions when four or more drinks were consumed. Although the low LR subjects reported higher baseline drinking quantities overall, alcohol intake was similar within low LRs and high LRs across the LRB, SOTA, and control conditions.
Maximum drinks over time
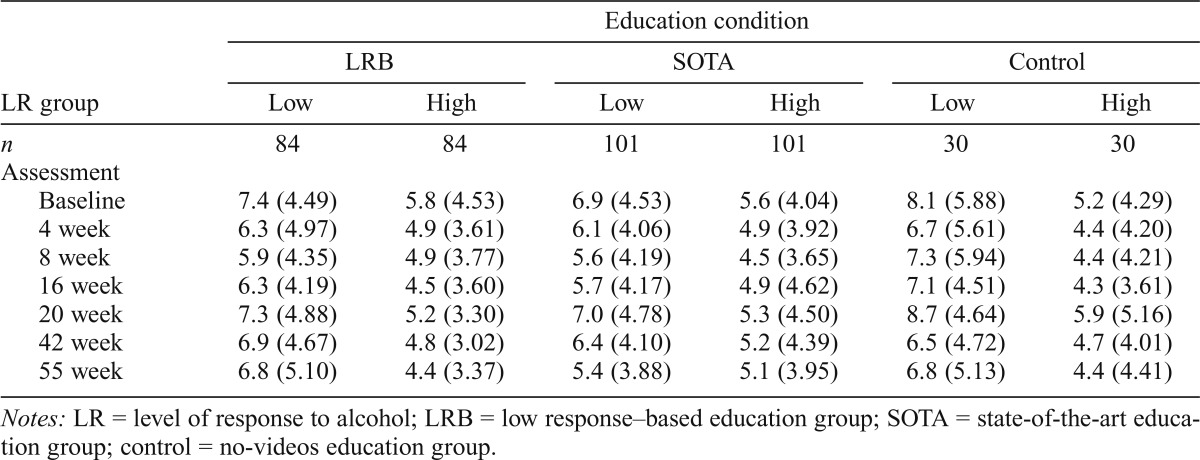
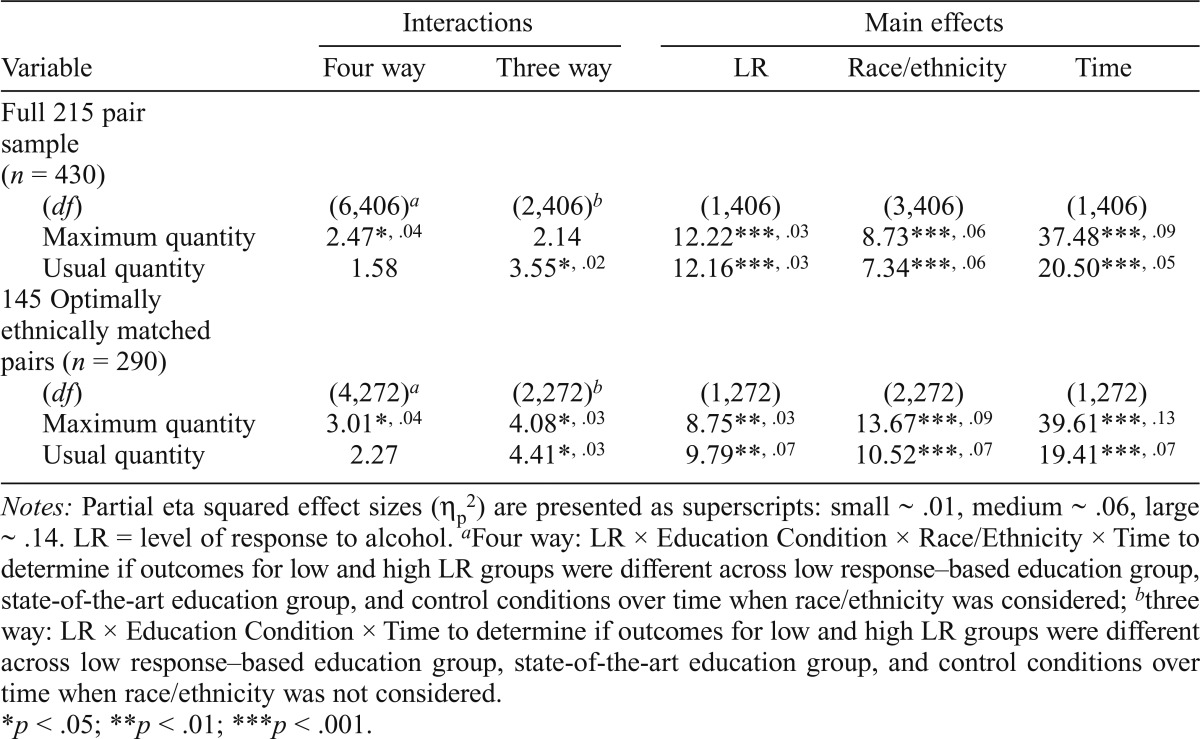
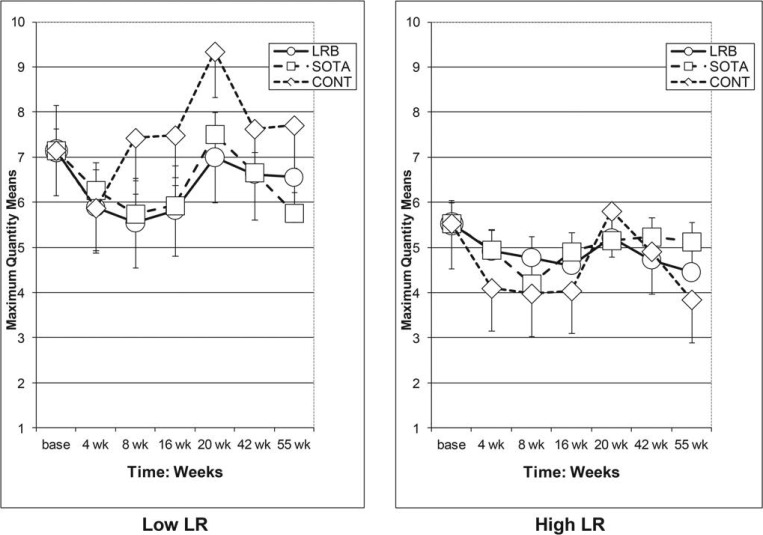
Table 2 describes raw data for maximum drinks for 30 days before baseline and before each follow-up during the school year over the 55 weeks for 215 pairs. These data help address whether low LRs had the lowest postbaseline maximum drinks when in the LRB protocol and high LR SOTA subjects had the best outcomes (Hypotheses 2 and 3). The statistical analyses for these data are shown in Table 6, where the second data row (“Maximum quantity” in the top half of the table) reports results of the four-way interaction. This helps evaluate if outcomes over time for the low and high LR groups were different across the LRB, SOTA, and control groups when race/ethnicity was considered. There were significant LR, race/ethnicity, and time main effects, along with a significant four-way interaction. However, in the same analysis after we collapsed across race/ethnicity, the three-way interaction was not significant. Thus, changes in maximum drinks by low and high LR subjects across the three education conditions over time were only significant after considering ethnicity. Results of the ANOVA, including the effects of all variables, are demonstrated in Figure 1, along with adjustments for baseline differences across the education conditions. Note that to optimize clarity, all figures only show half standard-error bars.
Table 2.
Prior month maximum quantities (raw data) across the seven assessments for 215 low and high LR pairs (430 subjects) in the three education conditions, M (SD)
| LR group | Education condition |
|||||
| LRB |
SOTA |
Control |
||||
| Low | High | Low | High | Low | High | |
| n | 84 | 84 | 101 | 101 | 30 | 30 |
| Assessment | ||||||
| Baseline | 7.4 (4.49) | 5.8 (4.53) | 6.9 (4.53) | 5.6 (4.04) | 8.1 (5.88) | 5.2 (4.29) |
| 4 week | 6.3 (4.97) | 4.9 (3.61) | 6.1 (4.06) | 4.9 (3.92) | 6.7 (5.61) | 4.4 (4.20) |
| 8 week | 5.9 (4.35) | 4.9 (3.77) | 5.6 (4.19) | 4.5 (3.65) | 7.3 (5.94) | 4.4 (4.21) |
| 16 week | 6.3 (4.19) | 4.5 (3.60) | 5.7 (4.17) | 4.9 (4.62) | 7.1 (4.51) | 4.3 (3.61) |
| 20 week | 7.3 (4.88) | 5.2 (3.30) | 7.0 (4.78) | 5.3 (4.50) | 8.7 (4.64) | 5.9 (5.16) |
| 42 week | 6.9 (4.67) | 4.8 (3.02) | 6.4 (4.10) | 5.2 (4.39) | 6.5 (4.72) | 4.7 (4.01) |
| 55 week | 6.8 (5.10) | 4.4 (3.37) | 5.4 (3.88) | 5.1 (3.95) | 6.8 (5.13) | 4.4 (4.41) |
Notes: LR = level of response to alcohol; LRB = low response–based education group; SOTA = state-of-the-art education group; control = no-videos education group.
Table 6.
Four-waya and three-wayb interactions and relevant main effects for maximum and usual quantities using mixed-design ANOVAs with time as the repeated measure for the 215 pair sample (430 subjects) and for the 145 optimally ethnically matched pairs (290 subjects) (F values are presented, with effect sizes in superscripts)
| Variable | Interactions |
Main effects |
|||
| Four way | Three way | LR | Race/ethnicity | Time | |
| Full 215 pair sample (n = 430) | |||||
| (df) | (6,406)a | (2,406)b | (1,406) | (3,406) | (1,406) |
| Maximum quantity | 2.47*, .04 | 2.14 | 12.22***, .03 | 8.73***, .06 | 37.48***, .09 |
| Usual quantity | 1.58 | 3.55*, .02 | 12.16*** 03 | 7.34***, .06 | 20.50***, 05 |
| 145 Optimally ethnically matched pairs (n = 290) | |||||
| (df) | (4,272)a | (2,272)b | (1,272) | (2,272) | (1,272) |
| Maximum quantity | 3.01*, .04 | 4.08*, .03 | 8.75**, .03 | 13.67***, .09 | 39.61***, .13 |
| Usual quantity | 2.27 | 4.41*, .03 | 9.79**, .07 | 10.52***, .07 | 19.41***, .07 |
Notes: Partial eta squared effect sizes (ηp2) are presented as superscripts: small ∼ .01, medium ∼ .06, large ∼ .14. LR = level of response to alcohol.
Four way: LR × Education Condition × Race/Ethnicity × Time to determine if outcomes for low and high LR groups were different across low response–based education group, state-of-the-art education group, and control conditions over time when race/ethnicity was considered;
three way: LR × Education Condition × Time to determine if outcomes for low and high LR groups were different across low response–based education group, state-of-the-art education group, and control conditions over time when race/ethnicity was not considered.
p < .05;
p < .01;
p < .001.
Figure 1.
Maximum drinks over time with half standard error bars for 215 matched pairs for low level of response (LR) (left) and high LR (right) subjects. LRB = LR-based education group; SOTA = state-of-the-art education group; CONT = control—no-videos education group; wk = week.
The patterns in Figure 1 raised the possibility that the greater difference across education conditions may be for low LR subjects. Therefore, although not shown in Table 6, the maximum drinks analysis was repeated using only the 215 low LRs in the total sample. Within the low LR group there was a significant Education Condition × Race/Ethnicity × Time three-way interaction (F = 2.70, p < .05, ηp2 = .07), and a significant Education Condition × Time two-way interaction (F = 3.22, p < .05, ηp2 = .03). The same was not true for the high LR group, where there was no Education Condition × Ethnicity × Time interaction and only a trend for the Education Condition × Time interaction (F = 2.45, p < .09, ηp2 = .02). Thus, the outcomes for low LR individuals differed depending on their education group assignment, whereas within high LR subjects, outcomes did not depend on their education group.
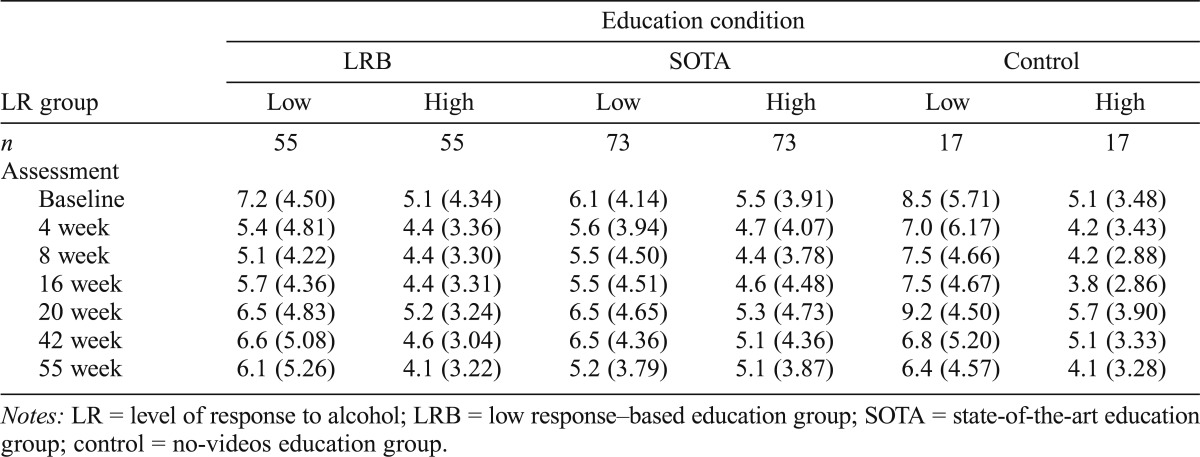
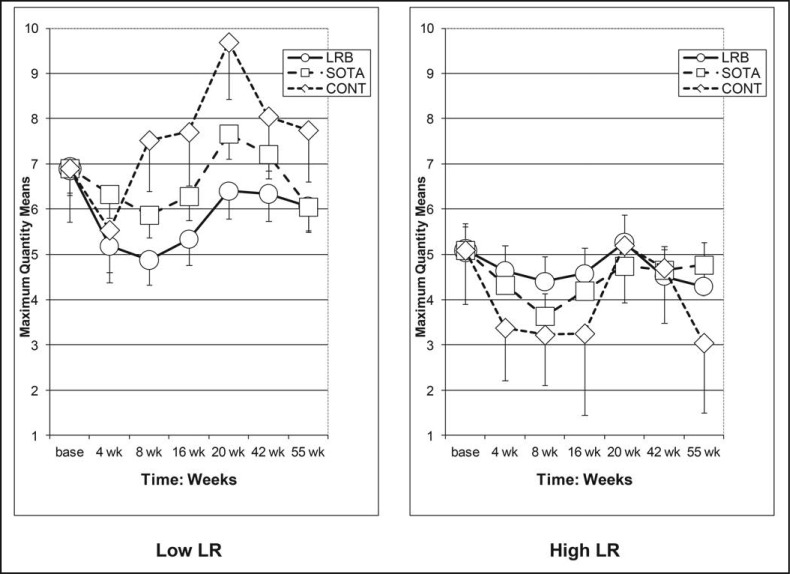
Considering the significant race/ethnicity main effect for the 215 pairs in Table 6 and the importance of race/ethnicity in the 8-week follow-up article (Schuckit et al., 2015), data for maximum drinks were also analyzed for 145 pairs within the most closely matched EA, Asian, and White Hispanic low and high LR pairs. The raw data for maximum drinks in this subgroup are shown in Table 3, and the statistical analyses are presented in the fifth data row in Table 6 (“Maximum quantity” in the lower half of the table), as well as graphically in Figure 2. For these ethnically well-matched subjects, low and high LR individuals had different outcomes for maximum drinks over time depending on their education group, both when race/ethnicity was considered in the fourway interaction and when collapsed across race/ethnicity for the three-way interaction. Separate analyses for low and high LR subjects are not presented for this subgroup because of the relatively low numbers of individuals in some data cells.
Table 3.
Prior month maximum quantities (raw data) across the seven assessments for 145 optimally ethnically matched low and high LR pairs (290 subjects) in the three education conditions, M (SD)
| LR group | Education condition |
|||||
| LRB |
SOTA |
Control |
||||
| Low | High | Low | High | Low | High | |
| n | 55 | 55 | 73 | 73 | 17 | 17 |
| Assessment | ||||||
| Baseline | 7.2 (4.50) | 5.1 (4.34) | 6.1 (4.14) | 5.5 (3.91) | 8.5 (5.71) | 5.1 (3.48) |
| 4 week | 5.4 (4.81) | 4.4 (3.36) | 5.6 (3.94) | 4.7 (4.07) | 7.0 (6.17) | 4.2 (3.43) |
| 8 week | 5.1 (4.22) | 4.4 (3.30) | 5.5 (4.50) | 4.4 (3.78) | 7.5 (4.66) | 4.2 (2.88) |
| 16 week | 5.7 (4.36) | 4.4 (3.31) | 5.5 (4.51) | 4.6 (4.48) | 7.5 (4.67) | 3.8 (2.86) |
| 20 week | 6.5 (4.83) | 5.2 (3.24) | 6.5 (4.65) | 5.3 (4.73) | 9.2 (4.50) | 5.7 (3.90) |
| 42 week | 6.6 (5.08) | 4.6 (3.04) | 6.5 (4.36) | 5.1 (4.36) | 6.8 (5.20) | 5.1 (3.33) |
| 55 week | 6.1 (5.26) | 4.1 (3.22) | 5.2 (3.79) | 5.1 (3.87) | 6.4 (4.57) | 4.1 (3.28) |
Notes: LR = level of response to alcohol; LRB = low response–based education group; SOTA = state-of-the-art education group; control = no-videos education group.
Figure 2.
Maximum drinks over time with half standard error bars for 145 optimally ethnically matched pairs for low level of response (LR) (left) and high LR (right) subjects. LRB = LR-based education group; SOTA = state-of-the-art education group; CONT = control—no-videos education group; wk = week.
Finally, for maximum drinks, the data were evaluated to address Hypothesis 1 (outcomes would be better for the video groups vs. controls). Here, data from Table 2 were entered into an ANOVA for the 215 low and high LR pairs for those who were assigned to watch videos (the combined LRB plus SOTA conditions) versus controls. Across these two conditions, outcomes for the LR groups differed over time when race/ethnicity was considered (the four-way interaction: F = 4.01, p < .01, ηp2 = .03), with a trend for the three-way interaction (F = 2.91, p = .09, ηp2 = .01) collapsing across race/ethnicity. These results were similar for data in Table 3 when the analysis was limited to the 145 optimally ethnically matched pairs (four-way interaction: F = 5.71, p < .01, ηp2 = .04; three-way interaction: F = 3.25, p = .073, ηp2 = .01). In summary, differences were observed in maximum drinks over time for low and high LR subjects across these two education conditions (LRB plus SOTA vs. controls) but were more robust when ethnicity was considered.
Usual drinks over time
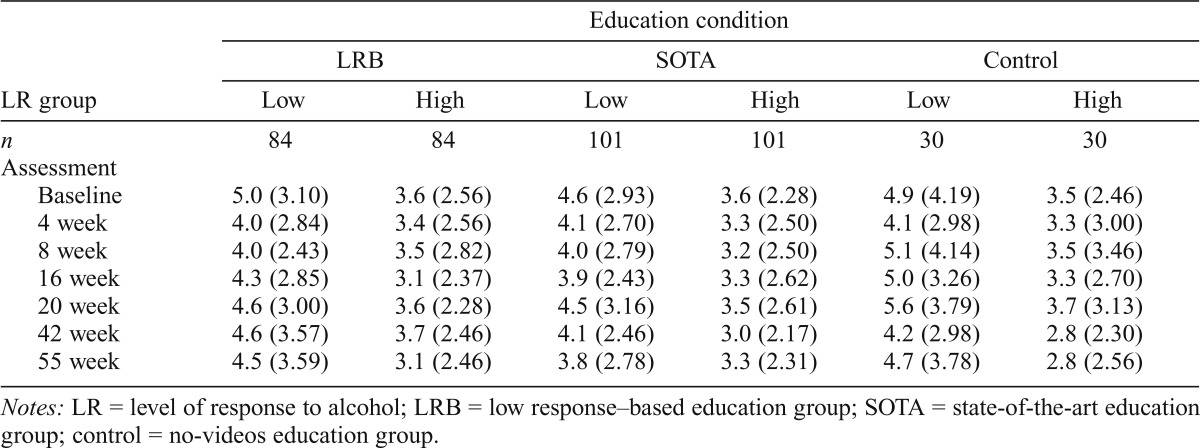
A series of similar analyses for usual drinks is presented in Table 4 (raw data) and Table 6 (ANOVA results). Beginning with the statistical analyses presented in the third data row of Table 6 (“Usual quantity” in the top half of the table) and graphically in Figure 3, patterns of usual drinks over time differed across education groups (LRB, SOTA, and controls) when the analysis was collapsed across race/ethnicity (threeway interactions) but not when ethnicity was included in the analysis (four-way interactions). Thus, for usual quantities, the outcomes for LR groups in the three education conditions differed in their usual drinks over time independent of the race/ethnicity backgrounds of the subjects.
Table 4.
Prior month usual quantities (raw data) across the seven assessments for 215 low and high LR pairs (430 subjects) in the three education conditions, M (SD)
| LR group | Education condition |
|||||
| LRB |
SOTA |
Control |
||||
| Low | High | Low | High | Low | High | |
| n | 84 | 84 | 101 | 101 | 30 | 30 |
| Assessment | ||||||
| Baseline | 5.0 (3.10) | 3.6 (2.56) | 4.6 (2.93) | 3.6 (2.28) | 4.9 (4.19) | 3.5 (2.46) |
| 4 week | 4.0 (2.84) | 3.4 (2.56) | 4.1 (2.70) | 3.3 (2.50) | 4.1 (2.98) | 3.3 (3.00) |
| 8 week | 4.0 (2.43) | 3.5 (2.82) | 4.0 (2.79) | 3.2 (2.50) | 5.1 (4.14) | 3.5 (3.46) |
| 16 week | 4.3 (2.85) | 3.1 (2.37) | 3.9 (2.43) | 3.3 (2.62) | 5.0 (3.26) | 3.3 (2.70) |
| 20 week | 4.6 (3.00) | 3.6 (2.28) | 4.5 (3.16) | 3.5 (2.61) | 5.6 (3.79) | 3.7 (3.13) |
| 42 week | 4.6 (3.57) | 3.7 (2.46) | 4.1 (2.46) | 3.0 (2.17) | 4.2 (2.98) | 2.8 (2.30) |
| 55 week | 4.5 (3.59) | 3.1 (2.46) | 3.8 (2.78) | 3.3 (2.31) | 4.7 (3.78) | 2.8 (2.56) |
Notes: LR = level of response to alcohol; LRB = low response–based education group; SOTA = state-of-the-art education group; control = no-videos education group.
Figure 3.
Usual drinks over time with half standard error bars for 215 matched pairs for low level of response (LR) (left) and high LR (right) subjects. LRB = LR-based education group; SOTA = state-of-the-art education group; CONT = control—no-videos education group; wk = week.
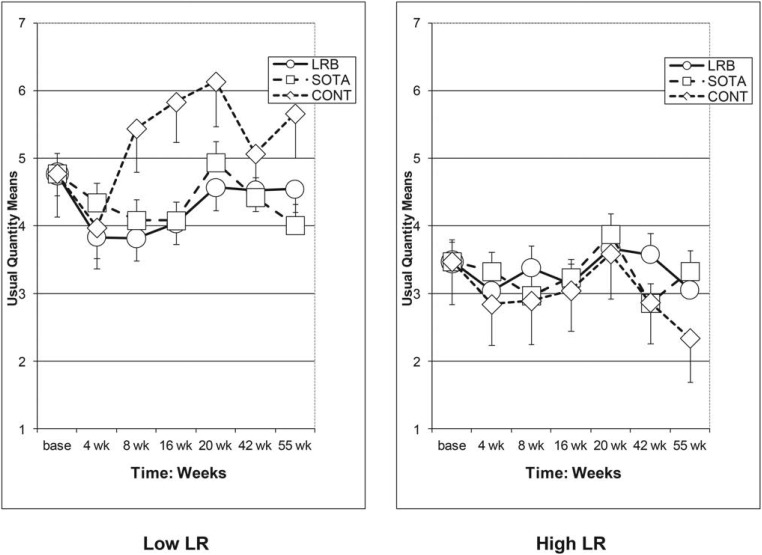
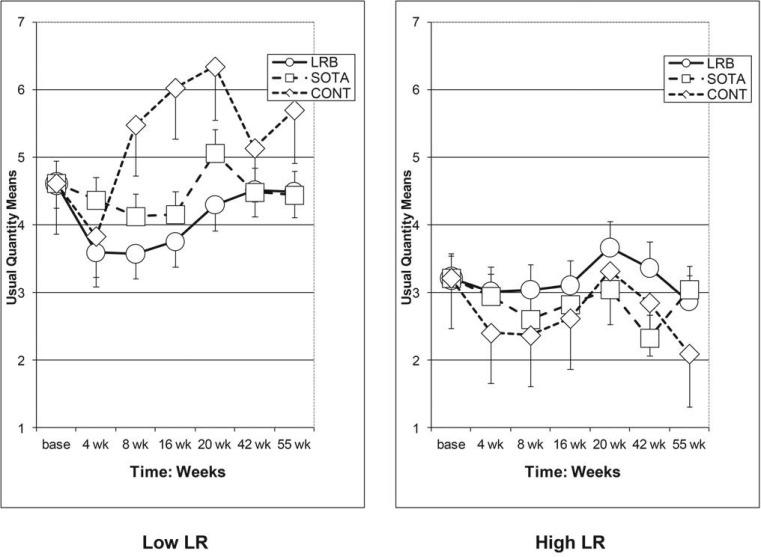
Inspection of Figures 3 and 4 indicates that results for usual drinks might be more robust for the low LR group, as was the case with maximum drinks. When analyses were restricted to the 215 low LRs, the outcomes over time differed across the LRB, SOTA, and control groups collapsing across race/ethnicity (the two-way interaction: F = 3.35, p < .05, ηp2 = .03) but not when race/ethnicity was included (the three-way interaction: F = 1.32, p = .25, ηp2 = .04). Within the 215 high LR subjects, neither the Education Condition × Race/Ethnicity × Time interaction nor the Education Condition × Time interaction was significant. In summary, for usual drinks over time, the changes for low LR subjects depended on the education condition to which they were assigned, but the same was not true for participants with high LR.
Figure 4.
Usual drinks over time with half standard error bars for 145 optimally ethnically matched pairs for low level of response (LR) (left) and high LR (right) subjects. LRB = LR-based education group; SOTA = state-of-the-art education group; CONT = control—no-videos education group; wk = week.
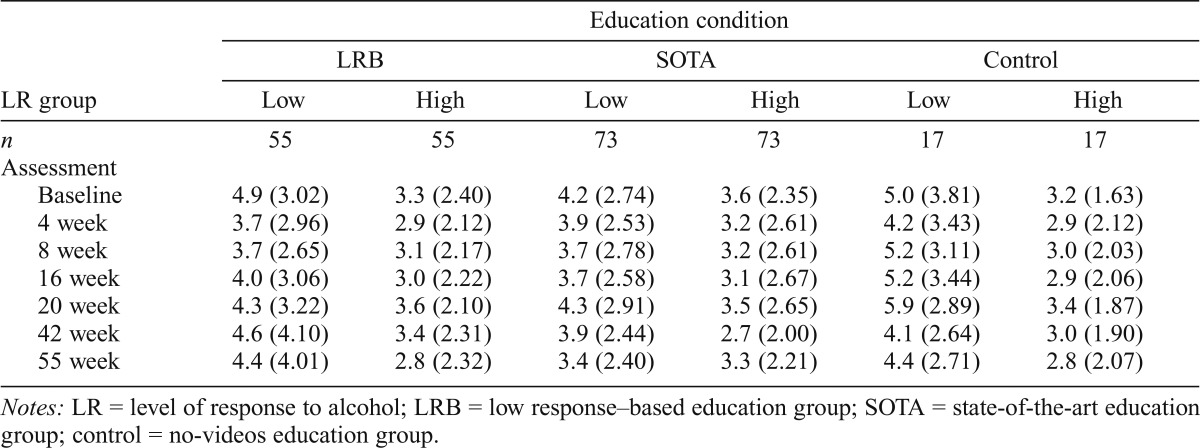
In Table 5, the lowest data line in Table 6 (“Usual quantity” in the lower half of the table), as well as Figure 4, data for usual quantities were restricted to the 145 optimally ethnically matched low and high LR pairs. As shown in Table 6, for the low and high LR groups, the usual drinks over time were different across the three education groups (three-way interaction), with a trend (p = .07) when race/ethnicity was included (four-way interaction). Once again, the way subjects changed usual drinks over time related to their LR status and education condition assignment and operated independently of race/ethnicity.
Table 5.
Prior month usual quantities (raw data) across the seven assessments for 145 optimally ethnically matched low and high LR pairs (290 subjects) in the three education conditions, M (SD)
| LR group | Education condition |
|||||
| LRB |
SOTA |
Control |
||||
| Low | High | Low | High | Low | High | |
| n | 55 | 55 | 73 | 73 | 17 | 17 |
| Assessment | ||||||
| Baseline | 4.9 (3.02) | 3.3 (2.40) | 4.2 (2.74) | 3.6 (2.35) | 5.0 (3.81) | 3.2 (1.63) |
| 4 week | 3.7 (2.96) | 2.9 (2.12) | 3.9 (2.53) | 3.2 (2.61) | 4.2 (3.43) | 2.9 (2.12) |
| 8 week | 3.7 (2.65) | 3.1 (2.17) | 3.7 (2.78) | 3.2 (2.61) | 5.2 (3.11) | 3.0 (2.03) |
| 16 week | 4.0 (3.06) | 3.0 (2.22) | 3.7 (2.58) | 3.1 (2.67) | 5.2 (3.44) | 2.9 (2.06) |
| 20 week | 4.3 (3.22) | 3.6 (2.10) | 4.3 (2.91) | 3.5 (2.65) | 5.9 (2.89) | 3.4 (1.87) |
| 42 week | 4.6 (4.10) | 3.4 (2.31) | 3.9 (2.44) | 2.7 (2.00) | 4.1 (2.64) | 3.0 (1.90) |
| 55 week | 4.4 (4.01) | 2.8 (2.32) | 3.4 (2.40) | 3.3 (2.21) | 4.4 (2.71) | 2.8 (2.07) |
Notes: LR = level of response to alcohol; LRB = low response–based education group; SOTA = state-of-the-art education group; control = no-videos education group.
Regarding Hypothesis 1 for usual quantities, using data from Table 4, the comparison of outcomes for the combined LRB and SOTA conditions versus the controls for the 215 pairs demonstrated a trend for a four-way interaction (F = 2.06, p = .10, ηp2 = .015) and a significant three-way interaction (F = 4.12, p < .05, ηp2 = .01). Using data from Table 5, for the 145 optimal ethnically matched pairs, the four-way interaction was significant (F = 3.80, p < .05, ηp2 = .03) and the three-way interaction was a trend (F = 3.43, p = .065, ηp2 = .01). Thus, although the better outcome associated with the combined education conditions was supported, it is not clear whether this outcome is independent of race/ethnicity.
Relative impacts of the LRB and SOTA conditions over the 55 weeks
The data in Tables 2–5 included controls, making it difficult to tell if differences between the LRB and SOTA conditions contributed to the results. To evaluate this, data regarding Hypotheses 2 and 3 were reevaluated after excluding controls. For maximum drinks, for the 185 matched pairs (N = 370), the four-way (F = 2.20, p = .09, ηp2 = .02) and three-way (F = 3.81, p = .052, ηp2 = .01) interactions were trends, indicating that when focusing only on subjects who watched videos, the low and high LR groups tended to differ over time across the LRB and SOTA groups regardless of their race/ethnicity. For the optimally ethnically matched 128 pairs (N = 256), the four-way interaction was not significant, but the three-way was (F = 7.07, p < .01, ηp2 = .03). Focusing on usual drinks for the 185 pairs, the four-way was a trend (F = 2.37, p = .07, ηp2 = .02) and the three-way was significant (F = 5.61, p < .05, ηp2 = .03), whereas for the 128 pairs, the four-way was not significant, but the three-way was (F = 7.55, p < .01, ηp2 = .03). In summary, after excluding controls, there was still evidence that outcomes for the low and high LR groups differed over time when race/ethnicity was not considered, in that three of the four three-way interactions were significant and the fourth was p = .052, but none of the four-way interactions was significant.
Inspection of the data in Tables 2–5 and Figures 1–4 indicates that the effect of the videos may have diminished in the final two time points (42 and 55 weeks), times when students had returned to school after the summer break. To evaluate how the drinking patterns may have changed from baseline to those final evaluations, the mixed-design ANOVA was repeated but now with data limited to the baseline and last two follow-ups. For the 215 low and high LR pairs across the three relevant time points, for maximum drinks both the four-way and three-way interactions were significant (F = 2.67, p < .05, ηp2 = .04, and F = 3.61, p < .05, ηp2 = .02, respectively). For usual drinks, the four-way interaction was a trend (F = 1.97, p = .07, ηp2 = .03), whereas the three-way interaction was significant (F = 3.88, p < .05, ηp2 = .02). When the optimally ethnically matched subset of 145 pairs was considered, the four-way interaction was significant for both maximum (F = 3.30, p < .05, ηp2 = .04) and usual (F = 2.56, p < .05, ηp2 = .04) drinks, whereas the three-way interaction was a trend for both (F = 2.80, p = .063, ηp2 = .02, and F = 2.72, p = .07, ηp2 =.02 respectively). Overall, these data indicate that the effect of the education groups on outcomes remained robust at 55 weeks, especially for maximum drinks.
Finally, the baseline requirement that participants are drinkers is likely to have excluded Asian individuals with severe flushing typical of ALDH 2-2 homozygotes. However, 21 Asian subjects reported mild to moderate alcohol-related flushing, raising the possibility that modest flush responses might have affected outcomes. Thus, all of the analyses in Tables 1 and 6 were reevaluated after excluding the 21 flushing Asians and their matched controls, with no loss of significance to the results reported above.
Discussion
This article reports results of a 55-week study of 500 university freshmen, more than 90% of whom completed the protocol. The goals were to modify well-established components of campus-based prevention programs often used to help students decrease heavy drinking (e.g., Borsari & Carey, 2001; Carey et al., 2007; Larimer & Cronce, 2007) in order to address a specific genetically influenced preexisting risk factor for excessive alcohol intake—the low LR to alcohol (Schuckit, 2014)—as well as to deliver the information on the internet. The latter is important because the internet has proven to be useful, effective, and relatively inexpensive in school-based prevention programs (Champion et al., 2013).
The data analyses were structured to address three hypotheses. Hypothesis 1 stated that students who viewed either of the two sets of educational videos would demonstrate lower drinking quantities on follow-up compared with controls. The results for maximum drinks indicated that the relationship of the combined video conditions versus the control condition to outcome was significant but depended on consideration of race/ethnicity. For usual drinks, the importance of race/ethnicity was less clear. Along with earlier results from this protocol (Schuckit et al., 2012, 2015), the findings underscore the potential beneficial impact of the videos overall. These educational videos are easy to deliver through the internet at little cost to a university and can be viewed by students whenever they have time.
As proposed in Hypothesis 2, the low LR participants demonstrated lower drinking quantities if they viewed LRB videos that emphasized their specific vulnerability. This finding was most robust for the optimally ethnically matched LR pairs (i.e., when analyses were limited to pairs where both low and high LRs were EA, Asian, or White Hispanic). The analyses of the full sample of 215 pairs demonstrated LR group outcome differences across the LRB, SOTA, and control education conditions over time for both maximum quantities (where in the four-way interaction outcome was dependent on consideration of ethnic groups) and for usual quantities. The support for Hypothesis 2 came from visual inspection of Figures 1–4, the finding that within the 215 low LR subjects both the Education Condition × Race/Ethnicity × Time and the Education Condition × Time interactions were significant, and by documenting that the LR group differences remained robust after excluding controls.
There was less support for Hypothesis 3, predicting that students with high LRs would do best with the more generic SOTA protocol that did not emphasize any single vulnerability. Here, visual inspection of Figures 1–4 revealed limited evidence that the outcomes for subjects with high LR differed across education conditions, and that within the 215 high responders neither three-way nor four-way interactions were significant for either maximum or usual drinks. The mostly negative conclusion for Hypothesis 3 is not consistent with two prior reports from our laboratory (Schuckit et al., 2012, 2015). Both previous studies were limited to outcomes at 8 weeks, whereas the current analyses were carried out over 55 weeks. Thus, there may have been a short-lived preferential effect for high LR subjects in the SOTA approach that faded after the first 2 months. It is also possible that, for high LR subjects, the education group assignment was not as important as it was for low LRs, perhaps in part because the students with high LR were less likely to escalate drinking and, thus, had less room for improvement. More research is needed to determine the optimal approach for the higher LR students.
In a similar vein, it is important to observe the substantial increase in both maximum and usual drinks over time for the low LR controls. The vulnerability toward heavier drinking for individuals with a low LR is consistent with prior longitudinal studies in the United States and the United Kingdom (e.g., Schuckit et al., 2011a, 2011b) and underscores the importance of recognizing this predisposition early in the drinking career and offering education. Until more effective or less costly interventions are found, the prevention protocol presented here may also be worth considering in environments with high numbers of young drinkers, especially at times of transition in their lives in which heavy drinking might be most likely to develop. Although further research is needed, the low cost, easy implementation, and potential effectiveness of these educational videos support the potential usefulness of this approach for military recruits, high school students, and perhaps students already recognized as having alcohol problems.
The current data, along with prior research (Conrod et al., 2010, 2013; Newton et al., 2012), indicate that predisposition-based preventions may have long-lasting effects. Although visual inspection of Figures 1–4 indicates potentially more robust effects for low LR subjects during the first 5 months, significant differences from baseline were still observed at 42 and 55 weeks. Also, low LRs in the video groups did not demonstrate the same increased drinking quantities as low LR controls. Summer break occurred during the interval between 20 weeks and 42 weeks, and the apparent diminution of the impact of educational conditions may indicate that it would have been useful to offer additional education when students returned to school, perhaps using a booster module that reviewed major points made in the initial videos.
The sharp rise in maximum drinks for low LR subjects at 20-weeks is worth comment. The month before the 20-week assessment was the time of a university festivity said to be characterized by heavy drinking among students. That our assessments indicated an uptick in drinking at that time supports the potential accuracy of the survey methods used. That this increase in drinking was most apparent for low LR students supports the greater risk for heavier drinking in individuals with lower alcohol sensitivity. The greater increase in maximum drinks for low LR controls compared with those who viewed videos is consistent with the beneficial outcomes associated with the video modules.
The prominent role of ethnicity in these analyses is also noteworthy. In a prior report (Schuckit et al., 2015), the apparent greater variance in outcomes associated with matching subjects within the “other ethnicity category” without more specific racial/ethnic assignment, along with our unfortunate decision to occasionally match EA subjects with White Hispanic individuals, might have contributed to less robust statistical significance for outcomes. Thus, in a manner similar to the 8-week analysis (Schuckit et al., 2015), this article presented separate results for the entire sample and for the optimally ethnically matched subjects. Future work is needed to more closely evaluate how the results of prevention protocols may differ by the subjects’ racial and ethnic characteristics.
There are several assets to this work, including the high rate of subject compliance with the videos (Schuckit et al., 2015), the high rate of follow-up, the use of the same teacher and similar teaching styles in the LRB and SOTA videos, and the cost-efficient delivery via the Internet. However, there are important caveats that should be considered in interpreting our findings. First, the subjects were all students at one university, and although the racial/ethnic distributions of our subjects were similar to this university overall, the generalizability of the findings to other groups needs to be established. Plans are being made to evaluate the outcomes when similar methods are used for subjects recruited from Facebook and for evaluations in students mandated for education because of problematic alcohol-related behavior. Second, in a similar vein, the approach described here should be evaluated among younger students at a time closer to the onset of drinking in high school and considered for other young populations entering a time of transition (e.g., entering the military). Third, the protocol offered a form of personalized feedback to participants, but the approach might benefit from a greater degree of personalization of the message, perhaps through computer-generated feedback explaining whether the answers to questions posed in the videos were correct and information on why. The emphasis on maintaining low cost for the current approach made implementation of such an approach difficult.
In summary, the data presented here demonstrate the potential benefits of targeting a person’s specific preexisting vulnerability toward heavy drinking when he or she enters college in an effort to decrease alcohol intake. The protocol can be delivered at relatively low cost through the Internet.
Footnotes
This work was supported by National Institute on Alcohol Abuse and Alcoholism Grants 1 R01 AA021162 and 5 T32 AA013525.
References
- Abbey A., Wegner R., Woerner J., Pegram S. E., Pierce J. Review of survey and experimental research that examines the relationship between alcohol consumption and men’s sexual aggression perpetration. Trauma, Violence & Abuse. 2014;15:265–282. doi: 10.1177/1524838014521031. doi:10.1177/1524838014521031. [DOI] [PMC free article] [PubMed] [Google Scholar]
- American Psychiatric Association. Diagnostic and statistical manual of mental disorders. 4th ed. Washington, DC: Author; 1994. [Google Scholar]
- Barnett N. P., Clerkin E. M., Wood M., Monti P. M., O’Leary Tevyaw T., Corriveau D., Kahler C. W. Description and predictors of positive and negative alcohol-related consequences in the first year of college. Journal of Studies on Alcohol and Drugs. 2014;75:103–114. doi: 10.15288/jsad.2014.75.103. doi:10.15288/jsad.2014.75.103. [DOI] [PMC free article] [PubMed] [Google Scholar]
- Borsari B., Carey K. B. Peer influences on college drinking: A review of the research. Journal of Substance Abuse. 2001;13:391–424. doi: 10.1016/s0899-3289(01)00098-0. doi:10.1016/S0899-3289(01)00098-0. [DOI] [PubMed] [Google Scholar]
- Borsari B., Carey K. B. Descriptive and injunctive norms in college drinking: A meta-analytic integration. Journal of Studies on Alcohol. 2003;64:331–341. doi: 10.15288/jsa.2003.64.331. doi:10.15288/jsa.2003.64.331. [DOI] [PMC free article] [PubMed] [Google Scholar]
- Bucholz K. K., Cadoret R., Cloninger C. R., Dinwiddie S. H., Hesselbrock V. M., Nurnberger J. I., Jr., Schuckit M. A. A new, semi-structured psychiatric interview for use in genetic linkage studies: A report on the reliability of the SSAGA. Journal of Studies on Alcohol. 1994;55:149–158. doi: 10.15288/jsa.1994.55.149. doi:10.15288/jsa.1994.55.149. [DOI] [PubMed] [Google Scholar]
- Carey K. B., Scott-Sheldon L. A., Carey M. P., DeMartini K. S. Individual-level interventions to reduce college student drinking: A meta-analytic review. Addictive Behaviors. 2007;32:2469–2494. doi: 10.1016/j.addbeh.2007.05.004. doi:10.1016/j.addbeh.2007.05.004. [DOI] [PMC free article] [PubMed] [Google Scholar]
- Champion K. E., Newton N. C., Barrett E. L., Teesson M. A systematic review of school-based alcohol and other drug prevention programs facilitated by computers or the internet. Drug and Alcohol Review. 2013;32:115–123. doi: 10.1111/j.1465-3362.2012.00517.x. doi:10.1111/j.1465-3362.2012.00517.x. [DOI] [PubMed] [Google Scholar]
- Conrod P. J., Castellanos-Ryan N., Strang J. Brief, personality-targeted coping skills interventions and survival as a non-drug user over a 2-year period during adolescence. Archives of General Psychiatry. 2010;67:85–93. doi: 10.1001/archgenpsychiatry.2009.173. doi:10.1001/archgenpsychiatry.2009.173. [DOI] [PubMed] [Google Scholar]
- Conrod P. J., O’Leary-Barrett M., Newton N., Topper L., Castellanos-Ryan N., Mackie C., Girard A. Effectiveness of a selective, personality-targeted prevention program for adolescent alcohol use and misuse: A cluster randomized controlled trial. JAMA Psychiatry. 2013;70:334–342. doi: 10.1001/jamapsychiatry.2013.651. doi:10.1001/jamapsychiatry.2013.651. [DOI] [PubMed] [Google Scholar]
- Cronce J. M., Larimer M. E. Individual-focused approaches to the prevention of college student drinking. Alcohol Research & Health. 2011;34:210–221. [PMC free article] [PubMed] [Google Scholar]
- Ehlers C. L., Phillips E., Schuckit M. A. EEG alpha variants and alpha power in Hispanic American and white non-Hispanic American young adults with a family history of alcohol dependence. Alcohol. 2004;33:99–106. doi: 10.1016/j.alcohol.2004.05.003. doi:10.1016/S0741-8329(04)00098-9. [DOI] [PubMed] [Google Scholar]
- Eng M. Y., Luczak S. E., Wall T. L. ALDH2, ADH1B, and ADH1C genotypes in Asians: A literature review. Alcohol Research & Health. 2007;30:22–27. [PMC free article] [PubMed] [Google Scholar]
- Faden V. B. Trends in initiation of alcohol use in the United States 1975 to 2003. Alcoholism: Clinical and Experimental Research. 2006;30:1011–1022. doi: 10.1111/j.1530-0277.2006.00115.x. doi:10.1111/j.1530-0277.2006.00115.x. [DOI] [PubMed] [Google Scholar]
- Fromme K., Corbin W. R., Kruse M. I. Behavioral risks during the transition from high school to college. Developmental Psychology. 2008;44:1497–1504. doi: 10.1037/a0012614. doi:10.1037/a0012614. [DOI] [PMC free article] [PubMed] [Google Scholar]
- Fromme K., D’Amico E. J. Measuring adolescent alcohol outcome expectancies. Psychology of Addictive Behaviors. 2000;14:206–212. doi: 10.1037//0893-164x.14.2.206. doi:10.1037/0893-164X.14.2.206. [DOI] [PubMed] [Google Scholar]
- Hesselbrock M., Easton C., Bucholz K. K., Schuckit M., Hesselbrock V. A validity study of the SSAGA—A comparison with the SCAN. Addiction. 1999;94:1361–1370. doi: 10.1046/j.1360-0443.1999.94913618.x. doi:10.1046/j.1360-0443.1999.94913618.x. [DOI] [PubMed] [Google Scholar]
- Hingson R. W., Zha W., Weitzman E. R. Magnitude of and trends in alcohol-related mortality and morbidity among U.S. college students ages 18-24, 1998-2005. Journal of Studies on Alcohol and Drugs, Supplement. 2009;16:12–20. doi: 10.15288/jsads.2009.s16.12. doi:10.15288/jsads.2009.s16.12. [DOI] [PMC free article] [PubMed] [Google Scholar]
- Johnston L. D., O’Malley P. M., Bachman J. G., Schulenberg J. E. Monitoring the Future national results on adolescent drug use: Overview of key findings, 2014. Ann Arbor, MI: Institute for Social Research, The University of Michigan; 2015. [Google Scholar]
- Kessler R. C., Berglund P., Demler O., Jin R., Merikangas K. R., Walters E. E. Lifetime prevalence and age-of-onset distributions of DSM-IV disorders in the National Comorbidity Survey Replication. Archives of General Psychiatry. 2005;62:593–602. doi: 10.1001/archpsyc.62.6.593. doi:10.1001/archpsyc.62.6.593. [DOI] [PubMed] [Google Scholar]
- King K. M., Chassin L. Adolescent stressors, psychopathology, and young adult substance dependence: A prospective study. Journal of Studies on Alcohol and Drugs. 2008;69:629–638. doi: 10.15288/jsad.2008.69.629. doi:10.15288/jsad.2008.69.629. [DOI] [PMC free article] [PubMed] [Google Scholar]
- King A. C., McNamara P. J., Hasin D. S., Cao D. Alcohol challenge responses predict future alcohol use disorder symptoms: A 6-year prospective study. Biological Psychiatry. 2014;75:798–806. doi: 10.1016/j.biopsych.2013.08.001. doi:10.1016/j.biopsych.2013.08.001. [DOI] [PMC free article] [PubMed] [Google Scholar]
- Larimer M. E., Cronce J. M. Identification, prevention, and treatment revisited: Individual-focused college drinking prevention strategies 1999-2006. Addictive Behaviors. 2007;32:2439–2468. doi: 10.1016/j.addbeh.2007.05.006. doi:10.1016/j.addbeh.2007.05.006. [DOI] [PubMed] [Google Scholar]
- Lundin A., Mortensen L. H., Halldin J., Theobald H. The relationship of alcoholism and alcohol consumption to all-cause mortality in forty-one-year follow-up of the Swedish REBUS sample. Journal of Studies on Alcohol and Drugs. 2015;76:544–551. doi: 10.15288/jsad.2015.76.544. doi:10.15288/jsad.2015.76.544. [DOI] [PubMed] [Google Scholar]
- Mallett K. A., Varvil-Weld L., Borsari B., Read J. P., Neighbors C., White H. R. An update of research examining college student alcohol-related consequences: New perspectives and implications for interventions. Alcoholism: Clinical and Experimental Research. 2013;37:709–716. doi: 10.1111/acer.12031. doi:10.1111/acer.12031. [DOI] [PMC free article] [PubMed] [Google Scholar]
- Miller M. B., Meier E., Lombardi N., Leffingwell T. R. Theories of behaviour change and personalised feedback interventions for college student drinking. Addiction Research & Theory. 2015;23:322–335. doi:10.3109/16066359.2014.1001840. [Google Scholar]
- Neighbors C., Lee C. M., Lewis M. A., Fossos N., Larimer M. E. Are social norms the best predictor of outcomes among heavydrinking college students? Journal of Studies on Alcohol and Drugs. 2007;68:556–565. doi: 10.15288/jsad.2007.68.556. doi:10.15288/jsad.2007.68.556. [DOI] [PMC free article] [PubMed] [Google Scholar]
- Newlin D. B., Renton R. M. High risk groups often have higher levels of alcohol response than low risk: The other side of the coin. Alcoholism: Clinical and Experimental Research. 2010;34:199–202. doi: 10.1111/j.1530-0277.2009.01081.x. author reply 203–205. doi:10.1111/j.1530-0277.2009.01081.x. [DOI] [PubMed] [Google Scholar]
- Newton N. C., Teesson M., Barrett E. L., Slade T., Conrod P. J. The CAP study, evaluation of integrated universal and selective prevention strategies for youth alcohol misuse: Study protocol of a cluster randomized controlled trial. BMC Psychiatry. 2012;12:118–127. doi: 10.1186/1471-244X-12-118. doi:10.1186/1471-244X-12-118. [DOI] [PMC free article] [PubMed] [Google Scholar]
- Patrick M. E., Wray-Lake L., Finlay A. K., Maggs J. L. The long arm of expectancies: Adolescent alcohol expectancies predict adult alcohol use. Alcohol and Alcoholism. 2010;45:17–24. doi: 10.1093/alcalc/agp066. doi:10.1093/alcalc/agp066. [DOI] [PMC free article] [PubMed] [Google Scholar]
- Pedersen S. L., McCarthy D. M. Differences in acute response to alcohol between African Americans and European Americans. Alcoholism: Clinical and Experimental Research. 2013;37:1056–1063. doi: 10.1111/acer.12068. doi:10.1111/acer.12068. [DOI] [PMC free article] [PubMed] [Google Scholar]
- Ray L. A., Audette A., DiCristoforo S., Odell K., Kaiser A., Hutchison K. E. Behavioral, laboratory, and genetic correlates of low level of response to alcohol [Abstract 490] Alcoholism: Clinical and Experimental Research. 2007;31(Supplement S2):131A. [Google Scholar]
- Schuckit M. A. A brief history of research on the genetics of alcohol and other drug use disorders. Journal of Studies on Alcohol and Drugs, Supplement. 2014;17:59–67. doi: 10.15288/jsads.2014.s17.59. doi:10.15288/jsads.2014.75.59. [DOI] [PMC free article] [PubMed] [Google Scholar]
- Schuckit M. A., Kalmijn J. A., Smith T. L., Saunders G., Fromme K. Structuring a college alcohol prevention program on the low level of response to alcohol model: A pilot study. Alcoholism: Clinical and Experimental Research. 2012;36:1244–1252. doi: 10.1111/j.1530-0277.2011.01723.x. doi:10.1111/j.1530-0277.2011.01723.x. [DOI] [PubMed] [Google Scholar]
- Schuckit M. A., Smith T. L., Heron J., Hickman M., Macleod J., Lewis G., Davey-Smith G. Testing a level of response to alcohol-based model of heavy drinking and alcohol problems in 1,905 17-year-olds. Alcoholism: Clinical and Experimental Research. 2011a;35:1897–1904. doi: 10.1111/j.1530-0277.2011.01536.x. doi:10.1111/j.1530-0277.2011.01536.x. [DOI] [PMC free article] [PubMed] [Google Scholar]
- Schuckit M. A., Smith T. L., Kalmijn J., Skidmore J., Clausen P., Shafir A., Fromme K. The impact of focusing a program to prevent heavier drinking on a pre-existing phenotype, the low level of response to alcohol. Alcoholism: Clinical and Experimental Research. 2015;39:308–316. doi: 10.1111/acer.12620. doi:10.1111/acer.12620. [DOI] [PMC free article] [PubMed] [Google Scholar]
- Schuckit M. A., Smith T. L., Tipp J. E. The Self-Rating of the Effects of alcohol (SRE) form as a retrospective measure of the risk for alcoholism. Addiction. 1997;92:979–988. doi:10.1111/j.1360-0443.1997.tb02977.x. [PubMed] [Google Scholar]
- Schuckit M. A., Smith T. L., Trim R. S., Allen R. C., Fukukura T., Knight E. E., Kreikebaum S. A. A prospective evaluation of how a low level of response to alcohol predicts later heavy drinking and alcohol problems. American Journal of Drug and Alcohol Abuse: Encompassing All Addictive Disorders. 2011b;37:479–486. doi: 10.3109/00952990.2011.598590. doi:10.3109/00952990.2011.598590. [DOI] [PubMed] [Google Scholar]
- Testa M., Parks K. A., Hoffman J. H., Crane C. A., Leonard K. E., Shyhalla K. Do drinking episodes contribute to sexual aggression perpetration in college men? Journal of Studies on Alcohol and Drugs. 2015;76:507–515. doi: 10.15288/jsad.2015.76.507. doi:10.15288/jsad.2015.76.507. [DOI] [PMC free article] [PubMed] [Google Scholar]
- Veenstra M. Y., Lemmens P. H., Friesema I. H., Tan F. E., Garretsen H. F., Knottnerus J. A., Zwietering P. J. Coping style mediates impact of stress on alcohol use: A prospective population-based study. Addiction. 2007;102:1890–1898. doi: 10.1111/j.1360-0443.2007.02026.x. doi:10.1111/j.1360-0443.2007.02026.x. [DOI] [PubMed] [Google Scholar]


