Abstract
Producing stable nanocrystals confined to porous excipient media is a desirable way to increase the dissolution rate and improve the bioavailability of poorly water soluble pharmaceuticals. The poorly soluble pharmaceutical fenofibrate was crystallized in controlled pore glass (CPG) of 10 different pore sizes between 12 nm and 300 nm. High drug loadings of greater than 20 wt% were achieved across all pore sizes greater than 20 nm. Nanocrystalline fenofibrate was formed in pore sizes greater than 20 nm and showed characteristic melting point depressions following a Gibbs-Thomson relationship as well as enhanced dissolution rates. Solid-state Nuclear Magnetic Resonance (NMR) was employed to characterize the crystallinity of the confined molecules. These results help to advance the fundamental understanding of nanocrystallization in confined pores.
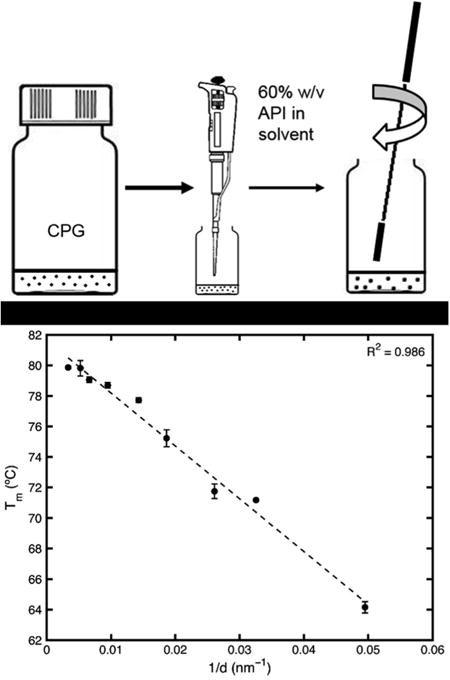
Graphical abstract
1 Introduction
Pharmaceutical nanocrystals have been targeted as a solution for improving the bioavailability of poorly water soluble pharmaceuticals [1] [2]. Nanocrystals have an increased surface area to volume ratio compared to their bulk crystal counterparts and can increase dissolution rate according to the Noyes-Whitney equation [3] and enhance permeability [4]. It has also been shown that the solubility increases with decreasing particle size below a cut-off size of 1-2 μm [5]. It is desirable to produce nanocrystals directly without resorting to other processing steps such as milling to achieve nanocrystal size while also controlling the polymorphism of the crystal [6].
Several bottom-up methods to produce nanocrystals of a given size in reproducible polymorphs exist. These include the “hydrosol” method [5], freeze-drying [6], supercritical fluid methods [7] [8], cryogenic spray processes [9], and evaporative precipitation into aqueous solution [10] [11]. These processes often produce amorphous material or an undesired polymorphic form. In addition, control of size distribution and can be difficult to scale up. They can be plagued with low production rates and typically do not achieve particle sizes below 100 nm [1] [6] [12] [13].
Alternative approaches for producing stable pharmaceutical nanocrystals employ the bottom-up approach of conducting the crystallization in confinement. Ordered mesoporous silica [14] [15] [16] [17] [18] [19] [20] [21], controlled pore glass (CPG) [22] [23], porous polycyclohexylethylene and polystyrene (p-PCHE) [22] [24], nanostructured lipid carriers [25], fumed silica [26], and solutions of active pharmaceutical ingredients (APIs) in electrospun materials [27] have all been used to confine APIs to small volumes [28]. Confining crystals to porous matrices of known size addresses the issue of particle size distributions, and has been proposed to lead to higher polymorph control through regulation of nucleation [29] as well as the stabilization of otherwise metastable polymorphs [30]. Producing confined nanocrystals has also been proposed as a way to better understand fundamentals of polymorph formation, due to the unique surface energy effects of the confined systems [31].
Ha et al. [22] have found a Gibbs-Thomson like relationship between melting point depression and crystal size in crystals confined to CPG and p-PCHE. They found size-dependent polymorphism and the potential for polymorph discovery with varying pore size, making particular note of the interplay between surface energy and volume free energy at the nanoscale. Three pore sizes of CPG and one size of p-PCHE monolith were studied.
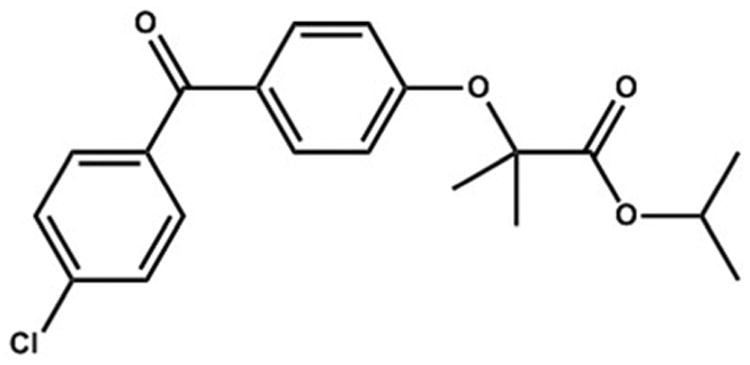
This work aims to explore the crystallization of APIs in rigid nanoporous media over a broad range of pore sizes, which is lacking in existing studies, allowing a fundamental understanding of the relationship between pore size, crystallinity and bioavailability. The API fenofibrate (shown in Fig. 1), which is known in two polymorphic forms, was crystallized over a range of pore sizes (10 different pore sizes between 12 and 300 nm) of CPG. The drug loadings were determined with thermogravimetric analysis (TGA) and the nanocrystal melting points and enthalpies of fusion were studied with differential scanning calorimetry (DSC). Crystallinity was assessed with X-ray powder diffraction (XRPD), while both polymorphism and degree of crystallinity was studied using solid-state nuclear magnetic resonance (ssNMR). It is the intent that the porous matrices used be biocompatible excipient media, such that a formulation of the nanocrystalline API could conceivably be as simple as encapsulated API-loaded matrix.
Fig. 1. Organic molecule of interest, fenofibrate (FEN) for API loading in porous silica used for this study.
2 Experimental section
2.1 Materials
Fenofibrate (FEN) was obtained from Xian Shunyi Bio-chemical Technology Company. Silicon dioxide (silica) particles of varying pore sizes were obtained from three sources. Controlled pore glass (CPG) was obtained from Millipore in pore sizes of 300 nm and 70 nm. CPG was also obtained from Prime Synthesis in pore sizes of 191.4, 151.5, 105.5, 53.7, 38.3, 30.7, 20.2, and 12.7 nm.
2.2 Experimental Apparatus
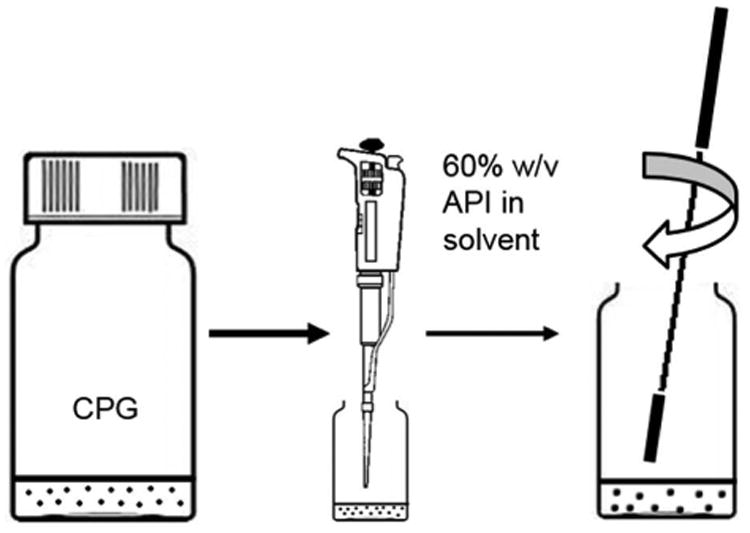
Experimental setup is shown in Fig. 2: (1) A small amount (∼ 0.25 g) of CPG was placed in a 20 mL scintillation vial, resulting in a CPG bed height of about 0.3 cm and a top surface area of ∼ 3.1 cm2. For this study, the preparation of 0.25 g of CPG to be loaded with drug was plenty for analytical purposes. (2) The pore volume present in the entire CPG sample was then calculated based on the given pore volume/gram CPG. A 60% weight/volume solution of fenofibrate in ethyl acetate was prepared. API solution in equal amount to the pore volume present in the CPG was then micropipetted over the surface of the CPG in the scintillation vial as uniformly as possible. (3) Immediately after pipetting, a metal spatula was used to stir the mixture, to wet as much of the CPG as possible, ceasing only when the mixture appeared dry. The drug-loaded CPG was then left in a fume hood for an additional 24 hrs to continue evaporation of excess solvent. It is noteworthy that no wash step was required in this method. Samples were prepared in triplicate for each pore size.
Fig. 2. Loading procedure to impregnate porous silica particles with API solution.
2.3 X-Ray Powder Diffraction Analysis
X-Ray powder diffraction (XRPD) was performed on all samples using a PANalytical X'Pert PRO diffractometer at 45 kV with an anode current of 40 mA. The instrument has a PW3050/60 standard resolution goniometer and a PW3373/10 Cu LFF DK241245 X-ray tube. Samples were placed on a spinner stage in reflection mode. Settings on the incident beam path included: soller slit 0.04 rad, mask fixed 10 mm, programmable divergence slit and fixed 1° anti-scatter slit. Settings on the diffracted beam path include: soller slit 0.04 rad and programmable anti-scatter slit. The scan was set as a continuous scan: 2θ angle between 4 and 40 °, step size .0167113 ° and a time per step of 31.115 s.
2.4 Differential Scanning Calorimetry Analysis
A Q2000 instrument from TA instruments was utilized for the differential scanning calorimetry (DSC) analysis. Inert atmosphere environment was maintained in the sample chamber using a nitrogen gas cylinder set to a flow rate of 50 ml/min. An extra refrigerated cooling system (RCS 40, TA instruments) was used to broaden the available temperature range between 40 and 400 °C. Tzero ® pans and lids were used with ∼5 mg of sample. A heating rate of 10 °C/min was applied and the samples were scanned from -20 to 180 °C. When determining the enthalpy of fusion for a given sample, the DSC curve was integrated for 30 °C centered on the melting temperature of each pore size to capture the entire melting event.
2.5 Thermogravimetric Analysis
Thermogravimetric analysis (TGA) was performed on a Q500 instrument from TA instruments connected with a nitrogen gas cylinder to maintain a flow rate of 25 mL/min to keep the sample chamber under an inert gas environment. Between 5 and 10 mg of sample were loaded on platinum sample pans from TA instruments. The samples were allowed to equilibrate at 30 °C and then heated at 10 °C/min to 300 °C.
2.6 Solid-state Nuclear Magnetic Resonance Spectroscopy
Solid-state nuclear magnetic resonance experiments were conducted on a homebuilt 500 MHz spectrometer (D. Ruben, Francis Bitter Magnet Laboratory (FBML), Massachusetts Institute of Technology). Prepared samples were packed into Revolution NMR (Fort Collins, USA) 4 mm o.d. (60 ul fill volume) ZrO2 rotors, equipped with Vespel drive and top caps. Spectra were acquired on a 4 mm Chemagnetics triple resonance (1H/13C/15N) magic-angle spinning (MAS) probe. 13C natural abundant spectra were acquired using cross-polarization (CP) [32], a recycle delay of 3 seconds, between 16,384 and 65,536 co-added transients and a spinning frequency of 9,000 ± 3 Hz. The Hartman-Hahn match condition was optimized by setting 1H to 50 kHz (γB1/2π), a positive ramp contact pulse for 13C (centered at 58 kHz) and a contact time of 1.5 ms. All data were acquired using two-pulse phase-modulated, TPPM [33] 1H decoupling (100 kHz, 1H γB1/2π). The magic-angle was adjusted using potassium bromide (KBr) at a spinning frequency of 5 kHz, (rotational echoes > 11.5 ms). 13C spectra were referenced (and shimmed, FWHM = 4 Hz) using solid adamantane to 40.49 ppm (high frequency resonance) with respect to DSS (0 ppm).
2.7 Dissolution test
The dissolution tests were designed following USP standards. Analysis of the percentage of dissolved API was done using built-in ultraviolet-visible spectroscopy at 286 nm. The dissolution buffer used was .025 M sodium dodecyl sulfate solution (7.21 grams of powdered SDS (Sigma Aldrich) was dissolved and brought up to 1000 mL in water). The dissolution profile of the sample was determined using USP Dissolution Apparatus 2 at 37 °C. The apparatus operated at 75 RPM. 900 mL of the buffer solution was allowed to reach the equilibrium temperature before sample was placed in the apparatus. Enough sample of API-loaded CPG was added such that the targeted concentration of fenofibrate in solution was 15 μg/mL, within the expected linear range [34]. Samples of both uncrushed and crushed bulk fenofibrate were analyzed as comparison. Samples were acquired for about 29 hours.
3 Results and discussion
Fenofibrate was selected as a model API to work with in preliminary studies. It is poorly water soluble, < 1 mg/mL at 37 °C [35], and has two known polymorphs, crystalline form I with a melting point around 80 °C and a metastable form II with a melting point around 73 °C [36] [37]. The metastable form has been collected in a sample of amorphous fenofibrate that was heated to around 40°C [36]. Fenofibrate was chosen for initial studies due to its lack of multiple stable polymorphs; it is advantageous to first study how a single polymorph changes with varying crystal size. Table 1 summarizes the sizes of CPG used and the pore volumes as provided by the supplier.
Table 1. Pore sizes, surface areas, and volumes of porous silica used in the study as provided by producer.
| Pore Size (nm) | Pore Volume (cc/gram) | Surface Area (m2/gram) | Producer |
|---|---|---|---|
| 300 | 1.21 | 10 | Millipore |
| 191.4 | 1.5 | 30 | Prime Synthesis |
| 151.5 | 1.2 | 31 | Prime Synthesis |
| 105.5 | 1.4 | 52 | Prime Synthesis |
| 70 | 1.22 | 43 | Millipore |
| 53.7 | 1.3 | 94 | Prime Synthesis |
| 38.3 | 1.3 | 138 | Prime Synthesis |
| 30.7 | 1.11 | 145 | Prime Synthesis |
| 20.2 | 1.12 | 219 | Prime Synthesis |
| 12.7 | 0.5 | 137 | Prime Synthesis |
All loading data, melting points, and polymorph observations via XRPD and ssNMR are summarized in Table 2. High drug loadings were achieved via the method of applying the pore volume of drug solution. In the XRPD samples, there is a large amorphous feature which disrupts the baseline (to be subtracted) due to the amorphous silica matrix which makes up the bulk of the sample. NMR is isotope selective and invariant to the substrate that the API is placed upon offering an approach to probe the degree of crystallinity and identify polymorphs easily using 13C CP MAS NMR. Overall drug loading is reasonably well correlated to both pore volume and mean pore size but appears more closely dependent on the nominal pore size.
Table 2. Fenofibrate loaded in porous silica particles.
| Pore size (nm) | FEN mass loaded (wt %) | Melting point by DSC (°C) | Polymorph by XRPD | Polymorph by ssNMR |
|---|---|---|---|---|
| 300 | 29.4±1.2 | 79.9±0.1 | Form I | Form I |
| 191.4 | 40.0±2.0 | 79.8±0.5 | Form I | Form I |
| 151.5 | 31.5±1.0 | 79.0±0.2 | Form I | Form I |
| 105.5 | 35.7±0.5 | 78.7±0.2 | Form I | Form I |
| 70 | 28.1±0.4 | 77.7±0.2 | Form I | Form I |
| 53.7 | 33.4±0.4 | 75.2±0.6 | Form I | Form I |
| 38.3 | 29.4±0.4 | 71.8±0.5 | Form I | Form I |
| 30.7 | 29.4±0.7 | 71.2±0.1 | Form I | Form I |
| 20.2 | 26.2±0.8 | 64.2±0.4 | Form I | Form I |
| 12.7 | 16.3±0.6 | N/A | Amorphous | Amorphous/Form I |
Fenofibrate in 20 to 300 nm CPG illustrated clean 13C spectra with high crystalline API formation. DSC and XRPD data indicated an inability to crystallize fenofibrate in the 12 nm CPG, suggesting an amorphous form (vide infra). In examining the literature, it has been reported that the pore diameter should be at least 20 times the molecular diameter for crystallization in confined spaces [38]. Fenofibrate has an estimated molecular size of 0.98-1.27 nm [34]. It is hypothesized that this is the reason why the 12 nm CPG showed no crystalline fenofibrate in the powder x-ray diffraction results, as it is less than 20 times the diameter of fenofibrate. Ha et al. found an similar size limit to crystalline versus amorphous stability in porous matrices, noting that crystallization of the compound ROY was supressed in 20 nm pores as compared to 30 nm pores when carried out either by evaporation or by melting/cooling [23]. We postulate that under slow crystallization conditions, crystals could be formed in pore sizes under 20 times the molecular diameter, which would explain the combination of broadened (i.e., amorphous phase) and narrow (i.e., crystalline) 13C resonance observed in the 12 nm sample (Supp. Info. Figure SIVa).
A major challenge in this work was to produce crystals which are successfully loaded in the porous matrix, rather than on the external surfaces. DSC was used to determine if surface crystals were present; in cases where both nanocrystals and surface crystals were formed, there are two obvious peaks present on the DSC scans corresponding to melting points of the confined crystals and the surface crystals (Supp. Info. Figure SII). Each trial was deemed successful in producing confined crystals with surface crystals when there was no measurable second peak on the DSC scans. This conclusion is supported by the work of O'Mahony et al., where SEM imaging of the surface of drug-loaded nanoporous substrate was used to confirm that crystals were confined to the pores and that no significant amount of bulk crystals were present on the surface of the substrate [39]. In this study, there was no occurrence of surface crystals that were nano-sized rather than bulk-sized.
3.1 Crystal form identification with XRPD
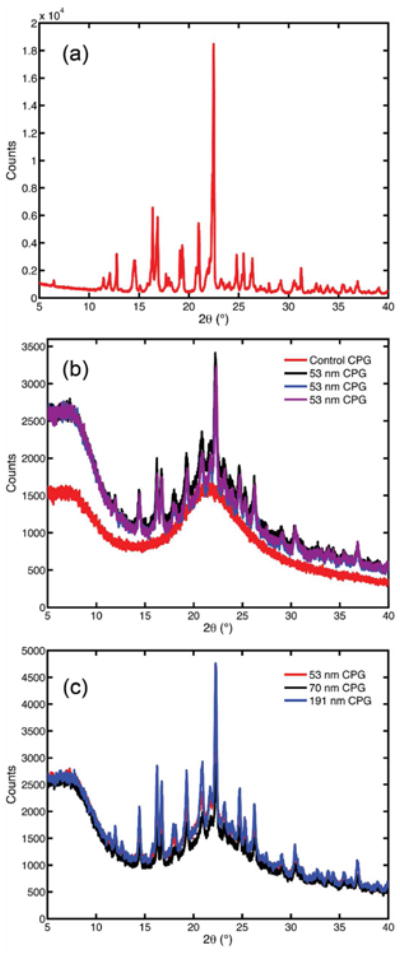
With the exception of fenofibrate in 12 nm CPG which showed no crystallinity, all samples showed the same XRPD peak pattern, both within trials of the same size CPG and across different sizes of CPG. Fig. 3 (a) is a scan of bulk fenofibrate and Fig. 3 (b) shows the XRPD scans of a single representative size of 53 nm CPG, across all three trials. It is evident that the crystal pattern is consistent throughout trials of a given pore size, which was also seen in all other pore sizes. Fig. 3 (c) shows an overlay of scans from three representative CPG sizes (191, 53, and 70 nm). Crystalline fenofibrate form I has reported theoretical diffractogram main peaks at 12° (2θ), 14.5° (2θ), 16.2° (2θ), 16.8° (2θ), and 22.4° (2θ) [36]. The identity of all samples of nanocrystalline fenofibrate as form I can be confirmed by matching peaks and the absence of other peak positions.
Fig. 3. XRD patterns of bulk fenofibrate presented in (a), fenofibrate loaded on 53 nm CPG in 3 distinct trials in (b), and fenofibrate loaded on three representative pore sizes of CPG in (c).
3.2 Crystal form identification with ssNMR
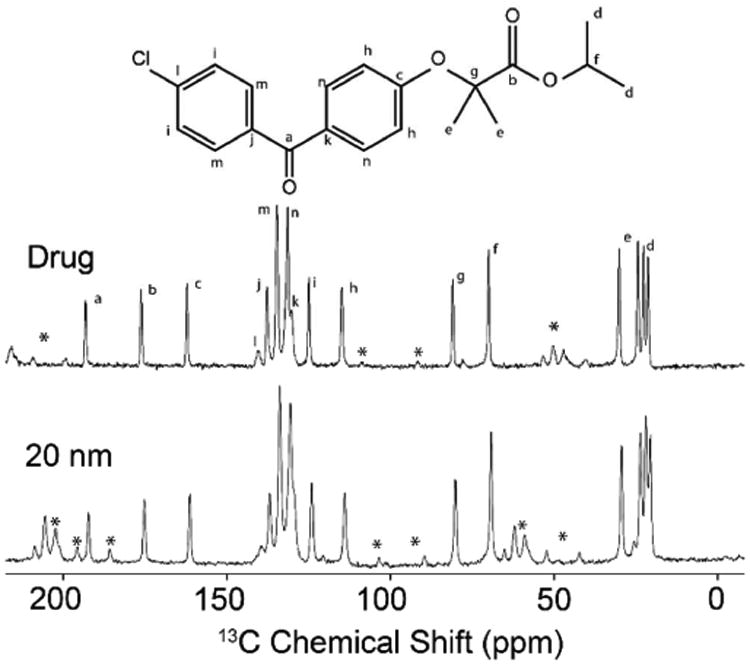
13C CP MAS NMR spectra for all fenofibrate loaded porous silica particles were used to identify amorphous or crystalline fenofibrate and identify whether the crystalline phase present were form I or II. All 13C MAS NMR spectra illustrate highly crystalline fenofibrate (form I), with line widths between 60 and 85 Hz (Supp. Info, Figures SIVa-i). Isotropic chemical shift data for silica particles with pore sizes ranging between 20 and 300 nm revealed identical spectra with no evidence of structural disorder. The slight decrease in resolution (13C line broadening from 300 to 20 nm) is due to the increase of surface disorder as the nanocrystals become increasingly smaller (i.e., surface vs nanocrystalline core).
The 13C MAS NMR spectrum of the 12 nm CPG sample is slightly more complex; although the three well-resolved high frequency 13C resonances indicate form I of fenofibrate, all 13C resonances were broadened with the aromatic region being most affected (Supp. Info. Figure SIVa). We attribute this broadening to the small pore size causing a high degree of structural disorder, which often occurs when API's begin to form an amorphous phase or very small nanocrystalline formation. This observation agrees with the powder x-ray diffraction data which exhibits a single broad featureless lump, consistent with the lack of long-range periodic order. Finally, the poor fenofibrate loading on the 12 nm CPG pore size as determined by the TGA is reflected by a rather poor signal-to-noise after considerable averaging and comparable sample mass when ssNMR was performed on this material. The small pore size could retard the ability of fenofibrate to form nanocrystals as discussed above.
3.3 Analysis of melting point depression of nanocrystals by DSC
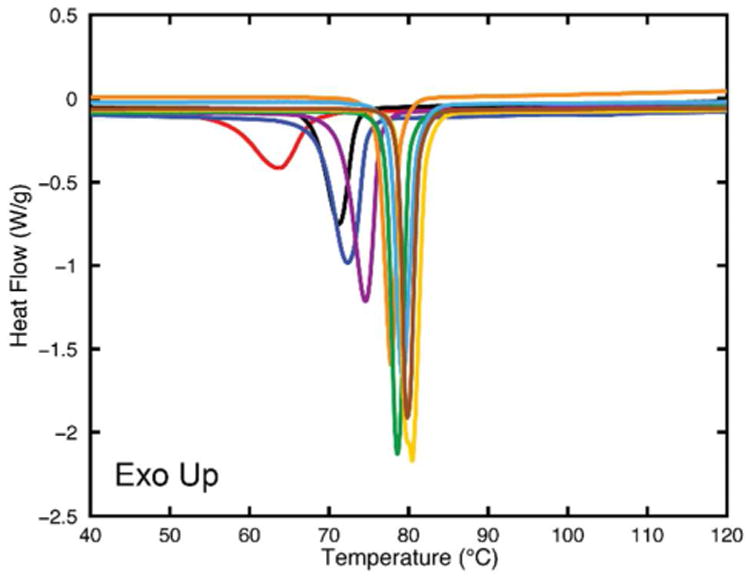
The melting point of bulk fenofibrate crystals was measured and found to be 81.6 ± 0.2 °C. Fig. 5 shows an overlay of the DSC scans for representative trials of fenofibrate crystallized in each CPG pore size. Individual, sharp peaks can be found at decreasing melting point temperatures, moving left as the CPG pore size decreases. Double peaks were not seen in the trials, indicating the preparation method was successful inhibiting the formation of any surface crystals.
Fig. 5. DSC scans of all CPG pore sizes showing single peaks (no surface crystals) with increasing melting point temperatures. Peaks are separated by color and correspond left to right to increasing pore sizes 20 to 300 nm.
It is well known that the Gibbs-Thomson equation can be used to describe the melting point depression seen in nanocrystals [40]. The complete Gibbs-Thomson equation for nanocrystals confined to pores is as follows:
| Eq. 1 |
where Tm is the bulk melting temperature, Tm(d) is the melting temperature of a confined crystal with diameter d assumed equal to the pore diameter, M is the molecular mass, ρsolid is the density of the solid, γsolid–liquid is the surface free energy of the solid-liquid interface, ΔHfus is the molar enthalpy of fusion, and θ is the contact angle between the wall and crystal. If a standard contact angle of 180° is assumed, the equation reduces to
| Eq. 2 |
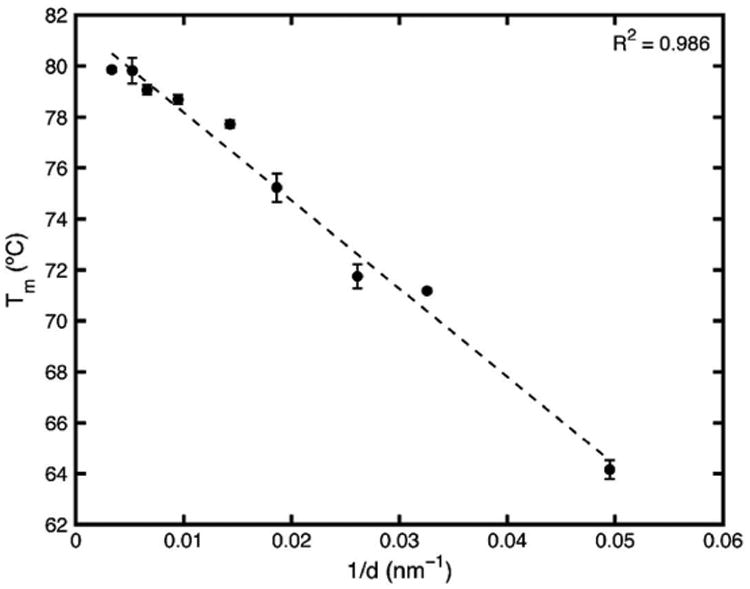
At this point, it is evident that if the surface energy interaction term and the enthalpy of fusion, Hfus, remains constant, there is an expected linear relationship between the melting point and 1/d. Fig. 6 is the plot of 1/d for the fenofibrate in the given range of pore diameters versus the melting point temperature, taken from the DSC peaks. The data fits a linear trend. If the linear fit is extrapolated to 1/d = 0, it predicts the melting point of an infinite diameter particle which is the bulk melting point. The fit predicts a bulk melting point of 81.6 °C, equal to the measured bulk melting temperature of 81.6 °C.
Fig. 6. Constant enthalpy-constant surface interaction energy Gibbs-Thomson equation fit to melting points of fenofibrate nanocrystals confined to porous silica.
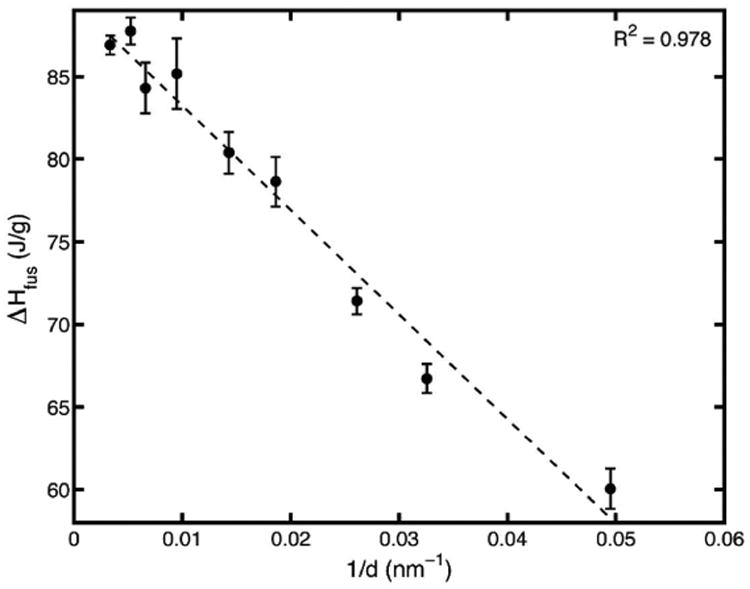
It is clear that the linear Gibbs-Thomson equation wherein the enthalpy of fusion and surface interaction energies are assumed constant accurately predicts the bulk melting temperature. However, the enthalpy of fusion was also measured in the DSC experiments, and was determined to be non-constant. It, too, can be plotted against 1/d, as seen in Fig. 7. It is shown to decrease linearly with 1/d.
Fig. 7. Enthalpy of fusion of fenofibrate nanocrystals showing a linear relationship with 1/d across varying CPG pore sizes.
In accordance with a study done by Ha et al. [22] the Young equation to describe the equilibrium contact angle allows the substitution of (γsolid–liquid cosθ) in the original Eq. 1 with(γsolid–substrate – γliquid–substrate). This yields the modified equation:
| Eq. 3 |
As nanocrystals size decreases, it is expected that the surface energy of the solid approaches that of its corresponding liquid. The difference term, (γsolid–substrate – γliquid–substrate), should therefore decrease and approach zero. The decrease in this term, found in the numerator, likely offsets the decrease in the enthalpy of fusion term found in the denominator. This would produce the apparent linear Gibbs-Thomson relationship reflected in the data despite the known change in enthalpy.
3.4 Enhanced dissolution profile for nanocrystalline fenofibrate
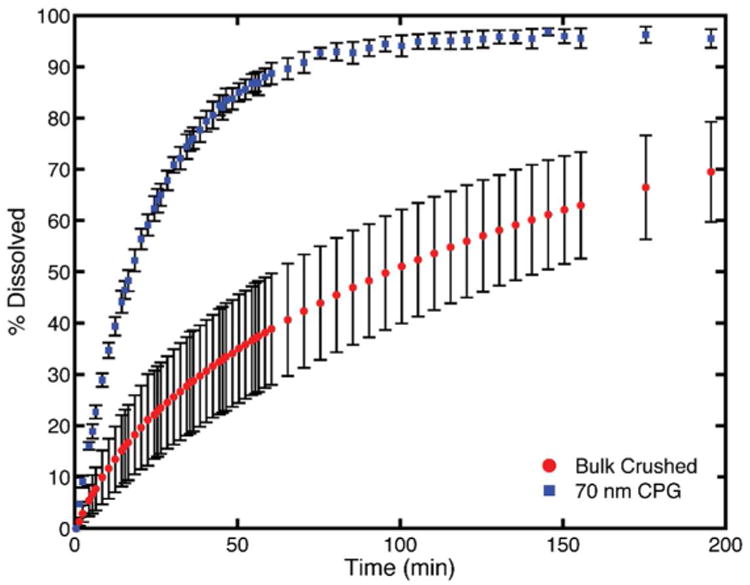
Dissolution profiles were tested and shown in Fig. 8. The nanocrystalline fenofibrate with the most enhanced dissolution profile occurred in the 70 nm CPG matrix, shown in detail in Fig. 9. These fenofibrate nanocrystals showed a roughly 7 fold increase in dissolution rate compared with crushed bulk fenofibrate. They reached >80% dissolution in 42.5 minutes where crushed bulk fenofibrate reached >80% dissolution in 295.5 minutes. Fenofibrate nanocrystals confined to 20 and 30 nm CPG had profiles which aligned closely with the crushed bulk profile indicating that, at small pore sizes, diffusional resistance likely matters to enhancing dissolution rate. Nanocrystals in CPG above 30 nm showed improved dissolution over the bulk crushed and uncrushed fenofibrate crystals at all time points of the study. The dissolution profiles can be clustered into two groups based on manufacturer. The 70 nm and 300 nm (Millipore CPG) confined fenofibrate nanocrystals are the most enhanced profiles and show the expected faster dissolution with smaller pore/crystal size. The fenofibrate nanocrystals confined to the other pore sizes (Prime Synthesis CPG) all have very similar, still improved, dissolution profiles with no discernible trend by pore size. It is likely that the differences in pore geometry and tortuosity of the two types of CPG contribute to the differences in improvement in dissolution rate seen in the study.
Fig. 8. Average dissolution profiles of all CPG-confined fenofibrate nanocrystals showing enhanced dissolution rates compared to crushed and uncrushed bulk fenofibrate, also shown.
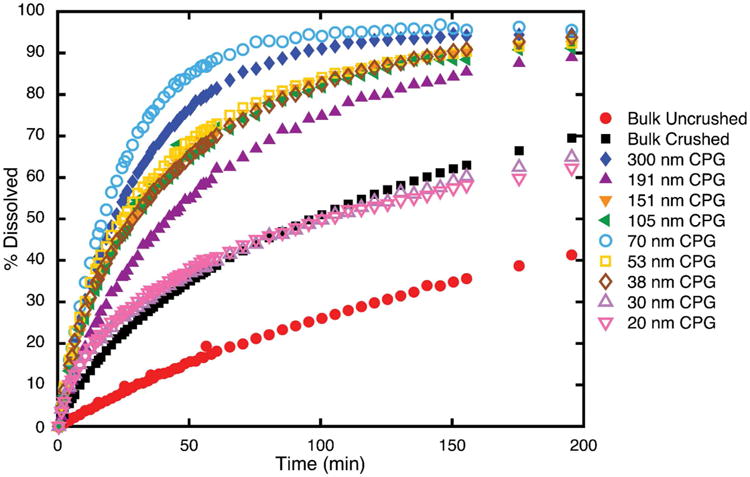
Fig. 9. Comparison of the most enhanced dissolution profile of nanocrystalline fenofibrate in 70 nm CPG compared to bulk crushed fenofibrate.
4 Conclusion
We successfully obtained nanocrystalline fenofibrate over a broad range of sizes by using rigid matrices of porous silica. The results of the study indicate a decreasing melting point and enthalpy of fusion with decreasing pore size in nanocrystals. The decrease in the enthalpy of fusion is offset by a simultaneous decrease in the difference between the surface interaction of the solid-substrate and melt-substrate. This produces seemingly linear behavior in melting point depression as predicted by the Gibbs-Thomson equation. The dissolution testing showed enhanced dissolution profiles for the nanocrystalline materials confined to different porous matrices, with fenofibrate confined in 70 nm CPG from Millipore showing the greatest improvement in dissolution. The controlled pore glass matrices used in this study are not currently accepted materials for oral drug delivery as they do not fulfil requirements of the European Pharmacopeia or the United States Pharmacopeia and the National Formulary; however, the ability to form nanocrystals across a range of pore sizes in this material suggests the potential to use drug-loaded rigid matrices of biocompatible materials to serve as an oral dosage forms with enhanced dissolution ability for poorly water soluble APIs.
Supplementary Material
Fig. 4. 13C CP MAS NMR spectra of fenofibrate: molecule (top), bulk drug (middle) and loaded in 20 CPG (bottom).
Acknowledgments
We thank the Novartis-MIT Center for Continuous Manufacturing for financial support and use of instrumentation. R.G.G thanks the NIBIB through the National Institutes of Health grant EB-002026. V.K.M. is grateful to the Natural Sciences and Engineering Research Council of Canada and the Government of Canada for a Banting Postdoctoral Fellowship. L.M.D. is grateful to Dr. Samir A. Kulkarni for valuable assistance and discussions.
Footnotes
Electronic Supplementary Information (ESI) available: Details of DSC, XRPD, and ssNMR patterns.
Notes and References
- 1.Shegokar R, Muller RH. Nanocrystals: industrially feasible multifunctional formulation technology for poorly solubleactives. International Journal of Pharmaceutics. 2010;399(1-2):129–139. doi: 10.1016/j.ijpharm.2010.07.044. [DOI] [PubMed] [Google Scholar]
- 2.Kim K, Lee Is, Centrone A, Hatton TA, Myerson AS. Formation of nanosized organic molecular crystals on engineered surfaces. Journal of the American Chemical Society. 2009;131(51):18212–18213. doi: 10.1021/ja908055y. [DOI] [PubMed] [Google Scholar]
- 3.Zuo B, Sun Y, Li H, Liu X, Zhai Y, Sun J, He Z. Preparation and in vitro/in vivo evaluation of fenofibrate nanocrystals. International Journal of Pharmaceutics. 2013;455(1-2):267–275. doi: 10.1016/j.ijpharm.2013.07.021. [DOI] [PubMed] [Google Scholar]
- 4.Hu J, Johnston KP, Williams RO. Nanoparticle engineering processes for enchancing the dissolution rates of poorly water soluble drugs. Drug Development and Industrial Pharmacy. 2004;30(3):233–245. doi: 10.1081/ddc-120030422. [DOI] [PubMed] [Google Scholar]
- 5.Junghanns J, Muller RH. Nanocrystal technology, drug delivery and clinical applications. International Journal of Nanomedicine. 2008;3(3):295–310. doi: 10.2147/ijn.s595. [DOI] [PMC free article] [PubMed] [Google Scholar]
- 6.de Waard H, Hinrichs WLJ, Frijlink HW. A novel bottom–up process to produce drug nanocrystals: Controlled crystallization during freeze-drying. Journal of Controlled Release. 2008;128(2):179–183. doi: 10.1016/j.jconrel.2008.03.002. [DOI] [PubMed] [Google Scholar]
- 7.Bleich J, Muller BW. Production of drug loaded microparticles by the use of supercritical gases with the aerosol solvent extraction system (SES) process. Journal of Microencapsulation. 1996;13(2):131–139. doi: 10.3109/02652049609052902. [DOI] [PubMed] [Google Scholar]
- 8.Lee S, Nam K, Kim MS, Jun SW, Park JS, Woo JS, Hwang SJ. Preparation and characterization of solid dispersions of itraconazole by using aerosol solvent extraction system for improvement in drug solubility and bioavailability. Archives of Pharmacal Research. 2005;28(7):866–874. doi: 10.1007/BF02977355. [DOI] [PubMed] [Google Scholar]
- 9.Rogers TL, Johnston KP, Williams RO. Solution-based particle formation of pharmaceutical powders by supercritical or compressed fluid CO2 and cryogenic spray-freezing technologies. Drug Development and Industrial Pharmacy. 2001;27(10):1003–1015. doi: 10.1081/ddc-100108363. [DOI] [PubMed] [Google Scholar]
- 10.Sarkari M, Brown J, Chen X, Swinnea S, Williams RO, Johnston KP. Enhanced drug dissolution using evaporative precipitation into aqueous solution. International Journal of Pharmaceutics. 2002;243(1-2):17–31. doi: 10.1016/s0378-5173(02)00072-8. [DOI] [PubMed] [Google Scholar]
- 11.Chen X, Young TJ, Sarkari M, Williams RO, Johnston KP. Preparation of cyclosporine A nanoparticles byevaporative precipitation into aqueous solution. International Journal of Pharmaceutics. 2002;242(1-2):3–14. doi: 10.1016/s0378-5173(02)00147-3. [DOI] [PubMed] [Google Scholar]
- 12.de Waard H, Grasmeijer N, Hinrichs WLJ, Eissens AC, Pfaffenbach PPF, Frijlink HW. Preparation of drug nanocrystals by controlled crystallization: application of a 3-way nozzle to prevent premature crystallization for large scale production. European Journal of Pharmaceutical Sciences. 2009;38(3):224–229. doi: 10.1016/j.ejps.2009.07.005. [DOI] [PubMed] [Google Scholar]
- 13.Moschwitzer JP. Drug nanocrystals in the commercial pharmaceutical development process. International Journal of Pharmaceutics. 2013;453(1):142–156. doi: 10.1016/j.ijpharm.2012.09.034. [DOI] [PubMed] [Google Scholar]
- 14.Qian KK, Bogner RH. Application of mesoporous silicon dioxide and silicate in oral amorphous drug delivery systems. Journal of Pharmaceutical Sciences. 2012;101(2):444–463. doi: 10.1002/jps.22779. [DOI] [PubMed] [Google Scholar]
- 15.Wang S. Ordered mesoporous materials for drug delivery. Microporous and Mesoporous Materials. 2009;117(1-2):1–9. [Google Scholar]
- 16.Hancock BC, Zografi G. Characteristics and significance of the amorphous state in pharmaceutical systems. Journal of Pharmaceutical Sciences. 1997;86(1):1–12. doi: 10.1021/js9601896. [DOI] [PubMed] [Google Scholar]
- 17.Willart JF, Descamps M. Solid state amorphization of pharmaceuticals. Molecular Pharmaceutics. 2008;5(6):905–920. doi: 10.1021/mp800092t. [DOI] [PubMed] [Google Scholar]
- 18.Yu L. Amorphous pharmaceutical solids: preparation, characterization and stabilization. Advanced Drug Delivery Reviews. 2001;48(1):27–42. doi: 10.1016/s0169-409x(01)00098-9. [DOI] [PubMed] [Google Scholar]
- 19.Jackson CL, McKenna GB. Vitrification and crystallization of organic liquids confined to nanoscale pores. Chemistry of Materials. 1996;8(8):2128–2137. [Google Scholar]
- 20.Azaïs T, Tourné-Péteilh C, Aussenac F, Baccile N, Coelho C, Devoisselle JM, Babonneau F. Solid-state NMR study of ibuprofen confined in MCM-41 material. Chemistry of Materials. 2006;18(26):6382–6390. [Google Scholar]
- 21.Azais T, Hartmeyer G, Quignard S, Laurent G, Babonneau F. Solution state NMR techniques applied to solid state samples: characterization of benzoic acid confined in MCM-41. Journal of Physical Chemistry. 2010;114(19):8884–8891. [Google Scholar]
- 22.Ha JM, Hamilton BD, Hillmyer MA, Ward MD. Phase behaviour and polymorphism of organic crystals confined within nanoscale chambers. Crystal Growth and Design. 2009;9(11):4766–4777. [Google Scholar]
- 23.Ha JM, Wolf JH, Hillmyer MA, Ward MD. Polymorph selectivity under nanoscopic confinement. Journal of the American Chemical Society. 2004;126(11):3382–3383. doi: 10.1021/ja049724r. [DOI] [PubMed] [Google Scholar]
- 24.Ha JM, Hillmyer MA, Ward MD. Thermotropic propetries of organic nanocrystals embedded in ultrasmall crystallization chambers. Journal of Physical Chemistry. 2005;109(4):1392–1399. doi: 10.1021/jp045488v. [DOI] [PubMed] [Google Scholar]
- 25.Tran TH, Ramasamy T, Truong DH, Choi HG, Yong CS, Kim JO. Preparation and characterization of fenofibrate-loaded nanostructured lipid carriers for oral bioavailability enhancement. AAPS Pharm Sci Tech. 2014;15(6):1509–1515. doi: 10.1208/s12249-014-0175-y. [DOI] [PMC free article] [PubMed] [Google Scholar]
- 26.Yang X, Ong TC, Michaelis VK, Heng S, Huang J, Griffin RG, Myerson AS. Formation of organic molecular nanocrystals under rigid confinement with analysis by solid state NMR. Cryst Eng Comm. 2014;16(39):9345–9352. doi: 10.1039/C4CE01087F. [DOI] [PMC free article] [PubMed] [Google Scholar]
- 27.Brettmann B, Bell E, Myerson A, Trout B. Solid-state NMR characterization of high-loading solid solutions of API and excipients formed by electrospinning. Journal of Pharmaceutical Sciences. 2012;101(4):1538–1545. doi: 10.1002/jps.23032. [DOI] [PubMed] [Google Scholar]
- 28.Jiang Q, Ward MD. Crystallization under nanoscale confinement. Chemical Society Reviews. 2014;43:2066–2079. doi: 10.1039/c3cs60234f. [DOI] [PubMed] [Google Scholar]
- 29.Hilden JL, Reyes CE, Kelm MJ, Tan JS, Stowell JG, Morris KR. Capillary precipitation of a highly polymorphic organic compound. Crystal Growth and Design. 2003;3(6):921–926. [Google Scholar]
- 30.Beiner M, Rengarajan GT, Pankaj S, Enke D, Steinhart M. Manipulating the Crystalline State of Pharmaceuticals by Nanoconfinement. Nano Letters. 2007;7(5):1381–1385. doi: 10.1021/nl0705081. [DOI] [PubMed] [Google Scholar]
- 31.Rengarajan GT, Enke D, Steinhart M, Beiner M. Size-dependent growth of polymorphs in nanopores and Ostwald's step rule of stages. Physical Chemistry Chemical Physics. 2011;13:21367–21374. doi: 10.1039/c1cp22679g. [DOI] [PubMed] [Google Scholar]
- 32.Pines A, Gibby MG, Waugh JS. Proton-enhanced nuclear induction spectroscopy. A method for high-resolution NMR of dilute spins in solids. Journal of Chemical Physics. 1972;56(4):1776–1777. [Google Scholar]
- 33.Bennett AE, Rienstra CM, Auger M, Lakshmi KV, Griffin RG. Heteronuclear decoupling in rotating solids. Journal of Chemical Physics. 1995;103:6951. [Google Scholar]
- 34.Rao KS, Keshar NK, Jena N, Rao MEB, Patnaik AK. Stability indicating liquid chromatographic method for the determination of fenofibrate and its application to kinetic studies. International Journal of Pharmaceutical Science and Nanotechnology. 2013;5(4):1866–1874. [Google Scholar]
- 35.Bhise SD. Effect of hydroxypropyl β-cyclodextrin inclusion complexation on solubility of fenofibrate. International Journal of Research in Pharmaceutical and Biomedical Sciences. 2011;2(2):596–604. [Google Scholar]
- 36.Heinz A, Gordon KC, McGoverin CM, Rades T, Strachan CJ. Understanding the solid-state forms of fenofibrate – A spectroscopic and computational study. European Journal of Pharmaceutics and Biopharmaceutics. 2009;71(1):100–108. doi: 10.1016/j.ejpb.2008.05.030. [DOI] [PubMed] [Google Scholar]
- 37.Henry RF, Zhang GZ, Gao Y, Buckner IS. Fenofibrate. Acta Crystallographica Section E: Structure Reports Online. 2003;59(5):699–700. [Google Scholar]
- 38.Sliwinska-Bartkowiak M, Dudziak G, Gras R, Sikorski R, Radhakrishnan R, Gubbins KE. Freezing behavior in porous glasses and MCM-41. Colloids and Surfaces A: Physicochemical and Engineering Aspects. 2001;187-188(1):523–529. [Google Scholar]
- 39.O'Mahony M, Leung AK, Ferguson S, Trout BL, Myerson AS. A Process for the Formation of Nanocrystals of Active Pharmaceutical Ingredients with Poor Aqueous Solubility in a Nanoporous Substrate. Organic Process Research & Development. 2014 [Google Scholar]
- 40.Myerson AS. Handbook of Industrial Crystallization. Second. Boston: Butterworth Heinemann; 2002. [Google Scholar]
Associated Data
This section collects any data citations, data availability statements, or supplementary materials included in this article.


