

One in 10 adults report chronic widespread pain with potential sociocultural variation. Cultural differences in pain reporting should be considered in future research.
Supplemental Digital Content is Available in the Text.
Keywords: Systematic review, Meta-analysis, Chronic widespread pain, Fibromyalgia, Prevalence, General population
Abstract
Chronic widespread pain (CWP) is common and associated with poor general health. There has been no attempt to derive a robust prevalence estimate of CWP or assess how this is influenced by sociodemographic factors. This study therefore aimed to determine, through a systematic review and meta-analysis, the prevalence of CWP in the adult general population and explore variation in prevalence by age, sex, geographical location, and criteria used to define CWP. MEDLINE, Embase, CINAHL, and AMED were searched using a search strategy combining key words and related database-specific subject terms to identify relevant cohort or cross-sectional studies published since 1990. Included articles were assessed for risk of bias. Prevalence figures for CWP (American College of Rheumatology criteria) were stratified according to geographical location, age, and sex. Potential sources of variation were investigated using subgroup analyses and meta-regression. Twenty-five articles met the eligibility criteria. Estimates for CWP prevalence ranged from 0% to 24%, with most estimates between 10% and 15%. The random-effects pooled prevalence was 10.6% (95% confidence intervals: 8.6-12.9). When only studies at low risk of bias were considered pooled, prevalence increased to 11.8% (95% confidence intervals: 10.3-13.3), with reduced but still high heterogeneity. Prevalence was higher in women and in those aged more than 40 years. There was some limited evidence of geographic variation and cultural differences. One in 10 adults in the general population report chronic widespread pain with possible sociocultural variation. The possibility of cultural differences in pain reporting should be considered in future research and the clinical assessment of painful conditions.
1. Introduction
Chronic widespread pain (CWP) is a condition characterized by long-standing diffuse musculoskeletal pain and frequently associated with other physical symptoms such as fatigue, psychological distress, and concentration problems. In the American College of Rheumatology 1990 (ACR-1990) definition,43 CWP is the fundamental feature of fibromyalgia (FM) and is defined as pain lasting 3 months or longer, located axially (cervical spine, thoracic spine, anterior chest, or low back), above and below the waist, and on the left and right sides of the body.
In 2010, the ACR published an alternative set of criteria (ACR-2010),41 meant to be used clinically, which emphasized the importance of somatic symptoms (eg, fatigue, waking unrefreshed) that have been associated with FM. The ACR-2010 criteria dispensed with tender-point examination and instead used a measure of the widespreadness of pain and a measure of the number of somatic symptoms experienced, such as fatigue and cognitive impairment. The new criteria place FM at one extreme on a spectrum of polysymptomatic distress that includes CWP.
Although studies have reported the prevalence of CWP in different populations, there has been no attempt to consolidate these studies to derive a robust prevalence estimate of CWP or to assess how this is influenced by sociodemographic factors. There have been 3 systematic reviews and 2 narrative reviews of the prevalence of “chronic pain,”12,30,31,34,38 and 1 study has summarized the reported prevalence of CWP from 16 population studies but was not a systematic review and did not attempt a meta-analysis.27 Ascertaining the population prevalence of CWP has important public health implications. It is difficult to justify and plan interventions for conditions with an unknown community burden. Furthermore, clinicians take into account estimates of disease prevalence in different groups of the population (age, sex, ethnicity) when formulating differential diagnoses. Investigating how prevalence varies according to features such as age, sex, and geographical location offers insights into possible aetiology.
We aimed to systematically review the existing literature that presents estimates for CWP prevalence in the adult general population. We chose to limit our review to studies using ACR criteria to define CWP to ensure that prevalence estimates were comparable. The ACR-1990 criteria were selected as an established and widely used measure of CWP diagnosis. However, we also chose to include the more recent ACR-2010 criteria to investigate variation in prevalence based on the 2 ACR CWP case definitions. We explored variation in prevalence estimates by age, sex, and geographical location.
2. Methods
2.1. Eligibility criteria
All adult population-based (cross-sectional or cohort) studies published since 1990 where prevalence of CWP was presented, or could be calculated from available data, were considered for inclusion. Only studies of CWP determined using either the ACR-199043 or ACR-201041 CWP criteria were included. We excluded studies that presented estimates based on specific subsets of a general population (eg, women, hospital outpatient clinic patients). However, we did not exclude some select populations that were considered to be representative of the general population in a particular geographical locale (eg, Pima Indians, Maori population). Full inclusion and exclusion criteria are presented in supplementary Table A1 (available online as Supplemental Digital Content at http://links.lww.com/PAIN/A138).
2.2. Search strategy
MEDLINE, Embase, CINAHL, and AMED were searched up to September 3, 2013 using a search strategy combining key words and related database-specific subject terms. The search strategy combined terms related to pain (chronic widespread pain, FM, chronic pain syndrome, diffuse pain, fibrositis, fibromyositis, myofascial pain) and terms related to study design (epidemiology, cohort study, cohort analysis, cross-sectional study, cross-sectional analysis, observational analysis, prevalence, disease frequency) (supplementary Tables A2 and A3, available online as Supplemental Digital Content at http://links.lww.com/PAIN/A138).
The titles of the articles returned were examined and any that were obviously irrelevant were excluded. Abstracts and then full text of the remaining articles were reviewed to find relevant studies that met the inclusion criteria.
Additional relevant articles were identified by searching the reference lists of full-text articles and hand-searching of the Journal of Rheumatology (identified as the most frequent contributor of articles in an initial scoping study). Native speakers translated foreign language articles.
2.3. Risk of bias assessment
Articles included in the study were assessed for risk of bias using 2 domains of the Quality in Prognosis Studies tool16 that are relevant to observational studies ([1] study participation and [2] outcome measurement). Appraisal of each domain provides a subjective assessment of risk of bias (ranked as low, moderate, or high). A summary of the areas considered in the assessment of each domain is included in the supplementary Table A4.1 (available online as Supplemental Digital Content at http://links.lww.com/PAIN/A138).
2.4. Data extraction
A data extraction form was used to extract equivalent information from each article. Information extracted included population sampled, prevalence estimates, timeframe of prevalence estimate (eg, point prevalence, annual prevalence), and any prevalence estimates reported stratified by age, sex, or location. The form also included fields to capture data relevant to the assessment of risk of bias. Prevalence figures and 95% confidence intervals (CIs) were extracted or calculated from the available data using Wilson's method.29
2.5. Reliability
A second reviewer (K.P.J.) blinded to the primary reviewer's (K.E.M.) decisions checked the article selection, data extraction, and risk of bias assessment stages of the review. In each instance, the number of articles checked was the larger of either 10 studies or 10% of the studies to be appraised. Any differences of opinion were discussed, and a third reviewer (J.S.) was available to arbitrate any issues that remained unresolved.
2.6. Analysis
We undertook an initial descriptive analysis of the studies. Heterogeneity between estimates was assessed using the I2 statistic, which describes the percentage of variation not because of sampling error across studies. An I2 value above 75% indicates high heterogeneity.18 We limited the articles included in the meta-analysis to those using the ACR-1990 criteria to define CWP. Meta-analysis was undertaken using a random-effects model (to account for heterogeneity) conducted using the MetaXL (www.epigear.com) add-in for Microsoft Excel. A pooled prevalence figure was calculated with 95% CI.
In a meta-analysis of prevalence, when the estimate for a study tends towards either 0% or 100%, the variance for that study moves towards zero and as a result its weight is overestimated in the meta-analysis.5 Therefore, we conducted the meta-analysis with prevalence estimates that had been transformed using the double arcsine method.5 The final pooled result and 95% CIs were back-transformed for ease of interpretation.
Potential influences on prevalence estimates were investigated using subgroup analyses and meta-regression. Where studies allowed, we descriptively compared prevalence estimates by age, sex, and location within studies. We then assessed the influence on estimates of the following study-level variables identified a priori as potential sources of variation in the estimates of prevalence: (1) risk of bias, (2) geographical location, and (3) data collection method. We classified studies as being either at low risk of bias (low risk of both participation and outcome measurement bias) or at moderate-to-high risk of bias (moderate or high risk of either participation or outcome measurement bias). We also compared European studies with North American studies. Data collection method was assessed by comparing studies, where data were collected by a self-completed questionnaire vs a data collection method that required some form of human interaction (eg, interview or telephone questionnaire). We ran 3 meta-regression models including these covariates separately using Stata version 13.1.
3. Results
3.1. Search results
The search returned a total of 4051 publications, leading to 111 articles selected for full-text review. An additional 15 studies were identified from the citation lists, and 1 further article,28 published after the formal database search had been completed, was identified by an electronic citation alert for the ACR-1990 case definition criteria.1 Hence, a total of 127 articles had their full-text reviewed for inclusion. The screening process is detailed in Figure 1.
Figure 1.
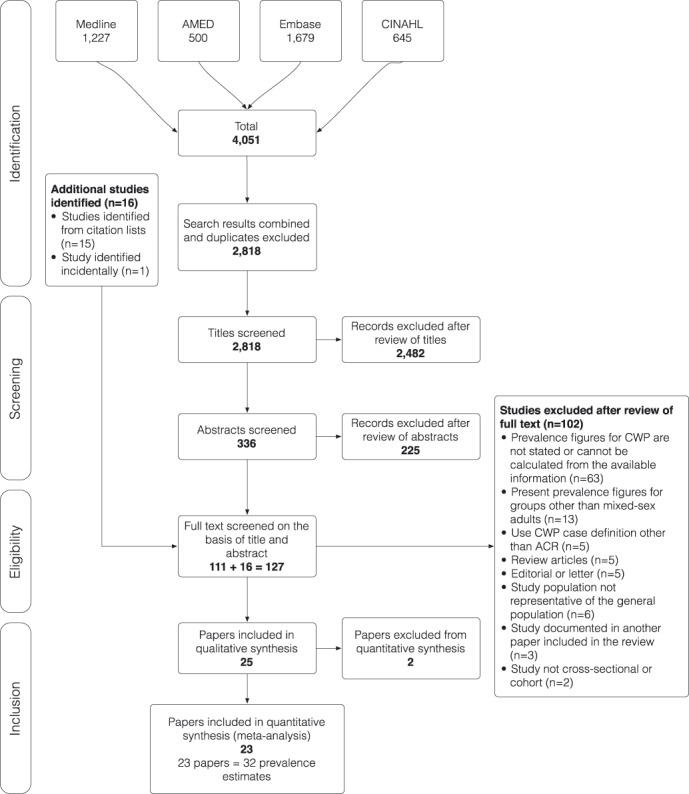
Flow chart to illustrate the process by which articles were selected or rejected for inclusion in the study.
One hundred and two articles were excluded after full-text review. Twenty-five studies (reported in 28 articles)1–4,6–11,13–15,19,20,22–26,28,32,33,35,37,39,40,42 were therefore selected for inclusion in the review (Table 1), representing 37 CWP prevalence estimates.
Table 1.
Summary of studies included and their risk of participation and outcome measurement bias.

3.2. Included studies
All studies included had a cross-sectional design and estimated point prevalence. Twenty-four studies used ACR-1990 criteria, and the remaining study defined CWP using the ACR-2010 criteria of a widespread pain index of greater than or equal to 6 for a minimum of 3 months.15 One study used an unstructured clinical interview23 and the other 24 used a structured questionnaire. Of the studies using a questionnaire, 102,6,10,13,19,25,28,32,37,42 used a postal questionnaire, 51,3,8,35,39 used a telephone questionnaire, 39,20,22 used a face-to-face interview, 215,33 used a self-completed questionnaire with help available from an interviewer if required, and 411,14,24,40 used a mixture of self-completed questionnaires, face-to-face interviews, and telephone questionnaires.
3.3. Risk of bias
A summary of the risk of bias of the included articles is provided in Table 1; a justification of each rating is provided in the supplementary appendix (Table A4.2, available online as Supplemental Digital Content at http://links.lww.com/PAIN/A138). Seven studies (29%) were considered to be at low risk of bias for both study participation and outcome measurement, and 2 studies (8%) were considered to be at high risk of bias for both domains.
3.4. Study participation
Twenty-four percent (n = 6) of studies were considered to be at high risk of study participation bias, 44% (n = 11) were at moderate risk, and 28% (n = 7) at low risk (Table 1). One study40 scored low risk of participation bias for one population (Amish) under investigation and moderate risk for another (non-Amish).
The main failings in sample selection were poor response rates,1,23 nonrandom sampling of respondents,3,22,23 or recruitment from a nonrepresentative sampling frame.11
The 7 studies at low risk of participation bias either selected their study sample randomly or demonstrated that the sample was representative of the study population. Response rates in the low-risk studies were good or these studies were able to demonstrate that the sample was representative of the population or that nonresponders were not significantly different from responders.
3.5. Outcome measurement
Sixteen percent (n = 4) of the articles included were considered to be at high risk of outcome measurement bias, 24% (n = 6) at moderate risk, and 60% (n = 15) at low risk.
Four studies1,8,24,33 used nonrobust methods to establish prevalence estimates. These prevalence figures were calculated from data extrapolated from a subsample or from a nonrelated population (eg, rheumatology outpatients) rather than from the whole sample or the target population. Specifically, (1) 2 studies1,8 calculated a positive predictive value for a screening questionnaire using data obtained from rheumatology outpatients (number of confirmed ACR-1990-positive cases in those identified as cases by the questionnaire) and used this to calculate prevalence figures using the questionnaire responses from the general population; (2) 1 study33 assumed an equal frequency of CWP in responders and nonresponders and extrapolated prevalence within responders to nonresponders to calculate overall prevalence; and (3) 1 study24 calculated prevalence based on examination of a stratified sample of positive responders a year after their initial questionnaire response. One article33 also failed to provide sufficient evidence of validity of their data collection instrument.
The 15 studies at low risk of outcome measurement bias used clearly defined diagnostic criteria, reliable and validated instruments, and a similar method and setting of outcome measurement for all participants.
3.6. Prevalence
Prevalence estimates ranged from 0% observed in a sample of Pima Indians20 to 24% for low socioeconomic status populations in Brazil.3 Most estimates were between 10% and 15% of the population, and all the low-risk studies using ACR-1990 criteria gave estimates between these 2 levels. There was greater variation in studies with a high risk of bias.
Low estimates (less than 6%) were found in 7 studies.1,14,15,20,23,24,35 One study15 used the widespread pain index from the ACR-2010 criteria to estimate a CWP prevalence of 5.8%. The remaining 6 low estimates came from studies using the ACE-1990 criteria. One study24 used a slightly different application of the case definition by using data from 2 different time points a year apart; those with possible widespread pain were identified by an initial postal questionnaire and followed up a year later to identify CWP cases. Another study20 estimated prevalence in a particularly select population (Pima Indians). Three low estimates1,23,35 were from studies at high risk of bias. The other low estimate14 may be explained by data collection methods.
3.7. Sex variation
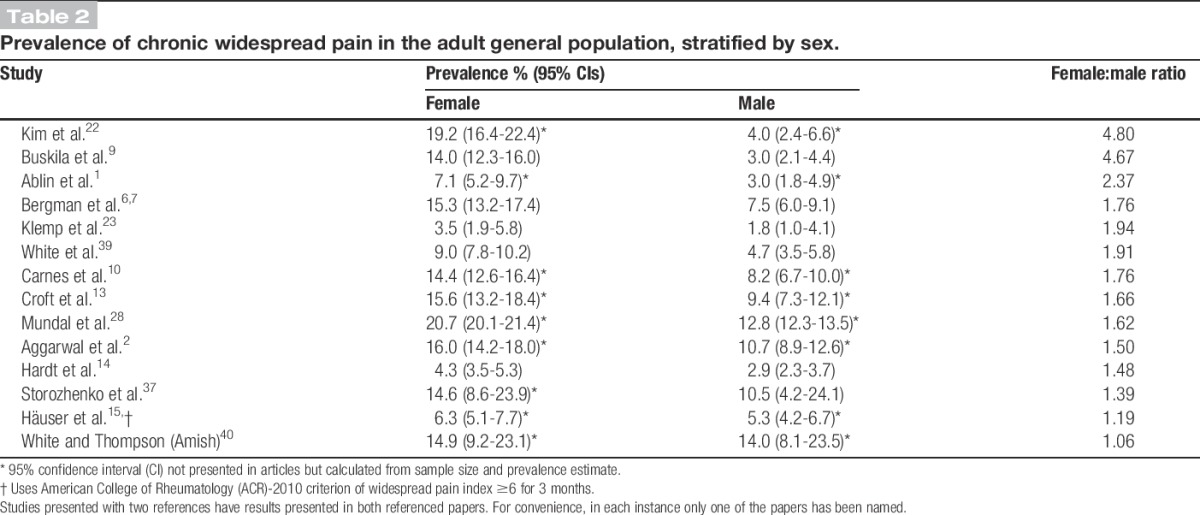
Fourteen articles presented prevalence figures by sex (Table 2). Prevalence was higher for women in all studies; female-to-male prevalence ratios ranged from 1.06 to 4.80, with most estimates showing CWP prevalence in women to be around double that observed in men.
Table 2.
Prevalence of chronic widespread pain in the adult general population, stratified by sex.
3.8. Age variation
The minimum age for the study population was 18 years or over in all but 3 of the included studies.8,15,23 In these studies, the minimum age was between 12 and 15 years, but estimates from these 3 studies were within the range of those from studies with minimum age of 18 years or over. Six studies presented age-banded data (Fig. 2). These demonstrate an increase in CWP prevalence to around age 40 to 50 and then either continually increasing prevalence or a plateauing of prevalence estimates in older age groups. Data from Croft et al.13 demonstrate 2 peaks: one in middle age and another in old age.
Figure 2.

Variation in chronic widespread pain prevalence (%) population by age. Note that the horizontal axes differ between graphs depending on the information supplied in the corresponding reports.
3.9. Geographical variation
Figures for CWP in Europe were generally between 10% and 14% (Table 3). One UK study25 observed higher prevalence in South Asians than Europeans.
Table 3.
Prevalence of chronic widespread pain in the adult general population (%), stratified by geographical location.
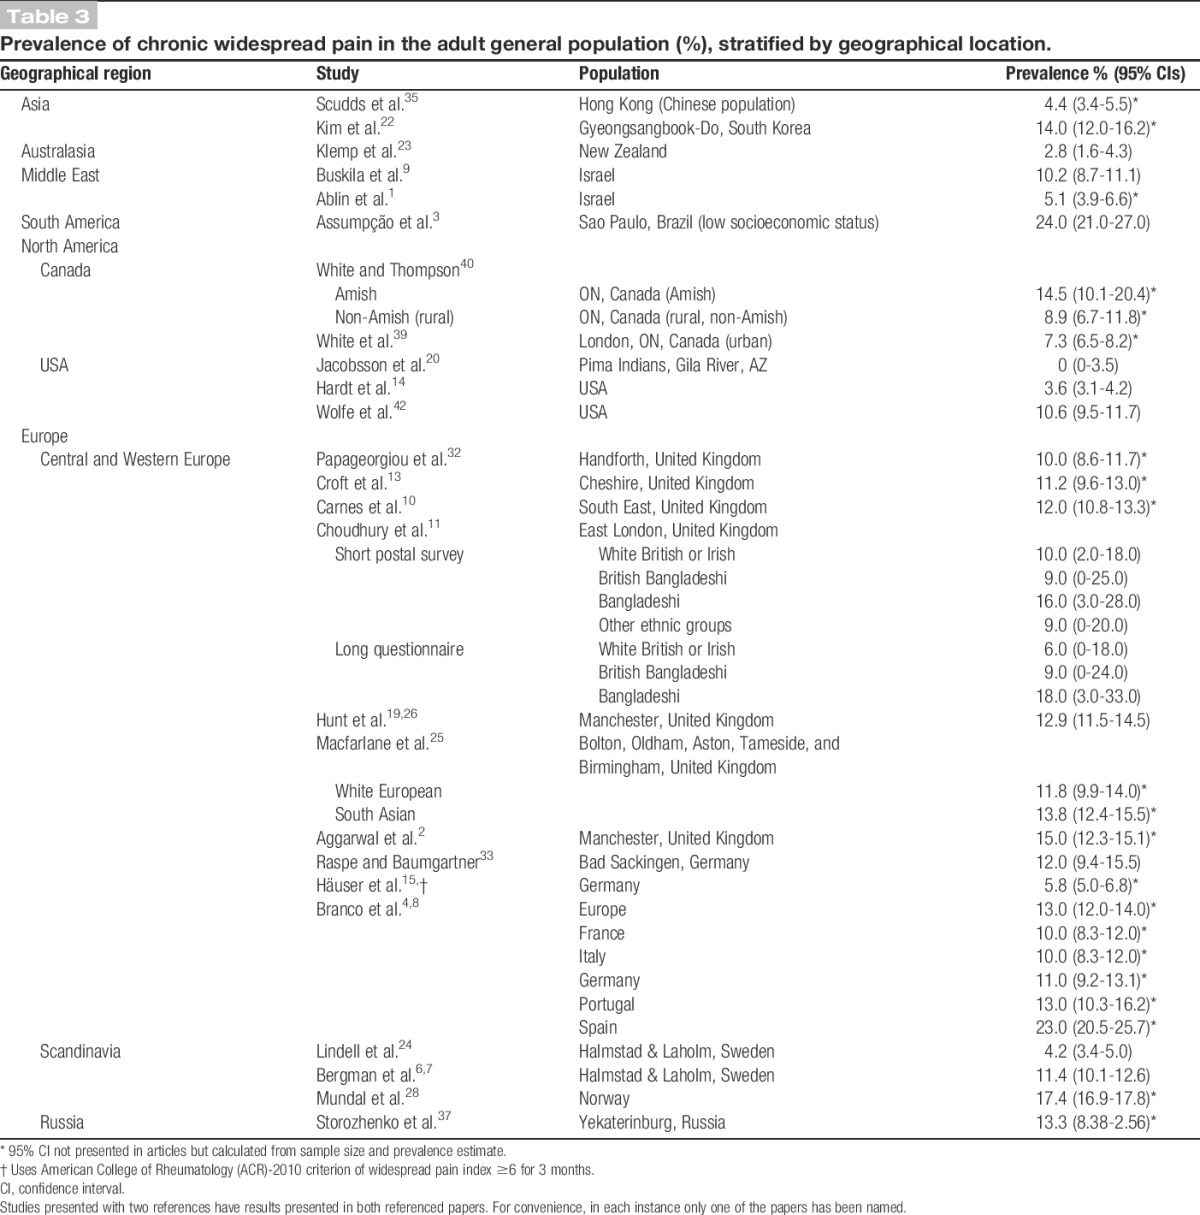
In North America, prevalence among the Amish was high at 14.5%, compared with 8.9% among rural Ontarians40 and 7.3% among urban Ontarians.39 Pima Indians in Phoenix, Arizona, had no observed CWP.20 The general population in the United States was found to have a prevalence of 3.6% in a 2008 study14 and 10.6% in a 1995 study.42
Four11,23,25,40 studies made comparisons between different ethnic or cultural groups resident in the same regions; all 4 studies revealed appreciable differences in CWP prevalence.
3.10. Meta-analysis
Thirty-two prevalence estimates (from 23 articles) were included in the meta-analysis. The 24 articles (36 prevalence estimates) using ACR-1990 criteria to estimate CWP prevalence were considered for entry and 4 estimates (from 2 articles) were excluded. One estimate24 was excluded because the study population was a subsample of those studied in another article.6 A further 3 estimates (from 1 article) were excluded to avoid problems with overweighting a population; Choudhury et al.11 presented 7 prevalence estimates representing figures for different ethnic groups from both a short postal survey and a long questionnaire. Participants were recruited from the same sampling frame, which could lead to overlap of study populations; we therefore only included the estimates from the short postal survey as the sample was more likely to be representative of the general population.
The overall random-effects pooled prevalence of CWP was 10.6% (95% CIs: 8.6-12.9) with a high level of heterogeneity (I2 = 98.7%) (Fig. 3). When only studies at low risk of bias (on both domains of the Quality in Prognosis Studies tool) were considered, the pooled prevalence increased to 11.8 (95% CIs: 10.3-13.3), with reduced, but still high, heterogeneity (I2 = 85.1%). A sensitivity analysis using untransformed prevalence estimates showed similar results.
Figure 3.

Forest plot of prevalence (%) of American College of Rheumatology (ACR)-1990 chronic widespread pain of studies. Subgrouped by risk of bias. Random-effects analysis. (A) Low-risk studies are those at low risk of bias on both domains of Quality in Prognosis Studies (QUIPS) tool. (B) Intermediate-risk studies are those at either moderate risk of bias on both domains or moderate risk in one and low in the other. (C) High-risk studies are those at high risk of bias on either domain of the QUIPS tool. (D) Select populations: Pima Indians,20 Amish population,40 white European, and South Asian.25 SQ, short postal questionnaire. Studies presented with two references have results presented in both referenced papers. For convenience, in each instance only one of the papers has been named.
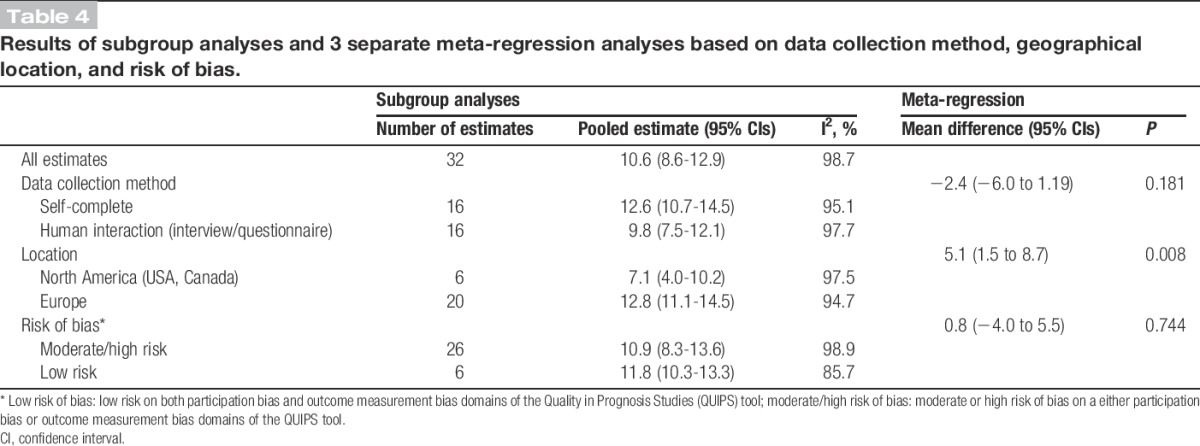
The results of 3 meta-regression analyses including pooled estimates for subgroups based on geographical location, risk of bias, and data collection method are included in Table 4. There was little evidence of an effect of data collection method (P = 0.181) or risk of bias (P = 0.744) on prevalence. However, there was an apparent higher prevalence in Europe than North America (12.8% vs 7.1%, P = 0.008).
Table 4.
Results of subgroup analyses and 3 separate meta-regression analyses based on data collection method, geographical location, and risk of bias.
4. Discussion
Twenty-five articles (37 prevalence estimates) were included in this systematic review and meta-analysis of the prevalence of CWP. Prevalence estimates of studies at low risk of bias were between 10% and 15%. Pooled prevalence for studies at low risk of bias was 11.8%. Prevalence was higher in women and in those more than 40 years of age. There was some evidence of geographic variation in prevalence between Europe and North America. Some articles included in the review suggest that there may be sociocultural variation in CWP.
The review searched 4 major bibliographic databases, using a search strategy that had been tested in a pilot study, and we translated all relevant foreign language articles. In addition, we searched the citation lists of all articles selected for full-text review and hand searched the Journal of Rheumatology for relevant articles published after 1990. Moreover, at each step of the identification and review process, a reliability exercise was undertaken. However, we did not undertake a search of grey literature, so there may be unpublished research that was not included. Nonetheless, with such a large review of a topic, where we could argue that any publication bias is unlikely to be systematic, it seems reasonable to conclude that the included studies present a reasonable reflection of the true general population prevalence of CWP.
A systematic review of tools to assess the quality of observational studies examining incidence or prevalence36 concluded that no consensus exists as to which individual criteria should be assessed to establish methodological quality. The Cochrane Collaboration17 advise assessing risk of bias on a subjective basis using domain-based evaluation. This advice is also relevant to observational studies. Therefore, based on an evaluation of different tools in a pilot study, we chose to use a tool based on a subjective assessment of risk of bias in separate domains.16 However, even guided by a tool, methodological appraisal remains a subjective exercise. For this reason, to minimize bias in the review process, for a random sample of 10% of the included articles, 2 reviewers assessed risk of bias independently, with minimal disagreement between reviewers.
No effort was made to contact study authors for raw data. This meant that, in some instances, 95% CIs for prevalence estimates had to be calculated from information given in the article. It also restricted the ability to assess the variability in prevalence according to age. Of the articles that presented prevalence figures according to age, the age groups used varied. Only 1 study reported prevalence based on the ACR-2010 criteria; hence, we were unable to assess variation between the 2 ACR criteria definitions.
Given the varied methodological approaches of the studies included in the review, the appropriateness of calculating pooled prevalence estimates could be questioned. Given high heterogeneity between studies, the pooled prevalence estimate should therefore be interpreted with caution. However, only studies using the ACR-1990 case definition criteria were entered the meta-analysis, and these criteria were selected as an established and widely used standard for CWP and FM diagnosis. Including studies using the same diagnostic criteria in similar populations (male and female adults) ensured some comparability. The heterogeneity in pooled prevalence estimates may have been due to data collection method, the geographical location of the study, or bias introduced by study methods. The impact of study quality on pooled prevalence was assessed by systematically excluding low-quality studies and studies examining particularly select populations from the meta-analysis and by conducting a meta-regression comparing studies at low risk of bias with those at moderate-to-high risk. Meta-regression demonstrated little evidence of data collection method or higher risk of bias giving a consistently higher or lower level of prevalence.
The prevalence estimates of low-risk studies were consistently between 10% and 15%. Prevalence estimates in females were around double those for males, whereas prevalence estimates generally plateaued in middle age (40-60 years). This matches the patterns of prevalence of primary care-recorded widespread pain consultation21 and nonspecific chronic pain.38
European estimates of prevalence were slightly higher than those from North America. However, the number of North American studies was low and only 2 of these 6 studies were not in more specific populations. Smaller numbers of studies from other locations and diverse methodological approaches make comparisons between other regions difficult. There were some apparent cultural and socioeconomic differences in CWP prevalence. The 2 most extreme outliers for CWP prevalence included in the review represent select populations (considered to be representative of the general population in the geographical locale from which they were selected) rather than the wider general population. The highest estimate for prevalence is for a low socioeconomic population,3 whereas the lowest estimate is in a North American Indian trial population.20
Four11,23,25,40 studies found differences in CWP prevalence between ethnic or cultural groups. Although observed differences in prevalence in 2 of these studies may also be due to different approaches to data collection40 and recruitment,23 this finding may offer some support for ethnic or cultural variation in CWP. Whether any differences in the experience of CWP are attributable to lifestyle, genetics, or sociocultural influences are unclear, and it is difficult to draw convincing conclusions based on evidence from only 4 studies. However, potential cultural differences in pain reporting should be considered during clinical history taking, and further research should investigate the extent and nature of ethnic, cultural, and regional variation in CWP prevalence, as this may offer insights into the aetiology or management of this condition.
5. Conclusions
Chronic widespread pain is a common problem, reported by 1 in 10 adults, with prevalence twice as high in women as in men and with those aged more than 40 having a higher prevalence. Heterogeneity between studies made assessment of geographical variation difficult. However, there may be cultural differences in CWP prevalence, and the possibility of such differences in pain reporting should be considered in future research and the clinical assessment of painful conditions.
Conflict of interest statement
The authors have no conflicts of interest to declare.
Supplementary Material
Acknowledgments
The authors thank Danielle van der Windt and Stefan Bergman for their comments on the review; Vicky Strauss, Tatjana Pavlovic, and Hyeong Lee for their help with the article translations; and Rachael Lewis for her help in developing the search strategy. Work undertaken on this study was part of a PhD studentship funded by the Arthritis Research UK Primary Care Centre at Keele University.
Appendix A. Supplemental Digital Content
Supplemental Digital Content associated with this article can be found online at http://links.lww.com/PAIN/A138.
Footnotes
Sponsorships or competing interests that may be relevant to content are disclosed at the end of this article.
Supplemental digital content is available for this article. Direct URL citations appear in the printed text and are provided in the HTML and PDF versions of this article on the journal's Web site (www.painjournalonline.com).
Institutional URL: http://www.lshtm.ac.uk/aboutus/people/mansfield.kathryn.
References
- [1].Ablin JN, Oren A, Cohen S, Aloush V, Buskila D, Elkayam O, Wollman Y, Berman M. Prevalence of fibromyalgia in the Israeli population: a population-based study to estimate the prevalence of fibromyalgia in the Israeli population using the London Fibromyalgia Epidemiology Study Screening Questionnaire (LFESSQ). Clin Exp Rheumatol 2012;30:39–43. [PubMed] [Google Scholar]
- [2].Aggarwal VR, McBeth J, Zakrzewska JM, Lunt M, Macfarlane GJ. The epidemiology of chronic syndromes that are frequently unexplained: do they have common associated factors? Int J Epidemiol 2006;35:468–76. [DOI] [PubMed] [Google Scholar]
- [3].Assumpção A, Cavalcante AB, Capela CE, Sauer JF, Chalot SD, Pereira CAB, Marques AP. Prevalence of fibromyalgia in a low socioeconomic status population. BMC Musculoskelet Disord 2009;10:64. [DOI] [PMC free article] [PubMed] [Google Scholar]
- [4].Bannwarth B, Blotman F, Roué-Le Lay K, Caubère JP, André E, Taïeb C. Fibromyalgia syndrome in the general population of France: a prevalence study. Joint Bone Spine 2009;76:184–7. [DOI] [PubMed] [Google Scholar]
- [5].Barendregt JJ, Doi SA, Lee YY, Norman RE, Vos T. Meta-analysis of prevalence. J Epidemiol Community Health 2013;67:974–8. [DOI] [PubMed] [Google Scholar]
- [6].Bergman S, Herrstrom PER, Hogstrom K, Petersson IF, Svensson B, Jacobsson LTH, Herrström P, Högström K. Chronic musculoskeletal pain, prevalence rates, and sociodemographic associations in a Swedish population study. J Rheumatol 2001;28:1369–77. [PubMed] [Google Scholar]
- [7].Bergman S, Herrström PER, Lennart TH, Petersson IF, Jacobsson LT. Chronic widespread pain: a three year followup of pain distribution and risk factors. J Rheumatol 2002;29:818–25. [PubMed] [Google Scholar]
- [8].Branco JC, Bannwarth B, Failde I, Abello Carbonell J, Blotman F, Spaeth M, Saraiva F, Nacci F, Thomas E, Caubère JP, Le Lay K, Taieb C, Matucci-Cerinic M. Prevalence of fibromyalgia: a survey in five European countries. Semin Arthritis Rheum 2010;39:448–53. [DOI] [PubMed] [Google Scholar]
- [9].Buskila D, Abramov G, Biton A, Neumann L. The prevalence of pain complaints in a general population in Israel and its implications for utilization of health services. J Rheumatol 2000;27:1521–5. [PubMed] [Google Scholar]
- [10].Carnes D, Parsons S, Ashby D, Breen A, Foster NE, Pincus T, Vogel S, Underwood M. Chronic musculoskeletal pain rarely presents in a single body site: results from a UK population study. Rheumatology (Oxford) 2007;46:1168–70. [DOI] [PubMed] [Google Scholar]
- [11].Choudhury Y, Bremner SA, Ali A, Eldridge S, Griffiths CJ, Hussain I, Parsons S, Rahman A, Underwood M. Prevalence and impact of chronic widespread pain in the Bangladeshi and white populations of Tower Hamlets, East London. Clin Rheumatol 2013;32:1375–82. [DOI] [PMC free article] [PubMed] [Google Scholar]
- [12].Cimmino MA, Ferrone C, Cutolo M. Epidemiology of chronic musculoskeletal pain. Best Pract Res Clin Rheumatol 2011;25:173–83. [DOI] [PubMed] [Google Scholar]
- [13].Croft P, Rigby AS, Boswell R, Schollum J, Silman A. The prevalence of chronic widespread pain in the general population. J Rheumatol 1993;20:710–13. [PubMed] [Google Scholar]
- [14].Hardt J, Jacobsen C, Goldberg J, Nickel R, Buchwald D. Prevalence of chronic pain in a representative sample in the United States. Pain Med 2008;9:803–12. [DOI] [PubMed] [Google Scholar]
- [15].Häuser W, Schmutzer G, Hinz A, Hilbert A, Brähler E. Prävalenz chronischer Schmerzen in Deutschland [in German]. Schmerz 2013;27:46–55. [DOI] [PubMed] [Google Scholar]
- [16].Hayden JA, van der Windt DA, Cartwright JL, Côté P, Bombardier C. Assessing bias in studies of prognostic factors. Ann Intern Med 2013;158:280–6. [DOI] [PubMed] [Google Scholar]
- [17].Higgins JPT, Green S. Cochrane Handbook for Systematic Reviews of Interventions Version 5.1.0. 2011. Available at: http://handbook.cochrane.org/. Accessed December 3, 2014. [Google Scholar]
- [18].Higgins JPT, Thompson SG, Deeks JJ, Altman DG. Measuring inconsistency in meta-analyses. BMJ 2003;327:557–60. [DOI] [PMC free article] [PubMed] [Google Scholar]
- [19].Hunt IM, Silman AJ, Benjamin S, McBeth J, Macfarlane GJ. The prevalence and associated features of chronic widespread pain in the community using the “Manchester” definition of chronic widespread pain. Rheumatology (Oxford) 1999;38:275–9. [DOI] [PubMed] [Google Scholar]
- [20].Jacobsson LTH, Nagi DK, Pillemer SR, Knowler WC, Hanson RL, Pettitt DJ, Bennett PH. Low prevalences of chronic widespread pain and shoulder disorders among the Pima Indians. J Rheumatol 1996;23:907–9. [PubMed] [Google Scholar]
- [21].Jordan KP, Kadam UT, Hayward R, Porcheret M, Young C, Croft P. Annual consultation prevalence of regional musculoskeletal problems in primary care: an observational study. BMC Musculoskelet Disord 2010;11:144. [DOI] [PMC free article] [PubMed] [Google Scholar]
- [22].Kim SH, Bae GR, Lim HS. Prevalence and risk factors of fibromyalgia syndrome and chronic widespread pain in two communities in Korea. J Korean Rheum Assoc 2006;13:18–25. [Google Scholar]
- [23].Klemp P, Williams SM, Stansfield SA. Fibromyalgia in Maori and European New Zealanders. J Rheumatol 2002;41:554–7. [DOI] [PubMed] [Google Scholar]
- [24].Lindell L, Bergman S, Petersson IF, Jacobsson LT, Herrström P. Prevalence of fibromyalgia and chronic widespread pain. Scand J Prim Health Care 2000;18:149–53. [DOI] [PubMed] [Google Scholar]
- [25].Macfarlane GJ, Palmer B, Roy D, Afzal C, Silman AJ, O'Neill T. An excess of widespread pain among South Asians: are low levels of vitamin D implicated? Ann Rheum Dis 2005;64:1217–9. [DOI] [PMC free article] [PubMed] [Google Scholar]
- [26].McBeth J, Macfarlane GJ, Benjamin S, Silman AJ. Features of somatization predict the onset of chronic widespread pain: results of a large population-based study. Arthritis Rheum 2001;44:940–6. [DOI] [PubMed] [Google Scholar]
- [27].McBeth J, Mulvey MR. Fibromyalgia: mechanisms and potential impact of the ACR 2010 classification criteria. Nat Rev Rheumatol 2012;8:108–16. [DOI] [PubMed] [Google Scholar]
- [28].Mundal I, Gråwe RW, Bjørngaard JH, Linaker OM, Fors EA. Prevalence and long-term predictors of persistent chronic widespread pain in the general population in an 11-year prospective study: the HUNT study. BMC Musculoskelet Disord 2014;15:213. [DOI] [PMC free article] [PubMed] [Google Scholar]
- [29].Newcombe R. Two-sided confidence intervals for the single proportion: comparison of seven methods. Stat Med 1998;17:857–72. [DOI] [PubMed] [Google Scholar]
- [30].Nickel R, Raspe HH. Chronischer schmerz: epidemiologie und inanspruchnahme [in German]. Nervenarzt 2001;72:897–906. [DOI] [PubMed] [Google Scholar]
- [31].Ospina M, Harstall C. Prevalence of Chronic Pain: An Overview. Health Technology Assessment 29. Edmonton, Canada: 2002. Available at: http://www.ihe.ca/documents/prevalence_chronic_pain.pdf. Accessed 25 August 2010. [Google Scholar]
- [32].Papageorgiou AC, Silman AJ, Macfarlane GJ. Chronic widespread pain in the population: a seven year follow up study. Ann Rheum Dis 2002;61:1071–4. [DOI] [PMC free article] [PubMed] [Google Scholar]
- [33].Raspe H, Baumgartner C. The epidemiology of the fibromyalgia syndrome FMS: different criteria-different results. J Musculoskelet Pain 1993;1:149–52. [Google Scholar]
- [34].Reid KJ, Harker J, Bala MM, Truyers C, Kellen E, Bekkering GE, Kleijnen J. Epidemiology of chronic non-cancer pain in Europe: narrative review of prevalence, pain treatments and pain impact. Curr Med Res Opin 2011;27:449–62. [DOI] [PubMed] [Google Scholar]
- [35].Scudds RA, Li EKM, Scudds R. The prevalence of fibromyalgia syndrome in Chinese people in Hong Kong. J Musculoskelet Pain 2006;14:3–11. [Google Scholar]
- [36].Shamliyan T, Kane RL, Dickinson S. A systematic review of tools used to assess the quality of observational studies that examine incidence or prevalence and risk factors for diseases. J Clin Epidemiol 2010;63:1061–70. [DOI] [PubMed] [Google Scholar]
- [37].Storozhenko ON, Lesniak OM, Macfarlane GJ, McBeth J. The prevalence of chronic generalized pain and its relationship to demographic characteristics and mental status. Klin Med (Mosk) 2004;82:48–52. [PubMed] [Google Scholar]
- [38].Verhaak PFM, Kerssens JJ, Dekker J, Sorbi MJ, Bensing JM. Prevalence of chronic benign pain disorder among adults: a review of the literature. PAIN 1998;77:231–9. [DOI] [PubMed] [Google Scholar]
- [39].White KP, Speechley M, Harth M, Ostbye T. The London Fibromyalgia Epidemiology Study: the prevalence of fibromyalgia syndrome in London, Ontario. J Rheumatol 1999;26:1570–6. [PubMed] [Google Scholar]
- [40].White KP, Thompson J. Fibromyalgia syndrome in an Amish community: a controlled study to determine disease and symptom prevalence. J Rheumatol 2003;30:1835–40. [PubMed] [Google Scholar]
- [41].Wolfe F, Clauw DJ, Fitzcharles MA, Goldenberg DL, Katz RS, Mease P, Russell AS, Russell IJ, Winfield JB, Yunus MB. The American College of Rheumatology preliminary diagnostic criteria for fibromyalgia and measurement of symptom severity. Arthritis Care Res (Hoboken) 2010;62:600–10. [DOI] [PubMed] [Google Scholar]
- [42].Wolfe F, Ross K, Anderson J, Russell IJ, Hebert L. The prevalence and characteristics of fibromyalgia in the general population. Arthritis Rheum 1995;38:19–28. [DOI] [PubMed] [Google Scholar]
- [43].Wolfe F, Smythe HA, Yunus MB, Bennett RM, Bombardier C, Goldenberg DL, Tugwell P, Campbell SM, Abeles M, Clark P, Fam AG, Farber SJ, Fiechtner JJ, Michael Franklin C, Gatter RA, Hamaty D, Lessard J, Lichtbroun AS, Masi AT, Mccain GA, John Reynolds W, Romano TJ, Jon Russell I, Sheon RP. The American College of Rheumatology 1990 Criteria for the Classification of Fibromyalgia. Report of the Multicenter Criteria Committee. Arthritis Rheum 1990;33:160–72. [DOI] [PubMed] [Google Scholar]
Associated Data
This section collects any data citations, data availability statements, or supplementary materials included in this article.