

Abstract
Colorectal cancer (CRC) is the third most common malignancy and the second most common cause of cancer death worldwide. Early detection of CRC can improve patient survival rates; thus, the identification of noninvasive diagnostic markers is urgently needed. MicroRNAs (miRNAs) have extensive potential to diagnose several diseases, including cancer. In this study, we compared the expression pattern of miRNAs from plasma and stool samples of patients with early stages of CRC (I, II) with that of healthy subjects. We performed miRNA profiling using microarrays on plasma and stool samples of eight patients with CRC and four healthy subjects. Seven miRNAs were found to be underexpressed in both plasma and stool samples of patients with CRC versus healthy subjects. Then, we aimed to verify two out of these seven differentially expressed miRNAs (let-7a-5p and let-7f-5p) by quantitative reverse transcriptase polymerase chain reaction on a larger set of plasma and stool samples of 51 patients with CRC and 26 healthy subjects. We confirmed the results of microarray analysis since their expression was significantly lower in stool and plasma samples of patients with CRC. Moreover, receiver operating characteristic curve analysis demonstrated that fecal let-7f expression levels have significant sensitivity and specificity to distinguish between patients with CRC and healthy subjects. In conclusion, if the results are confirmed in larger series of patients, underexpressed let-7a-5p and let-7f-5p miRNAs in both plasma and stool samples of patients with CRC may serve potentially as noninvasive molecular biomarkers for the early detection of CRC.
Keywords: miRNA, let-7, stool DNA, plasma DNA, early markers, colorectal cancer
Introduction
Despite the existence of screening, preventive, and therapeutic strategies, colorectal cancer (CRC) is still the third most common malignancy and the second most common cause of cancer death, with an estimated 1.2 million new cases and more than 600,000 deaths annually, worldwide.1–3 Initiation and progression of CRC is a slow process lasting several years, and it usually begins with cryptic lesions and gradually develops to adenoma and finally to malignant carcinoma, with the potential for invasion and metastasis.4 Early detection of this neoplasm is critical because patient survival rate and response to treatment are strongly associated with tumor stage and disease progression at the time of diagnosis. It has been estimated that almost 95% of patients would be cured if diagnosis was made at an early or precursor lesion stage.5 Therefore, new, accurate, and reliable diagnostic methods that improve early detection and monitoring of CRC are necessary.
MicroRNAs (miRNAs) are short (18–24 nucleotides), highly conserved noncoding endogenous RNAs, which regulate gene expression posttranscriptionally.6,7 Numerous studies have shown that the alteration of miRNAs expression is involved in the pathogenesis of several types of cancers, such as CRC, by regulating the expression of tumor suppressors and oncogenes.8,9 Differential expression of miRNAs has also been detected in serum, plasma,10–15 and stool of patients with CRC.16–22
In this study, we compared the expression pattern of miRNAs in paired plasma and stool samples of patients with early stages (I, II) of CRC and of neoplasm-free individuals as controls.
Materials and Methods
Patients
In this study, a total of 51 patients with CRC and 26 healthy controls were enrolled for the evaluation of miRNAs from plasma and stool samples at the Digestive Disease Research Institute, Shariati Hospital, Tehran, Iran, from August 2011 to October 2012. Patients with CRC and healthy controls had similar age (P-value = 0.776, independent samples t-test) and gender (P-value = 0.567, chi-square test) distribution. Clinical and demographical data of participants are presented in Table 1.
Table 1.
Characteristics of patients with CRC and healthy subjects.
| CRC PATIENTS | HEALTHY SUBJECTS | P-VALUEb | |
|---|---|---|---|
| Age | 65.04 yrs ± 9.13 | 61.04 yrs ± 9.17 | 0.776 |
| Gender | 0.567 | ||
| Male | 27 | 14 | |
| Female | 24 | 12 | |
| TNM stagea | |||
| I | 12 | – | |
| II | 39 | – | |
| Tumor location | |||
| Colon | 45 | – | |
| Rectum | 6 | – |
Notes:
TNM: tumor-node-metastasis staging system according to the Union for International Cancer Control (UICC) guidelines.
P-value for age was calculated by independent sample t-test; P-value for gender was calculated by chi-square test.
Plasma and stool samples were collected from 51 newly diagnosed, pathologically confirmed patients with early stages (I, II) of CRC before receiving any treatment and from 26 healthy subjects who were free of CRC and colorectal polyps as examined by colonoscopy. Tumor was staged according to the tumor node metastasis staging system of the Union for International Cancer Control guidelines. The patients with a history of concurrent malignant diseases were excluded from this study. Plasma and stool samples were stored at −80°C until use. Informed consent was obtained from all participants for the use of their blood and stool samples in this study. This research complied with the principles of the Declaration of Helsinki and was approved by the Institutional Review Board of Shariati Hospital.
RNA isolation
Extraction of total RNA, including miRNAs, from plasma and stool samples was carried out using miRNAeasy Serum/Plasma Kit (Qiagen GmbH) and miRNAeasy Mini Kit (Qiagen GmbH), respectively. For stool samples, the protocol was slightly modified to increase the RNA yield. Briefly, ∼100 mg of stool was homogenized with 1 mL of RNase-free water and 200 μL of this was lysed with QIAzol lysis reagent in a proportion of 1:6. RNA was precipitated with chloroform, and the aqueous phase was mixed with 1.5 volumes of 100% ethanol.17 The concentration of extracted RNA was measured using the Nano-Drop-1000 Spectrophotometer (Thermo Fisher Scientific, Inc.). Agilent’s Bioanalyzer (Agilent Technologies) was used for checking the quality of total RNA with the RNA 6000 chip and miRNA with the small RNA chip (Agilent Technologies).
MicroRNA microarray expression profiling and data analysis
Eight paired stool and plasma samples of patients with CRC and four paired stool and plasma samples of healthy individuals were randomly selected to identify the miRNA expression signature. MiRNA profiling was done with Agilent’s miRNA microarray system (V19), containing 2,006 human miRNAs (Agilent Technologies). RNA labeling and hybridization were performed according to Agilent’s protocol version 2.4. Briefly, 100 ng of the total RNA was dephosphorylated with calf intestinal alkaline phosphatase by incubation at 37°C for 30 minutes. In the denaturation step, dimethyl sulfoxide (100%) was added to each sample, and after incubation at 100°C for eight minutes, the samples were immediately transferred to an ice–water bath. Then, samples were labeled with Cyanine3-pCp by incubation with T4 RNA ligase for two hours at 16°C. After labeling, samples were completely dried in a vacuum concentrator at 45°C–55°C and resuspended in nuclease-free water. The samples were hybridized to array active side in Agilent SureHyb Chambers at 55°C for 20 hours. The microarrays were then washed with washing buffers 1 and 2 and scanned on an Agilent’s Microarray Scanner. The information of probe features was extracted from the microarray scan data using Agilent Feature Extraction Software. Finally, the miRNA expression analysis was performed using Gene-Spring GX Analysis software (Agilent Technologies).
Statistical significance of differential expression between the CRC and control groups was determined by t-test. The false discovery rate method of Benjamini–Hochberg procedure was used to correct for multiple comparisons. miRNAs with a fold-change of >2, and P-values <0.05 were considered differentially expressed.
Validation of microarray results with quantitative reverse transcriptase polymerase chain reaction (qRT-PCR)
A set of 51 paired plasma and stool samples of CRC patients (stage I, n = 12; stage II, n = 39) and 26 paired plasma and stool samples of healthy controls (including the patients and healthy subjects used for miRNA microarray analysis) were used for validation of the miRNA microarray findings by SYBR-Green-based quantitative reverse transcriptase polymerase chain reaction (qRT-PCR). Two miRNAs, let-7a-5p and let-7f-5p, were selected for validation based on miRNA array results and also because of the known role of let-7 family of miRNAs in human cancer. Reverse transcription of the extracted RNA was performed by the miScript Reverse Transcription Kit (Qiagen GmbH), according to the manufacturer’s recommendations. Quantification of miRNA was performed using SYBR Green miScript PCR system (Qiagen GmbH) on LightCycler v.3.5 software (Roche Applied Science). Each reaction was performed in a 20 μL volume with 10 ng of template cDNA, and all reactions were run in duplicates. RNU6B miScript Primer Assay (Qiagen GmbH) was used as an endogenous control for normalization of the data. Relative Expression Software Tool (REST 2009) was used to evaluate statistically significant differences in miRNA expression between the two groups.23 P-values <0.05 were considered statistically significant.
Results
Plasma and stool miRNA microarray profiling
RNA concentrations ranged from 20 to 51 ng/μL and from 62 to 1,430 ng/μL in plasma and stool samples, respectively. Quality of total RNA and miRNA was acceptable to perform subsequent miRNAs microarrays and the validation study. Analysis of our array results from comparisons of plasma and stool samples of eight patients with CRC versus four healthy subjects using GeneSpring GX software showed several significantly differentially expressed miRNAs. At the fold change cutoff of 2.0 and P < 0.05, q < 0.3 results of CRC plasma miRNA arrays in comparison with normal samples revealed 78 significantly downregulated and two significantly upregulated miRNAs, and for stool samples, our results revealed 148 significantly downregulated and two significantly upregulated miRNAs. All data of microarray results are listed in Supplementary Table 1. Interestingly, seven miRNAs were downregulated in both plasma and stool specimens of patients with CRC compared with those of healthy controls (P < 0.05, q < 0.3; Fig. 1).
Figure 1.

Diagramatic representation of the miRNAs differentially expressed in plasma and stool of patients with CRC compared to healthy subjects. The venn diagram shows 150 differentially expressed miRNAs in stool and 80 in plasma compared to healthy individuals. The intersection depicts seven miRNAs underexpressed in both plasma and stool of patients with CRC, which are shown in detail in a table.
Validation of miRNA expression differences by qRT-PCR
Two miRNAs (let-7a-5p and let-7f-5p) out of the seven differentially expressed miRNAs in both plasma and stool of patients with CRC by microarray analysis were validated by qRT-PCR on plasma and stool samples of 51 patients with CRC and 26 healthy subjects. We observed significantly lower expression by Mann–Whitney test of let-7a-5p (P = 0.02) and let-7f-5p (P = 0.02) in plasma samples of patients with CRC and of let-7a-5p (P = 0.03) and let-7f-5p (P = 0.003) in stool samples of patients with CRC compared with that of the normal group samples, confirming the results obtained with microarray analysis (Figs. 2 and 3). There was no correlation between let-7a or let-7f expression and cancer stage or tumor site in patients with CRC.
Figure 2.

Plasma let-7a-5p and let-7f-5p expression levels in 51 patients with CRC versus controls. Expression levels of the miRNAs were normalized to RNU6B. (A) Let-7a is significantly downregulated in patient samples compared to normal ones (P-value = 0.02); (B) Let-7f is significantly downregulated in plasma samples of patients compared to normal group (P-value = 0.02). Data were analyzed using Mann–Whitney test. Graphs represent the mean value and standard error of mean of each group.
Figure 3.

Stool let-7a-5p and let-7f-5p expression level in 51 patients with CRC versus controls. Expression levels of the miRNAs were normalized to RNU6B. (A) Let-7a is significantly downregulated in stool samples of patients compared with the normal group (P-value = 0.03); (B) Let-7f is significantly downregulated in samples of patients in comparison with the normal group (P-value = 0.003). Data were analyzed using Mann–Whitney test. Graphs represent the mean value and standard error of mean of each group.
Evaluation of specificity and sensitivity of the let-7 miRNAs
Receiver operating characteristic (ROC) curve analyses were performed on plasma and fecal let-7a-5p and let-7f-5p separately. The ROC curve analysis demonstrated that let-7f-5p expression level in the stool samples has a significant specificity and sensitivity to discriminate patients with CRC from normal individuals. The area under curve was 70.9% with a standard deviation error of 0.06 (P-value = 0.003; Fig. 4).
Figure 4.
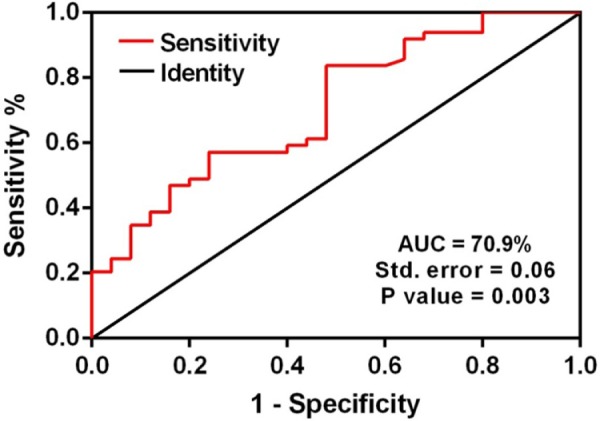
Area under curve (AUC) of receiver operating characteristic (ROC) analysis for let-7f relative expression in fecal samples. ROC curve analysis revealed that fecal let-7f relative expression has significant specificity and sensitivity to distinguish between patients with CRC and normal individuals. The AUC value is 70.9% with the standard error of 0.06 (P-value = 0.003).
Discussion
To our knowledge, no study has been done on simultaneous evaluation of miRNA expression in both plasma and stool samples of patients with CRC to date. In this study, for the first time, we investigated simultaneously the plasma and stool miRNA expression in patients with early stages (I, II) of CRC and in neoplasm-free individuals as controls. We believed that aberrant expression of specific miRNAs on these types of samples might help to identify potential CRC biomarkers.
When expression profiles of miRNA from plasma and stool samples of the patients with CRC were compared with those of the healthy subjects, 80 and 150 differentially expressed miRNAs, respectively, were detected. From the differentially expressed miRNAs, only seven were seen in both plasma and stool samples. With regard to cancer, let-7a-5p and let-7f-5p were the most intriguing from those seven miRNAs, and we wanted to confirm their downregulation in a bigger cohort of patients by qRT-PCR. Our validation study agreed with the results from microarrays; expression levels of the let-7a-5p and let-7f-5p miRNAs were significantly decreased in both plasma and stool samples of patients with early stages of CRC compared with those of healthy subjects. Moreover, ROC curve analysis demonstrated that fecal let-7f expression levels have significant sensitivity and specificity to distinguish between patients with CRC and healthy subjects.
Reduced expression of let-7 family members has been reported in many tumors.24–28 For example, lower expression of let-7f has been reported as a marker for early stage ovarian cancer detection.29 Moreover, there are numerous reports that indicate that this miRNA family is differentially expressed in CRC.22,30–33 However, there is very little information of downregulation of the let-7 miRNA family members in CRC plasma or stool samples. Wang et al performed miRNA profiling on two pooled plasma samples of 10 patients with CRC and 10 normal controls targeting 742 miRNAs by qRT-PCR.13 Interestingly, let-7a miRNA was downregulated, among others, with a fold change >5.
It is well known that let-7a and let-7f miRNAs are located at chromosome 9q22.3, forming a cluster along with let-7d miRNA. However, the mechanisms of action of these let-7 family members on mRNA are not fully understood, even though some of their targets are known. Experimentally verified let-7a target genes with strong evidence include some known cancer genes, such as BCL2, CASP8, CCND2, DICER1, EWSR1, FOXA1, HMGA1, HMGA2, HRAS, KRAS, MYC, MPL, NF2, NRAS, and PRDM1 (according to the databases miRTarBase34 and COSMIC,35 accessed on September 10, 2015). Experimentally verified let-7f-5p target cancer genes include CCND1, MYC, MPL, NKX2-1, and PRDM1 (according to the same databases). However, it is important to note that all the let-7 variants share an identical seed sequence that is critical for target recognition.36 These target genes of let-7 miRNAs are involved in carcinogenesis regulating directly or indirectly cell cycle, apoptosis, and cell adhesion. For example, reduced expression of let-7 is related to cell proliferation and oncogenic transformation by increasing expression of HMGA2.37,38 Moreover, restoring let-7 levels in pancreatic cancer-derived cell lines strongly inhibits cell proliferation.24 More specifically with regard to let-7a and let-7f, several studies have connected these miRNAs with oncogenesis and/or cell growth. Let-7f has been reported to modulate β-catenin/Wnt signaling that is related to growth and development of stem cells via its binding to Axin 2 and subsequent degradation of β-catenin in human mesenchymal stem cells.39 It has been also reported that the miRNA let-7a can revert cell growth in lymphoma and in lung cancer.40,41 In addition, let-7a plays a role in STAT3 signaling at least in cervical carcinogenesis.42 Interestingly, regarding CRC, previous results have shown that transfection of let-7a-1 precursor miRNA to human colon cancer cells resulted in lower levels of RAS and c-myc proteins and subsequent significant growth suppression.33
It is important to note that hsa-miR-21-5p was downregulated in both plasma and stool of patients with CRC compared with that of healthy subjects after the microarray analysis. Surprisingly, this miRNA is upregulated in patients with CRC, even in their serum, according to previous studies.43 However, it has been associated with metastasis and poor survival, and our patients with CRC were all in early and curable stage. It seems that miR-21 has significant potential as a prognostic marker, rather than as an early detection marker.43
Our validation study results confirmed that the expression level of the let-7a-5p and let-7f-5p was significantly decreased in both plasma and stool samples of patients with stages I and II CRC compared with those of healthy subjects. Moreover, ROC curve analysis demonstrated that fecal let-7f-5p expression levels have significant sensitivity and specificity to distinguish between patients with CRC and healthy subjects. We suggest that the downregulation of fecal let-7f-5p in patients with CRC may be useful in early diagnosis of this cancer. Nevertheless, further studies on larger series of patients, especially with different stages of CRC, adenoma, and other precancerous lesions, are needed to clarify whether these miRNAs have the potential to be used for early detection of CRC.
Supplementary Material
Supplementary Table 1.
Differentially expressed miRNAs in patients with CRC versus normal subjects.
| STOOL | PLASMA | |||||
|---|---|---|---|---|---|---|
| miRNA | P-VALUE | Q-VALUE | miRNA | P-VALUE | Q-VALUE | |
| UP | hsa-miR-4642 | 0.004 | 0.1 | hsa-miR-32-3p | 0.011 | 0.07 |
| hsa-miR-617 | 0.042 | 0.1 | hsa-miR-4455 | 0.020 | 0.09 | |
| DOWN | hsa-miR-3124-5p | 9.47E-06 | 0.004 | hsa-miR-222-3p | 8.39E-05 | 0.01 |
| hsa-miR-124-3p | 8.73E-05 | 0.016 | hsa-miR-186-5p | 1.72E-04 | 0.01 | |
| hsa-miR-6511b-5p | 2.95E-04 | 0.034 | hsa-miR-744-5p | 1.82E-04 | 0.01 | |
| hsa-miR-320a | 3.61E-04 | 0.034 | hsa-miR-4291 | 4.41E-04 | 0.02 | |
| hsa-miR-4430 | 5.91E-04 | 0.036 | hsa-miR-513a-5p | 8.44E-04 | 0.03 | |
| hsa-miR-4478 | 5.95E-04 | 0.036 | hsa-let-7f-1-3p | 9.99E-04 | 0.03 | |
| hsa-miR-5008-5p | 7.13E-04 | 0.036 | hsa-miR-425-3p | 0.001 | 0.03 | |
| hsa-miR-4648 | 7.80E-04 | 0.036 | hsa-miR-98-5p | 0.002 | 0.04 | |
| hsa-miR-1236-5p | 9.74E-04 | 0.040 | hsa-miR-432-5p | 0.002 | 0.04 | |
| hsa-miR-4259 | 0.002 | 0.069 | hsa-miR-1304-3p | 0.002 | 0.04 | |
| hsa-miR-3185 | 0.002 | 0.080 | hsa-miR-4299 | 0.002 | 0.04 | |
| hsa-miR-1233-1-5p | 0.003 | 0.080 | hsa-miR-363-3p | 0.002 | 0.04 | |
| hsa-miR-4688 | 0.003 | 0.080 | hsa-miR-142-5p | 0.003 | 0.04 | |
| hsa-miR-4419b | 0.005 | 0.1 | hsa-miR-625-5p | 0.004 | 0.05 | |
| hsa-miR-5088 | 0.005 | 0.1 | hsa-miR-6508-5p | 0.004 | 0.05 | |
| hsa-miR-3678-3p | 0.005 | 0.1 | hsa-miR-18a-5p | 0.005 | 0.06 | |
| hsa-miR-1295b-3p | 0.005 | 0.1 | hsa-miR-29a-3p | 0.005 | 0.06 | |
| hsa-miR-518c-5p | 0.006 | 0.1 | hsa-miR-23b-3p | 0.005 | 0.06 | |
| hsa-miR-4776-5p | 0.007 | 0.1 | hsa-miR-26a-5p | 0.005 | 0.06 | |
| hsa-miR-663a | 0.007 | 0.1 | hsa-miR-181b-5p | 0.006 | 0.06 | |
| hsa-miR-526b-5p | 0.008 | 0.1 | hsa-miR-148a-3p | 0.007 | 0.06 | |
| hsa-miR-514b-5p | 0.009 | 0.1 | hsa-miR-29c-3p | 0.008 | 0.07 | |
| hsa-miR-1183 | 0.009 | 0.1 | hsa-miR-654-5p | 0.008 | 0.07 | |
| hsa-miR-765 | 0.009 | 0.1 | hsa-miR-26b-5p | 0.008 | 0.07 | |
| hsa-miR-3944-3p | 0.010 | 0.10 | hsa-let-7d-5p | 0.008 | 0.07 | |
| hsa-miR-1247-3p | 0.011 | 0.1 | hsa-miR-27b-3p | 0.009 | 0.07 | |
| hsa-miR-4496 | 0.011 | 0.1 | hsa-miR-5580-3p | 0.009 | 0.07 | |
| hsa-miR-3158-5p | 0.012 | 0.1 | hsa-miR-451a | 0.010 | 0.07 | |
| hsa-miR-3926 | 0.012 | 0.1 | hsa-miR-142-3p | 0.010 | 0.07 | |
| hsa-miR-4532 | 0.012 | 0.1 | hsa-miR-4728-5p | 0.010 | 0.07 | |
| hsa-miR-1229-5p | 0.013 | 0.1 | hsa-miR-19a-3p | 0.011 | 0.07 | |
| hsa-miR-494 | 0.014 | 0.1 | hsa-miR-629-5p | 0.011 | 0.07 | |
| hsa-miR-3911 | 0.014 | 0.1 | hsa-miR-103a-3p | 0.012 | 0.07 | |
| hsa-miR-3605-5p | 0.014 | 0.1 | hsa-miR-15a-5p | 0.013 | 0.07 | |
| hsa-miR-3648 | 0.015 | 0.1 | hsa-miR-331-3p | 0.013 | 0.07 | |
| hsa-miR-4444 | 0.015 | 0.1 | hsa-miR-933 | 0.014 | 0.07 | |
| hsa-let-7f-5p | 0.015 | 0.1 | hsa-miR-140-3p | 0.016 | 0.09 | |
| hsa-miR-4793-5p | 0.016 | 0.1 | hsa-miR-106b-5p | 0.017 | 0.09 | |
| hsa-miR-4667-5p | 0.016 | 0.1 | hsa-miR-107 | 0.018 | 0.09 | |
| hsa-miR-3130-3p | 0.016 | 0.1 | hsa-miR-4323 | 0.018 | 0.09 | |
| hsa-miR-1203 | 0.017 | 0.1 | hsa-miR-151a-5p | 0.019 | 0.09 | |
| hsa-miR-4515 | 0.017 | 0.1 | hsa-miR-652-3p | 0.020 | 0.09 | |
| hsa-miR-4486 | 0.018 | 0.1 | hsa-miR-409-3p | 0.020 | 0.09 | |
| hsa-miR-877-5p | 0.018 | 0.1 | hsa-let-7f-5p | 0.021 | 0.09 | |
| hsa-miR-4451 | 0.018 | 0.1 | hsa-miR-20b-5p | 0.023 | 0.09 | |
| hsa-miR-631 | 0.018 | 0.1 | hsa-miR-378i | 0.023 | 0.09 | |
| hsa-miR-5190 | 0.018 | 0.1 | hsa-miR-16-5p | 0.023 | 0.09 | |
| hsa-miR-874 | 0.019 | 0.1 | hsa-miR-199a-3p | 0.023 | 0.09 | |
| hsa-miR-4271 | 0.019 | 0.1 | hsa-miR-27a-3p | 0.026 | 0.10 | |
| hsa-miR-1260a | 0.019 | 0.1 | hsa-miR-148b-3p | 0.027 | 0.10 | |
| hsa-miR-192-5p | 0.019 | 0.1 | hsa-miR-1236-5p | 0.027 | 0.10 | |
| hsa-miR-141-3p | 0.020 | 0.1 | hsa-let-7b-3p | 0.028 | 0.10 | |
| hsa-miR-601 | 0.020 | 0.1 | hsa-miR-223-3p | 0.028 | 0.10 | |
| hsa-miR-3680-3p | 0.020 | 0.1 | hsa-miR-423-3p | 0.029 | 0.10 | |
| hsa-miR-4419a | 0.021 | 0.1 | hsa-miR-663a | 0.029 | 0.10 | |
| hsa-miR-4746-3p | 0.021 | 0.1 | hsa-let-7a-5p | 0.029 | 0.10 | |
| hsa-miR-3676-5p | 0.021 | 0.1 | hsa-miR-122-5p | 0.030 | 0.10 | |
| hsa-miR-640 | 0.022 | 0.1 | hsa-miR-221-3p | 0.031 | 0.10 | |
| hsa-miR-4778-5p | 0.022 | 0.1 | hsa-let-7c | 0.031 | 0.102 | |
| hsa-miR-3202 | 0.022 | 0.1 | hsa-miR-671-3p | 0.033 | 0.10 | |
| hsa-miR-3135b | 0.022 | 0.1 | hsa-miR-130b-3p | 0.033 | 0.10 | |
| hsa-miR-4634 | 0.023 | 0.1 | hsa-miR-151b | 0.034 | 0.10 | |
| hsa-miR-33a-3p | 0.023 | 0.1 | hsa-miR-30b-5p | 0.034 | 0.10 | |
| hsa-miR-4429 | 0.023 | 0.1 | hsa-miR-15b-5p | 0.034 | 0.10 | |
| hsa-miR-483-5p | 0.023 | 0.1 | hsa-miR-185-5p | 0.036 | 0.10 | |
| hsa-miR-4640-3p | 0.023 | 0.1 | hsa-miR-23a-3p | 0.036 | 0.10 | |
| hsa-miR-4465 | 0.023 | 0.1 | hsa-miR-150-5p | 0.037 | 0.10 | |
| hsa-miR-3200-5p | 0.024 | 0.1 | hsa-miR-146a-5p | 0.038 | 0.10 | |
| hsa-miR-5188 | 0.024 | 0.1 | hsa-let-7g-5p | 0.038 | 0.10 | |
| hsa-miR-4713-3p | 0.024 | 0.1 | hsa-miR-25-3p | 0.038 | 0.10 | |
| hsa-miR-4728-5p | 0.024 | 0.1 | hsa-miR-342-3p | 0.038 | 0.10 | |
| hsa-miR-378i | 0.024 | 0.1 | hsa-miR-125a-5p | 0.039 | 0.10 | |
| hsa-miR-193a-5p | 0.024 | 0.1 | hsa-miR-21-5p | 0.043 | 0.11 | |
| hsa-miR-3667-5p | 0.025 | 0.1 | hsa-miR-130a-3p | 0.044 | 0.11 | |
| hsa-miR-3917 | 0.025 | 0.1 | hsa-miR-4313 | 0.045 | 0.12 | |
| hsa-miR-200a-3p | 0.025 | 0.1 | hsa-miR-361-5p | 0.046 | 0.12 | |
| hsa-miR-302c-5p | 0.025 | 0.1 | hsa-let-7b-5p | 0.047 | 0.12 | |
| hsa-miR-6133 | 0.025 | 0.1 | hsa-miR-6073 | 0.048 | 0.12 | |
| hsa-miR-5189 | 0.026 | 0.1 | ||||
| hsa-miR-4660 | 0.027 | 0.1 | ||||
| hsa-miR-3935 | 0.027 | 0.1 | ||||
| hsa-miR-4428 | 0.028 | 0.1 | ||||
| hsa-miR-4665-5p | 0.028 | 0.1 | ||||
| hsa-miR-3934-5p | 0.029 | 0.1 | ||||
| hsa-miR-550a-5p | 0.030 | 0.1 | ||||
| hsa-miR-760 | 0.030 | 0.1 | ||||
| hsa-miR-21-5p | 0.031 | 0.1 | ||||
| hsa-let-7a-5p | 0.031 | 0.1 | ||||
| hsa-miR-5006-5p | 0.031 | 0.1 | ||||
| hsa-miR-5001-5p | 0.031 | 0.1 | ||||
| hsa-miR-622 | 0.031 | 0.1 | ||||
| hsa-miR-3180-5p | 0.032 | 0.1 | ||||
| hsa-miR-4454 | 0.032 | 0.1 | ||||
| hsa-miR-378a-3p | 0.032 | 0.1 | ||||
| hsa-miR-6126 | 0.032 | 0.1 | ||||
| hsa-miR-766-3p | 0.033 | 0.1 | ||||
| hsa-miR-371a-5p | 0.033 | 0.1 | ||||
| hsa-miR-3622a-5p | 0.033 | 0.1 | ||||
| hsa-miR-5739 | 0.034 | 0.1 | ||||
| hsa-miR-4261 | 0.034 | 0.1 | ||||
| hsa-miR-200b-3p | 0.034 | 0.1 | ||||
| hsa-miR-4664-3p | 0.034 | 0.1 | ||||
| hsa-miR-200b-3p | 0.034 | 0.1 | ||||
| hsa-miR-4664-3p | 0.034 | 0.1 | ||||
| hsa-miR-200b-3p | 0.034 | 0.1 | ||||
| hsa-miR-4664-3p | 0.034 | 0.1 | ||||
| hsa-miR-200b-3p | 0.034 | 0.1 | ||||
| hsa-miR-4664-3p | 0.034 | 0.1 | ||||
| hsa-miR-1202 | 0.035 | 0.1 | ||||
| hsa-miR-4298 | 0.035 | 0.1 | ||||
| hsa-miR-4513 | 0.035 | 0.1 | ||||
| hsa-miR-3682-3p | 0.035 | 0.1 | ||||
| hsa-miR-1182 | 0.036 | 0.1 | ||||
| hsa-miR-215 | 0.036 | 0.1 | ||||
| hsa-miR-193b-5p | 0.037 | 0.1 | ||||
| hsa-miR-718 | 0.037 | 0.1 | ||||
| hsa-miR-4743-5p | 0.037 | 0.1 | ||||
| hsa-miR-623 | 0.037 | 0.1 | ||||
| hsa-miR-6717-5p | 0.037 | 0.1 | ||||
| hsa-miR-652-5p | 0.037 | 0.1 | ||||
| hsa-miR-320d | 0.037 | 0.1 | ||||
| hsa-miR-6510-5p | 0.039 | 0.1 | ||||
| hsa-miR-1226-5p | 0.039 | 0.1 | ||||
| hsa-miR-583 | 0.040 | 0.1 | ||||
| hsa-miR-4459 | 0.040 | 0.1 | ||||
| hsa-miR-575 | 0.040 | 0.1 | ||||
| hsa-miR-3141 | 0.040 | 0.1 | ||||
| hsa-miR-3174 | 0.040 | 0.1 | ||||
| hsa-miR-602 | 0.041 | 0.1 | ||||
| hsa-miR-6086 | 0.041 | 0.1 | ||||
| hsa-miR-4485 | 0.042 | 0.1 | ||||
| hsa-miR-6718-5p | 0.042 | 0.1 | ||||
| hsa-miR-4470 | 0.042 | 0.1 | ||||
| hsa-miR-4738-3p | 0.042 | 0.1 | ||||
| hsa-miR-4721 | 0.042 | 0.1 | ||||
| hsa-miR-3188 | 0.043 | 0.1 | ||||
| hsa-miR-211-3p | 0.044 | 0.1 | ||||
| hsa-miR-4672 | 0.044 | 0.1 | ||||
| hsa-miR-936 | 0.044 | 0.1 | ||||
| hsa-miR-194-5p | 0.044 | 0.1 | ||||
| hsa-miR-487b | 0.045 | 0.1 | ||||
| hsa-miR-6505-5p | 0.046 | 0.1 | ||||
| hsa-miR-4669 | 0.047 | 0.1 | ||||
| hsa-miR-345-5p | 0.047 | 0.1 | ||||
| hsa-miR-150-3p | 0.047 | 0.1 | ||||
| hsa-miR-3173-3p | 0.048 | 0.1 | ||||
| hsa-miR-125a-3p | 0.048 | 0.1 | ||||
| hsa-miR-3147 | 0.048 | 0.1 | ||||
| hsa-miR-4690-5p | 0.048 | 0.1 | ||||
| hsa-miR-22-3p | 0.048 | 0.1 | ||||
| hsa-miR-1185-1-3p | 0.049 | 0.1 | ||||
| hsa-miR-1287 | 0.049 | 0.1 | ||||
Footnotes
ACADEMIC EDITOR: Barbara Guinn, Editor in Chief
PEER REVIEW: Five peer reviewers contributed to the peer review report. Reviewers’ reports totaled 1084 words, excluding any confidential comments to the academic editor.
FUNDING: The study was supported by Novartis, Sigrid Jusélius Foundation, and Cancer Society of Finland. The authors confirm that the funder had no influence over the study design, content of the article, or selection of this journal.
COMPETING INTERESTS: Authors disclose no potential conflicts of interest.
Author Contributions
Conceived and designed the experiments: RG and RM. Performed the experiments: RG and NM. Analyzed the data: NN, AM, S. Khorrami, EA, and MP. Contributed reagents/materials/analysis tools: NM, VKS, and S. Knuutila. Prepared and wrote the paper: RG, NM, GA, and S. Knuutila. All the authors reviewed and approved the final manuscript.
Paper subject to independent expert blind peer review. All editorial decisions made by independent academic editor. Upon submission manuscript was subject to anti-plagiarism scanning. Prior to publication all authors have given signed confirmation of agreement to article publication and compliance with all applicable ethical and legal requirements, including the accuracy of author and contributor information, disclosure of competing interests and funding sources, compliance with ethical requirements relating to human and animal study participants, and compliance with any copyright requirements of third parties. This journal is a member of the Committee on Publication Ethics (COPE).
REFERENCES
- 1.Parkin DM, Bray F, Ferlay J, Pisani P. Global cancer statistics, 2002. CA Cancer J Clin. 2005;55(2):74–108. doi: 10.3322/canjclin.55.2.74. [DOI] [PubMed] [Google Scholar]
- 2.Ferlay J, Parkin DM, Steliarova-Foucher E. Estimates of cancer incidence and mortality in Europe in 2008. Eur J Cancer. 2010;46(4):765–781. doi: 10.1016/j.ejca.2009.12.014. [DOI] [PubMed] [Google Scholar]
- 3.Jemal A, Bray F, Center MM, Ferlay J, Ward E, Forman D. Global cancer statistics. CA Cancer J Clin. 2011;61(2):69–90. doi: 10.3322/caac.20107. [DOI] [PubMed] [Google Scholar]
- 4.Lieberman D. Progress and challenges in colorectal cancer screening and surveillance. Gastroenterology. 2010;138(6):2115–2126. doi: 10.1053/j.gastro.2010.02.006. [DOI] [PubMed] [Google Scholar]
- 5.O’Connell JB, Maggard MA, Ko CY. Colon cancer survival rates with the new American Joint Committee on Cancer sixth edition staging. J Natl Cancer Inst. 2004;96(19):1420–1425. doi: 10.1093/jnci/djh275. [DOI] [PubMed] [Google Scholar]
- 6.Garzon R, Fabbri M, Cimmino A, Calin GA, Croce CM. MicroRNA expression and function in cancer. Trends Mol Med. 2006;12(12):580–587. doi: 10.1016/j.molmed.2006.10.006. [DOI] [PubMed] [Google Scholar]
- 7.Kloosterman WP, Plasterk RH. The diverse functions of microRNAs in animal development and disease. Dev Cell. 2006;11(4):441–450. doi: 10.1016/j.devcel.2006.09.009. [DOI] [PubMed] [Google Scholar]
- 8.Bhardwaj A, Singh S, Singh AP. MicroRNA-based cancer therapeutics: big hope from small RNAs. Mol Cell Pharmacol. 2010;2(5):213–219. doi: 10.4255/mcpharmacol.10.27. [DOI] [PMC free article] [PubMed] [Google Scholar]
- 9.Aslam MI, Taylor K, Pringle JH, Jameson JS. MicroRNAs are novel biomarkers of colorectal cancer. Br J Surg. 2009;96(7):702–710. doi: 10.1002/bjs.6628. [DOI] [PubMed] [Google Scholar]
- 10.Chen X, Ba Y, Ma L, et al. Characterization of microRNAs in serum: a novel class of biomarkers for diagnosis of cancer and other diseases. Cell Res. 2008;18(10):997–1006. doi: 10.1038/cr.2008.282. [DOI] [PubMed] [Google Scholar]
- 11.Ng EK, Chong WW, Jin H, et al. Differential expression of microRNAs in plasma of patients with colorectal cancer: a potential marker for colorectal cancer screening. Gut. 2009;58(10):1375–1381. doi: 10.1136/gut.2008.167817. [DOI] [PubMed] [Google Scholar]
- 12.Cheng H, Zhang L, Cogdell DE, et al. Circulating plasma MiR-141 is a novel biomarker for metastatic colon cancer and predicts poor prognosis. PLoS One. 2011;6(3):e17745. doi: 10.1371/journal.pone.0017745. [DOI] [PMC free article] [PubMed] [Google Scholar]
- 13.Wang Q, Huang Z, Ni S, et al. Plasma miR-601 and miR-760 are novel biomarkers for the early detection of colorectal cancer. PLoS One. 2012;7(9):e44398. doi: 10.1371/journal.pone.0044398. [DOI] [PMC free article] [PubMed] [Google Scholar]
- 14.Huang Z, Huang D, Ni S, Peng Z, Sheng W, Du X. Plasma microRNAs are promising novel biomarkers for early detection of colorectal cancer. Int J Cancer. 2010;127(1):118–126. doi: 10.1002/ijc.25007. [DOI] [PubMed] [Google Scholar]
- 15.Kanaan Z, Rai SN, Eichenberger MR, et al. Plasma miR-21: a potential diagnostic marker of colorectal cancer. Ann Surg. 2012;256(3):544–551. doi: 10.1097/SLA.0b013e318265bd6f. [DOI] [PubMed] [Google Scholar]
- 16.Ahmed FE, Jeffries CD, Vos PW, et al. Diagnostic microRNA markers for screening sporadic human colon cancer and active ulcerative colitis in stool and tissue. Cancer Genomics Proteomics. 2009;6(5):281–295. [PubMed] [Google Scholar]
- 17.Link A, Balaguer F, Shen Y, et al. Fecal MicroRNAs as novel biomarkers for colon cancer screening. Cancer Epidemiol Biomarkers Prev. 2010;19(7):1766–1774. doi: 10.1158/1055-9965.EPI-10-0027. [DOI] [PMC free article] [PubMed] [Google Scholar]
- 18.Koga Y, Yasunaga M, Takahashi A, et al. MicroRNA expression profiling of exfoliated colonocytes isolated from feces for colorectal cancer screening. Cancer Prev Res (Phila) 2010;3(11):1435–1442. doi: 10.1158/1940-6207.CAPR-10-0036. [DOI] [PubMed] [Google Scholar]
- 19.Kalimutho M, Di Cecilia S, Del Vecchio Blanco G, et al. Epigenetically silenced miR-34b/c as a novel faecal-based screening marker for colorectal cancer. Br J Cancer. 2011;104(11):1770–1778. doi: 10.1038/bjc.2011.82. [DOI] [PMC free article] [PubMed] [Google Scholar]
- 20.Kalimutho M, Del Vecchio Blanco G, Di Cecilia S, et al. Differential expression of miR-144* as a novel fecal-based diagnostic marker for colorectal cancer. J Gastroenterol. 2011;46(12):1391–1402. doi: 10.1007/s00535-011-0456-0. [DOI] [PubMed] [Google Scholar]
- 21.Li JM, Zhao RH, Li ST, et al. Down-regulation of fecal miR-143 and miR-145 as potential markers for colorectal cancer. Saudi Med J. 2012;33(1):24–29. [PubMed] [Google Scholar]
- 22.Slattery ML, Wolff E, Hoffman MD, Pellatt DF, Milash B, Wolff RK. MicroRNAs and colon and rectal cancer: differential expression by tumor location and subtype. Genes Chromosomes Cancer. 2011;50(3):196–206. doi: 10.1002/gcc.20844. [DOI] [PMC free article] [PubMed] [Google Scholar]
- 23.Pfaffl MW, Horgan GW, Dempfle L. Relative expression software tool (REST) for group-wise comparison and statistical analysis of relative expression results in real-time PCR. Nucleic Acids Res. 2002;30(9):e36. doi: 10.1093/nar/30.9.e36. [DOI] [PMC free article] [PubMed] [Google Scholar]
- 24.Torrisani J, Bournet B, du Rieu MC, et al., editors. let-7 MicroRNA transfer in pancreatic cancer-derived cells inhibits in vitro cell proliferation but fails to alter tumor progression. Hum Gene Ther. 2009;20(8):831–844. doi: 10.1089/hum.2008.134. [DOI] [PubMed] [Google Scholar]
- 25.Nam EJ, Yoon H, Kim SW, et al. MicroRNA expression profiles in serous ovarian carcinoma. Clin Cancer Res. 2008;14(9):2690–2695. doi: 10.1158/1078-0432.CCR-07-1731. [DOI] [PubMed] [Google Scholar]
- 26.Ozen M, Creighton CJ, Ozdemir M, Ittmann M. Widespread deregulation of microRNA expression in human prostate cancer. Oncogene. 2008;27(12):1788–1793. doi: 10.1038/sj.onc.1210809. [DOI] [PubMed] [Google Scholar]
- 27.Tokumaru S, Suzuki M, Yamada H, Nagino M, Takahashi T. let-7 regulates Dicer expression and constitutes a negative feedback loop. Carcinogenesis. 2008;29(11):2073–2077. doi: 10.1093/carcin/bgn187. [DOI] [PubMed] [Google Scholar]
- 28.Takamizawa J, Konishi H, Yanagisawa K, et al. Reduced expression of the let-7 microRNAs in human lung cancers in association with shortened postoperative survival. Cancer Res. 2004;64(11):3753–3756. doi: 10.1158/0008-5472.CAN-04-0637. [DOI] [PubMed] [Google Scholar]
- 29.Zheng H, Zhang L, Zhao Y, et al. Plasma miRNAs as diagnostic and prognostic biomarkers for ovarian cancer. PLoS One. 2013;8(11):e77853. doi: 10.1371/journal.pone.0077853. [DOI] [PMC free article] [PubMed] [Google Scholar]
- 30.Nakajima G, Hayashi K, Xi Y, et al. Non-coding MicroRNAs hsa-let-7g and hsa-miR-181b are associated with chemoresponse to S-1 in colon cancer. Cancer Genomics Proteomics. 2006;3(5):317–324. [PMC free article] [PubMed] [Google Scholar]
- 31.Chang KH, Miller N, Kheirelseid EA, et al. MicroRNA signature analysis in colorectal cancer: identification of expression profiles in stage II tumors associated with aggressive disease. Int J Colorectal Dis. 2011;26(11):1415–1422. doi: 10.1007/s00384-011-1279-4. [DOI] [PubMed] [Google Scholar]
- 32.King CE, Wang L, Winograd R, et al. LIN28B fosters colon cancer migration, invasion and transformation through let-7-dependent and -independent mechanisms. Oncogene. 2011;30(40):4185–4193. doi: 10.1038/onc.2011.131. [DOI] [PMC free article] [PubMed] [Google Scholar]
- 33.Akao Y, Nakagawa Y, Naoe T. let-7 microRNA functions as a potential growth suppressor in human colon cancer cells. Biol Pharm Bull. 2006;29(5):903–906. doi: 10.1248/bpb.29.903. [DOI] [PubMed] [Google Scholar]
- 34.Hsu SD, Tseng YT, Shrestha S, et al. miRTarBase update 2014: an information resource for experimentally validated miRNA-target interactions. Nucleic Acids Res. 2014;42(D1):D78–D85. doi: 10.1093/nar/gkt1266. [DOI] [PMC free article] [PubMed] [Google Scholar]
- 35.Forbes SA, Beare D, Gunasekaran P, et al. COSMIC: exploring the world’s knowledge of somatic mutations in human cancer. Nucleic Acids Res. 2015;43(D1):D805–D811. doi: 10.1093/nar/gku1075. [DOI] [PMC free article] [PubMed] [Google Scholar]
- 36.Doench JG, Sharp PA. Specificity of microRNA target selection in translational repression. Genes Dev. 2004;18(5):504–511. doi: 10.1101/gad.1184404. [DOI] [PMC free article] [PubMed] [Google Scholar]
- 37.Lee YS, Dutta A. The tumor suppressor microRNA let-7 represses the HMGA2 oncogene. Genes Dev. 2007;21(9):1025–1030. doi: 10.1101/gad.1540407. [DOI] [PMC free article] [PubMed] [Google Scholar]
- 38.Mayr C, Hemann MT, Bartel DP. Disrupting the pairing between let-7 and Hmga2 enhances oncogenic transformation. Science. 2007;315(5818):1576–1579. doi: 10.1126/science.1137999. [DOI] [PMC free article] [PubMed] [Google Scholar]
- 39.Egea V, Zahler S, Rieth N, et al. Tissue inhibitor of metalloproteinase-1 (TIMP-1) regulates mesenchymal stem cells through let-7f microRNA and Wnt/β-catenin signaling. Proc Natl Acad Sci U S A. 2012;109(6):E309–E316. doi: 10.1073/pnas.1115083109. [DOI] [PMC free article] [PubMed] [Google Scholar]
- 40.He X, Duan C, Chen J, et al. Let-7a elevates p21 WAF1 levels by targeting of NIRF and suppresses the growth of A549 lung cancer cells. FEBS Lett. 2009;583(21):3501–3507. doi: 10.1016/j.febslet.2009.10.007. [DOI] [PubMed] [Google Scholar]
- 41.Sampson VB, Rong NH, Han J, et al. MicroRNA let-7a down-regulates MYC and reverts MYC-induced growth in Burkitt lymphoma cells. Cancer Res. 2007;67(20):9762–9770. doi: 10.1158/0008-5472.CAN-07-2462. [DOI] [PubMed] [Google Scholar]
- 42.Shishodia G, Shukla S, Srivastava Y, et al. Alterations in microRNAs miR-21 and let-7a correlate with aberrant STAT3 signaling and downstream effects during cervical carcinogenesis. Mol Cancer. 2015;14(1):1–13. doi: 10.1186/s12943-015-0385-2. [DOI] [PMC free article] [PubMed] [Google Scholar]
- 43.Hollis M, Shankar CL, Gambhir S, Vyas D, Nair K, Vyas A. MicroRNAs potential utility in colon cancer: early detection, prognosis, and chemosensitivity. World J Gastroenterol. 2015;21(27):8284–8292. doi: 10.3748/wjg.v21.i27.8284. [DOI] [PMC free article] [PubMed] [Google Scholar]
Associated Data
This section collects any data citations, data availability statements, or supplementary materials included in this article.
Supplementary Materials
Supplementary Table 1.
Differentially expressed miRNAs in patients with CRC versus normal subjects.
| STOOL | PLASMA | |||||
|---|---|---|---|---|---|---|
| miRNA | P-VALUE | Q-VALUE | miRNA | P-VALUE | Q-VALUE | |
| UP | hsa-miR-4642 | 0.004 | 0.1 | hsa-miR-32-3p | 0.011 | 0.07 |
| hsa-miR-617 | 0.042 | 0.1 | hsa-miR-4455 | 0.020 | 0.09 | |
| DOWN | hsa-miR-3124-5p | 9.47E-06 | 0.004 | hsa-miR-222-3p | 8.39E-05 | 0.01 |
| hsa-miR-124-3p | 8.73E-05 | 0.016 | hsa-miR-186-5p | 1.72E-04 | 0.01 | |
| hsa-miR-6511b-5p | 2.95E-04 | 0.034 | hsa-miR-744-5p | 1.82E-04 | 0.01 | |
| hsa-miR-320a | 3.61E-04 | 0.034 | hsa-miR-4291 | 4.41E-04 | 0.02 | |
| hsa-miR-4430 | 5.91E-04 | 0.036 | hsa-miR-513a-5p | 8.44E-04 | 0.03 | |
| hsa-miR-4478 | 5.95E-04 | 0.036 | hsa-let-7f-1-3p | 9.99E-04 | 0.03 | |
| hsa-miR-5008-5p | 7.13E-04 | 0.036 | hsa-miR-425-3p | 0.001 | 0.03 | |
| hsa-miR-4648 | 7.80E-04 | 0.036 | hsa-miR-98-5p | 0.002 | 0.04 | |
| hsa-miR-1236-5p | 9.74E-04 | 0.040 | hsa-miR-432-5p | 0.002 | 0.04 | |
| hsa-miR-4259 | 0.002 | 0.069 | hsa-miR-1304-3p | 0.002 | 0.04 | |
| hsa-miR-3185 | 0.002 | 0.080 | hsa-miR-4299 | 0.002 | 0.04 | |
| hsa-miR-1233-1-5p | 0.003 | 0.080 | hsa-miR-363-3p | 0.002 | 0.04 | |
| hsa-miR-4688 | 0.003 | 0.080 | hsa-miR-142-5p | 0.003 | 0.04 | |
| hsa-miR-4419b | 0.005 | 0.1 | hsa-miR-625-5p | 0.004 | 0.05 | |
| hsa-miR-5088 | 0.005 | 0.1 | hsa-miR-6508-5p | 0.004 | 0.05 | |
| hsa-miR-3678-3p | 0.005 | 0.1 | hsa-miR-18a-5p | 0.005 | 0.06 | |
| hsa-miR-1295b-3p | 0.005 | 0.1 | hsa-miR-29a-3p | 0.005 | 0.06 | |
| hsa-miR-518c-5p | 0.006 | 0.1 | hsa-miR-23b-3p | 0.005 | 0.06 | |
| hsa-miR-4776-5p | 0.007 | 0.1 | hsa-miR-26a-5p | 0.005 | 0.06 | |
| hsa-miR-663a | 0.007 | 0.1 | hsa-miR-181b-5p | 0.006 | 0.06 | |
| hsa-miR-526b-5p | 0.008 | 0.1 | hsa-miR-148a-3p | 0.007 | 0.06 | |
| hsa-miR-514b-5p | 0.009 | 0.1 | hsa-miR-29c-3p | 0.008 | 0.07 | |
| hsa-miR-1183 | 0.009 | 0.1 | hsa-miR-654-5p | 0.008 | 0.07 | |
| hsa-miR-765 | 0.009 | 0.1 | hsa-miR-26b-5p | 0.008 | 0.07 | |
| hsa-miR-3944-3p | 0.010 | 0.10 | hsa-let-7d-5p | 0.008 | 0.07 | |
| hsa-miR-1247-3p | 0.011 | 0.1 | hsa-miR-27b-3p | 0.009 | 0.07 | |
| hsa-miR-4496 | 0.011 | 0.1 | hsa-miR-5580-3p | 0.009 | 0.07 | |
| hsa-miR-3158-5p | 0.012 | 0.1 | hsa-miR-451a | 0.010 | 0.07 | |
| hsa-miR-3926 | 0.012 | 0.1 | hsa-miR-142-3p | 0.010 | 0.07 | |
| hsa-miR-4532 | 0.012 | 0.1 | hsa-miR-4728-5p | 0.010 | 0.07 | |
| hsa-miR-1229-5p | 0.013 | 0.1 | hsa-miR-19a-3p | 0.011 | 0.07 | |
| hsa-miR-494 | 0.014 | 0.1 | hsa-miR-629-5p | 0.011 | 0.07 | |
| hsa-miR-3911 | 0.014 | 0.1 | hsa-miR-103a-3p | 0.012 | 0.07 | |
| hsa-miR-3605-5p | 0.014 | 0.1 | hsa-miR-15a-5p | 0.013 | 0.07 | |
| hsa-miR-3648 | 0.015 | 0.1 | hsa-miR-331-3p | 0.013 | 0.07 | |
| hsa-miR-4444 | 0.015 | 0.1 | hsa-miR-933 | 0.014 | 0.07 | |
| hsa-let-7f-5p | 0.015 | 0.1 | hsa-miR-140-3p | 0.016 | 0.09 | |
| hsa-miR-4793-5p | 0.016 | 0.1 | hsa-miR-106b-5p | 0.017 | 0.09 | |
| hsa-miR-4667-5p | 0.016 | 0.1 | hsa-miR-107 | 0.018 | 0.09 | |
| hsa-miR-3130-3p | 0.016 | 0.1 | hsa-miR-4323 | 0.018 | 0.09 | |
| hsa-miR-1203 | 0.017 | 0.1 | hsa-miR-151a-5p | 0.019 | 0.09 | |
| hsa-miR-4515 | 0.017 | 0.1 | hsa-miR-652-3p | 0.020 | 0.09 | |
| hsa-miR-4486 | 0.018 | 0.1 | hsa-miR-409-3p | 0.020 | 0.09 | |
| hsa-miR-877-5p | 0.018 | 0.1 | hsa-let-7f-5p | 0.021 | 0.09 | |
| hsa-miR-4451 | 0.018 | 0.1 | hsa-miR-20b-5p | 0.023 | 0.09 | |
| hsa-miR-631 | 0.018 | 0.1 | hsa-miR-378i | 0.023 | 0.09 | |
| hsa-miR-5190 | 0.018 | 0.1 | hsa-miR-16-5p | 0.023 | 0.09 | |
| hsa-miR-874 | 0.019 | 0.1 | hsa-miR-199a-3p | 0.023 | 0.09 | |
| hsa-miR-4271 | 0.019 | 0.1 | hsa-miR-27a-3p | 0.026 | 0.10 | |
| hsa-miR-1260a | 0.019 | 0.1 | hsa-miR-148b-3p | 0.027 | 0.10 | |
| hsa-miR-192-5p | 0.019 | 0.1 | hsa-miR-1236-5p | 0.027 | 0.10 | |
| hsa-miR-141-3p | 0.020 | 0.1 | hsa-let-7b-3p | 0.028 | 0.10 | |
| hsa-miR-601 | 0.020 | 0.1 | hsa-miR-223-3p | 0.028 | 0.10 | |
| hsa-miR-3680-3p | 0.020 | 0.1 | hsa-miR-423-3p | 0.029 | 0.10 | |
| hsa-miR-4419a | 0.021 | 0.1 | hsa-miR-663a | 0.029 | 0.10 | |
| hsa-miR-4746-3p | 0.021 | 0.1 | hsa-let-7a-5p | 0.029 | 0.10 | |
| hsa-miR-3676-5p | 0.021 | 0.1 | hsa-miR-122-5p | 0.030 | 0.10 | |
| hsa-miR-640 | 0.022 | 0.1 | hsa-miR-221-3p | 0.031 | 0.10 | |
| hsa-miR-4778-5p | 0.022 | 0.1 | hsa-let-7c | 0.031 | 0.102 | |
| hsa-miR-3202 | 0.022 | 0.1 | hsa-miR-671-3p | 0.033 | 0.10 | |
| hsa-miR-3135b | 0.022 | 0.1 | hsa-miR-130b-3p | 0.033 | 0.10 | |
| hsa-miR-4634 | 0.023 | 0.1 | hsa-miR-151b | 0.034 | 0.10 | |
| hsa-miR-33a-3p | 0.023 | 0.1 | hsa-miR-30b-5p | 0.034 | 0.10 | |
| hsa-miR-4429 | 0.023 | 0.1 | hsa-miR-15b-5p | 0.034 | 0.10 | |
| hsa-miR-483-5p | 0.023 | 0.1 | hsa-miR-185-5p | 0.036 | 0.10 | |
| hsa-miR-4640-3p | 0.023 | 0.1 | hsa-miR-23a-3p | 0.036 | 0.10 | |
| hsa-miR-4465 | 0.023 | 0.1 | hsa-miR-150-5p | 0.037 | 0.10 | |
| hsa-miR-3200-5p | 0.024 | 0.1 | hsa-miR-146a-5p | 0.038 | 0.10 | |
| hsa-miR-5188 | 0.024 | 0.1 | hsa-let-7g-5p | 0.038 | 0.10 | |
| hsa-miR-4713-3p | 0.024 | 0.1 | hsa-miR-25-3p | 0.038 | 0.10 | |
| hsa-miR-4728-5p | 0.024 | 0.1 | hsa-miR-342-3p | 0.038 | 0.10 | |
| hsa-miR-378i | 0.024 | 0.1 | hsa-miR-125a-5p | 0.039 | 0.10 | |
| hsa-miR-193a-5p | 0.024 | 0.1 | hsa-miR-21-5p | 0.043 | 0.11 | |
| hsa-miR-3667-5p | 0.025 | 0.1 | hsa-miR-130a-3p | 0.044 | 0.11 | |
| hsa-miR-3917 | 0.025 | 0.1 | hsa-miR-4313 | 0.045 | 0.12 | |
| hsa-miR-200a-3p | 0.025 | 0.1 | hsa-miR-361-5p | 0.046 | 0.12 | |
| hsa-miR-302c-5p | 0.025 | 0.1 | hsa-let-7b-5p | 0.047 | 0.12 | |
| hsa-miR-6133 | 0.025 | 0.1 | hsa-miR-6073 | 0.048 | 0.12 | |
| hsa-miR-5189 | 0.026 | 0.1 | ||||
| hsa-miR-4660 | 0.027 | 0.1 | ||||
| hsa-miR-3935 | 0.027 | 0.1 | ||||
| hsa-miR-4428 | 0.028 | 0.1 | ||||
| hsa-miR-4665-5p | 0.028 | 0.1 | ||||
| hsa-miR-3934-5p | 0.029 | 0.1 | ||||
| hsa-miR-550a-5p | 0.030 | 0.1 | ||||
| hsa-miR-760 | 0.030 | 0.1 | ||||
| hsa-miR-21-5p | 0.031 | 0.1 | ||||
| hsa-let-7a-5p | 0.031 | 0.1 | ||||
| hsa-miR-5006-5p | 0.031 | 0.1 | ||||
| hsa-miR-5001-5p | 0.031 | 0.1 | ||||
| hsa-miR-622 | 0.031 | 0.1 | ||||
| hsa-miR-3180-5p | 0.032 | 0.1 | ||||
| hsa-miR-4454 | 0.032 | 0.1 | ||||
| hsa-miR-378a-3p | 0.032 | 0.1 | ||||
| hsa-miR-6126 | 0.032 | 0.1 | ||||
| hsa-miR-766-3p | 0.033 | 0.1 | ||||
| hsa-miR-371a-5p | 0.033 | 0.1 | ||||
| hsa-miR-3622a-5p | 0.033 | 0.1 | ||||
| hsa-miR-5739 | 0.034 | 0.1 | ||||
| hsa-miR-4261 | 0.034 | 0.1 | ||||
| hsa-miR-200b-3p | 0.034 | 0.1 | ||||
| hsa-miR-4664-3p | 0.034 | 0.1 | ||||
| hsa-miR-200b-3p | 0.034 | 0.1 | ||||
| hsa-miR-4664-3p | 0.034 | 0.1 | ||||
| hsa-miR-200b-3p | 0.034 | 0.1 | ||||
| hsa-miR-4664-3p | 0.034 | 0.1 | ||||
| hsa-miR-200b-3p | 0.034 | 0.1 | ||||
| hsa-miR-4664-3p | 0.034 | 0.1 | ||||
| hsa-miR-1202 | 0.035 | 0.1 | ||||
| hsa-miR-4298 | 0.035 | 0.1 | ||||
| hsa-miR-4513 | 0.035 | 0.1 | ||||
| hsa-miR-3682-3p | 0.035 | 0.1 | ||||
| hsa-miR-1182 | 0.036 | 0.1 | ||||
| hsa-miR-215 | 0.036 | 0.1 | ||||
| hsa-miR-193b-5p | 0.037 | 0.1 | ||||
| hsa-miR-718 | 0.037 | 0.1 | ||||
| hsa-miR-4743-5p | 0.037 | 0.1 | ||||
| hsa-miR-623 | 0.037 | 0.1 | ||||
| hsa-miR-6717-5p | 0.037 | 0.1 | ||||
| hsa-miR-652-5p | 0.037 | 0.1 | ||||
| hsa-miR-320d | 0.037 | 0.1 | ||||
| hsa-miR-6510-5p | 0.039 | 0.1 | ||||
| hsa-miR-1226-5p | 0.039 | 0.1 | ||||
| hsa-miR-583 | 0.040 | 0.1 | ||||
| hsa-miR-4459 | 0.040 | 0.1 | ||||
| hsa-miR-575 | 0.040 | 0.1 | ||||
| hsa-miR-3141 | 0.040 | 0.1 | ||||
| hsa-miR-3174 | 0.040 | 0.1 | ||||
| hsa-miR-602 | 0.041 | 0.1 | ||||
| hsa-miR-6086 | 0.041 | 0.1 | ||||
| hsa-miR-4485 | 0.042 | 0.1 | ||||
| hsa-miR-6718-5p | 0.042 | 0.1 | ||||
| hsa-miR-4470 | 0.042 | 0.1 | ||||
| hsa-miR-4738-3p | 0.042 | 0.1 | ||||
| hsa-miR-4721 | 0.042 | 0.1 | ||||
| hsa-miR-3188 | 0.043 | 0.1 | ||||
| hsa-miR-211-3p | 0.044 | 0.1 | ||||
| hsa-miR-4672 | 0.044 | 0.1 | ||||
| hsa-miR-936 | 0.044 | 0.1 | ||||
| hsa-miR-194-5p | 0.044 | 0.1 | ||||
| hsa-miR-487b | 0.045 | 0.1 | ||||
| hsa-miR-6505-5p | 0.046 | 0.1 | ||||
| hsa-miR-4669 | 0.047 | 0.1 | ||||
| hsa-miR-345-5p | 0.047 | 0.1 | ||||
| hsa-miR-150-3p | 0.047 | 0.1 | ||||
| hsa-miR-3173-3p | 0.048 | 0.1 | ||||
| hsa-miR-125a-3p | 0.048 | 0.1 | ||||
| hsa-miR-3147 | 0.048 | 0.1 | ||||
| hsa-miR-4690-5p | 0.048 | 0.1 | ||||
| hsa-miR-22-3p | 0.048 | 0.1 | ||||
| hsa-miR-1185-1-3p | 0.049 | 0.1 | ||||
| hsa-miR-1287 | 0.049 | 0.1 | ||||