Abstract
In this study, the swelling kinetics of individual tea particles as well as bed of tea granules were investigated for different types of teas. The swelling experiments involved image analysis and volume measurements of tea particles. Each individual particle shows different swelling characteristics. Separating funnels and cylindrical columns of varying sizes were used to study the changes in volume of tea bed. Swelling in separating funnel was observed to be more than that in column. The effect of temperature, particle size, bed height and vessel diameter were investigated. The extent as well as the rate of swelling is found to increase with rise in temperature (60 to 80 °C) and reduction in particle size. A decrease in swelling is observed with increase in bed height as well as decrease in vessel diameter and vice a versa. About 70 to 75 % swelling occurs in the first 40 to 45 s. Two empirical models viz. Weibull and Peleg were used to fit the experimental data. The rate parameters obtained for a sample T5 at different temperatures were in the range of 0.012 to 0.016. The volume changes of all the teas were compared with their elution behavior, by measuring the absorbance of a diluted sample of brew at 272 nm. The activation energies for the process of tea swelling calculated for T1 (1.2 mm), T5 (2.2 mm) and T5 (0.72 mm) were 14.156, 8.37 and 13.42 kJ/mol respectively.
Keywords: Swelling, Kinetics, Tea, Weibull, Model, Image analysis
Introduction
Tea is one of the most common and widely used beverage in world. Rehydration of tea is the most important process that occurs once the tea leaves are immersed in water. The phenomenon of hydration is always accompanied with swelling (Aguerre et al. 2008). It is the uptake of water inside the structure that causes swelling. Hence, this process is of vital importance. As soon as the food material comes in contact with water, it diffuses inside the porous structure. This results in increase in its volume or geometric dimensions. Increase in volume or geometric dimensions due to water uptake is regarded as swelling. Two types of swelling are generally observed in case of food materials : isotropic and anisotropic (Barbosa-Canovas et al. 2006). Isotropic swelling is the uniform increase in volume in all dimensions. Anisotropic swelling develops in different geometric dimensions. The swelling of tea leaf or any food material is proportional to the volume of water absorbed. The transient capillary structure and internal structure of tea leaves are responsible for its swelling characteristics. The cell walls, tissues etc. are some of the parts of the leaves that swell during hydration.
To understand swelling it is necessary to have some knowledge on the process of hydration. There are many studies on modeling the hydration of foodstuffs and the governing mechanisms. These studies are briefly discussed as follows. Empirical and semi-empirical models such as Peleg and Weibull were used to fit the hydration kinetics of various foodstuffs such as pasta (Cunningham et al. 2007), tomato (Goula and Adamopoulos 2009), breakfast cereals (Machado et al. 1998) etc. The hydration of rice was modeled using Fick’s law of diffusion as the governing mechanism (Bakalis et al. 2009). Hydration studies have been done on black leaf tea Assam (Weerts et al. 2003b) and green tea (Weerts et al. 2003a). They discovered that the hydration mechanism in tea leaves is due to the capillary movement in the pores. The hydration kinetics of the tea was modeled with the use of Darcy’s law. Darcy’s law states that flux of water through a medium is expressed as the ratio of forces acting to push the fluid through the medium to the resistance to flow which characterizes the medium.
In the formulation of models in hydration studies of pasta (Cunningham et al. 2007), tomato (Goula and Adamopoulos 2009), breakfast cereals (Machado et al. 1998) etc. as described above the phenomenon of swelling was neglected. Few studies have been reported in the literature regarding the swelling kinetics of foodstuffs. The swelling of high moisture whey protein gels was studied by Oztop and McCarthy (2011). These protein gels were made of cylindrical shape with lengths varying from 5 to 20 mm. The swelling experiment consisted of placing the gels in fine mesh baskets which were suspended in double wall beakers containing water. The experiment was carried out at room temperature. As soon as the baskets were placed in water, time was recorded. The mass of the gel was monitored by periodically removing the sample from the solution. Theoretical modeling was done based on the assumption that the hydration takes place due to Fick’s law of diffusion. These experiments cannot be replicated in our case as the time scale is very different. Tea particles swell in few seconds and hence it is very difficult to monitor its mass by periodic removal of samples. The assumptions involved in the theoretical based modeling using Fick’s law does not hold true in our case. The phenomenon is much more complex in case of tea particles wherein the hydration is due to capillary action as stated by Weerts et al. (2003b).
Ramesh (2001) and Shinde et al. (2014) have studied the swelling kinetics of rice using the image analysis approach. The rice grains were selected at random and placed in a water bath. A CCD (charged couple device) camera was placed at a height to observe the water bath from the top. Images were taken at regular intervals and analyzed. The instantaneous shape and size of rice was measured during the cooking process. The measured area of rice grains was converted into swelling ratios.
Malumba et al. (2013) studied the swelling of wheat starch granules. The swelling experiments were done by spraying a 20 g of sample inside an agitated vessel containing 1 L of water. During the experiment 20 ml samples were withdrawn. These samples were mixed with ice in order to stop swelling.
Miyagawa et al. (1995) is the only author to have reported the swelling of teas. They measured the heat of swelling of green tea with the help of a conductive calorimeter. The heat of swelling was divided into two components namely, heat of tea extract and heat of tea ghost. Tea ghost is the residue of tea that is left behind after the infusion is carried out. It can be considered as tea without its water soluble components. Thus heat of swelling was expressed as a sum of heat of dissolution of water soluble compounds and heat of water insoluble tea ghost. The heat of dissolution was found to be endothermic where as the heat of swelling for tea ghost was exothermic. However the swelling kinetics or behavior was not studied.
Mathematical models for hydration in foods
Empirical and semi-empirical models such as Peleg and Weibull were the most commonly used models to fit the hydration kinetics of various foodstuffs. For e.g. pasta (Cunningham et al. 2007) and tomato (Goula and Adamopoulos 2009). These models are listed below.
Weibull model :
| 1 |
Where, Mt is the moisture content (kg H2O/kg of dry material) at any time t (min), M0 is the initial moisture content and M∞ is the moisture content at equilibrium. The constants α and β are known as the Weibull parameters. α is termed as shape parameter and β is the rate parameter (min).
Peleg model:
| 2 |
Where, k1 and k2 are the Peleg constants. k1 is termed as the rate parameter (min) and k2 is the capacity constant.
Mathematical models for swelling in foods
Malumba et al. (2013) fitted different kinetic models to predict the swelling of starch granules. A dimensionless parameter α was introduced to compare the swelling measurements of various experiments. Values of α varies from 0 to 1. Value of α is 0 at t = 0 that means the swelling is not yet started. Value of α is 1 at t = ‘t’ min, which suggests that the swelling is complete within time ‘t’ min i.e. the particles have swelled to their maximum extent at the particular conditions. This parameter α is the ratio of increase in diameter at any time ‘t’ to maximum increase in diameter.
| 3 |
Where, Dt is the instantaneous diameter of the granules at any time t, D0 is the initial diameter and Df is the final equilibrium diameter of the granules attained after complete swelling. Some of the models described were the first order, second order and third order kinetic models given below.
- First order kinetic model:
4 - second order kinetic model:
5 - third order kinetic model:
6
Where, k is the rate constant for the respective model.
Empirical models such as Weibull and Peleg models were developed to fit the time temperature dependence of swelling (Malumba et al. 2013).
Weibull model:
| 7 |
Where, C1 and C2 are Temperature dependent Weibull constants and t is time in seconds. Another model developed was Peleg model which is described in detail in the modeling section.
In the present study we have used a different approach to model the swelling kinetics of teas. The Weibull and Peleg models used in modeling the hydration of foodstuffs (Machado et al. 1998; Cunningham et al. 2007; Goula and Adamopoulos 2009) described above were adapted and modified to fit the kinetics of swelling.
In all the work done by several authors, the swelling kinetics of teas has not been reported. The present paper deals with the following objectives:
Characterization of swelling kinetics of tea particles with respect to different aspects such as temperature, particle size, tea bed height etc.
To present a model which correlates the swelling behavior
Materials and methods
Raw materials
Two types of CTC (crush, tear and curl) tea based on different tea-scores (Tea score-1 & Tea score-5) were used in this study. The tea samples were provided by Unilever Ind. Ltd., Bangalore. Tea scores 1 and 5 were assigned as per the sensory perceptions of tea samples evaluated by different tea tasters. Higher tea score implies stronger sensory perception. Other than the above, two different CTC brands ‘X’ and ‘Y’ were also procured from the market for comparison. All swelling experiments were done using distilled water.
Single particle swelling
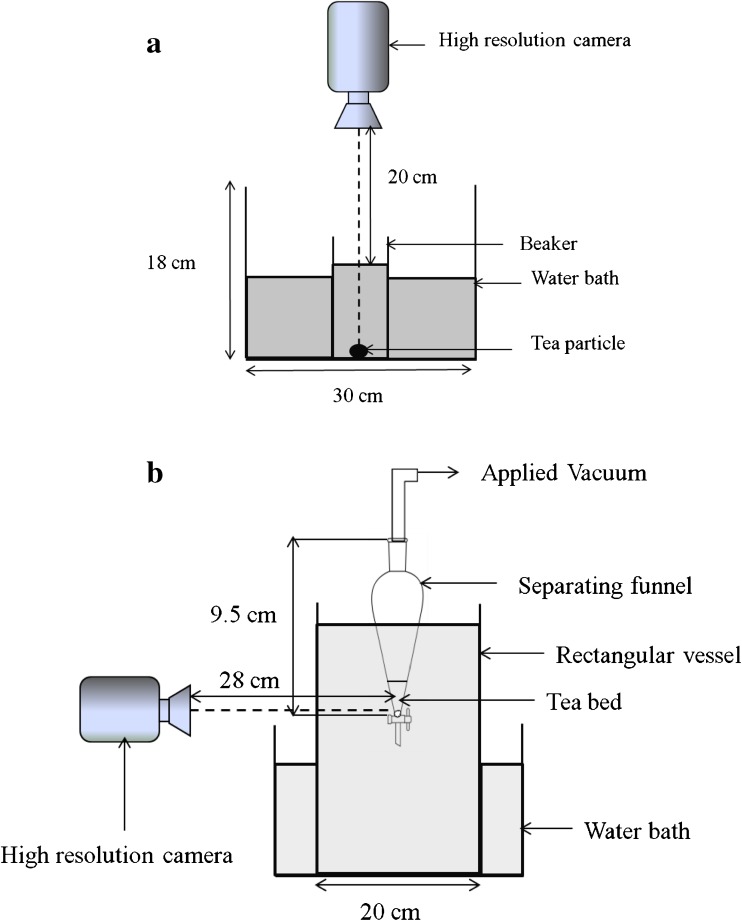
Individual tea granules were taken randomly from as received tea samples (T1 and T5). A beaker containing distilled water was maintained at constant temperature (70 °C) by a Water Bath (Ganesh Scientific, Mumbai). The beaker was placed under a high resolution camera (1920 × 1080, Sony DSC-HX-20V) mounted on a stand at a fixed height. The schematic diagram of the setup is shown in Fig. 1a. A single particle was introduced in the beaker and a video was recorded for about 2 min. Images at different time intervals were extracted from the video by video editing software (Windows Movie Maker 2.6). Within the first 10 s, images were taken at an interval of 1 s, from 10 s to 1 min, images were taken at an interval of 5 s and after 1 min, the time interval was 10 s. These images were analyzed to obtain the diameter of the particle at each instant using image analysis software, as discussed in the next section. The change in diameter was correlated to % change in volume of particle to get the swelling kinetics. This procedure was repeated for a number of particles with different sizes. To obtain smaller size particles, sample T5 was ground in a mixer. The ground tea was then passed through four different sized sieves (1000, 820, 710 and 500 μm) to get fractions of narrow size range.
Fig. 1.
Schematic representation of setup for a single particle swelling and b swelling of tea granules
Image analysis
The images of the particles obtained at different time intervals were correlated to their diameter by using image analysis. Ramesh (2001) and Shinde et al. (2014) have used this technique to study the cooking kinetics of rice. This software based analysis has been applied to various fields such as identifying grain samples according to wheat variety, shape inspection of potatoes, rice, broken corn cereals (Ramesh 2001). The software (ImageJ2x) measures the projected area of the particle by counting the number of pixels occupied by it. Assuming the tea particle to be a sphere, its projected image on a 2-D plane would be a circle. Hence, the diameter of the particle was estimated as
| 8 |
Where Aproj is the projected area of particle and dp is the diameter of the particle in pixels. An image of microscope slide of known dimension was captured. Length of one of its edges was measured from the image in pixels. The ratio of length of the slide in mm to that in pixels was used for conversion from pixels to mm.
Swelling of tea granules
Tea particles from both the tea samples with initial weight of 0.5 g were taken in a glass column (diameter-10 mm) which had a sintered glass filter disk at the bottom to support the tea bed. The glass column was dipped in a large rectangular glass vessel containing distilled water. Temperature of water was maintained at 60 °C by placing the setup in a water bath. A high resolution camera as mentioned earlier was mounted on a stand in front of the setup to observe the tea bed. The suction line of a peristaltic pump (Enertech, ENPD400 express) was fixed at the top of the column to apply vacuum. The experimental setup is similar to the one shown in Fig. 1b where the funnel is replaced by a glass column. The vacuum applied enables the water from the vessel to enter the glass column from the bottom and wet the tea bed. The speed of peristaltic pump was adjusted to about 2 rpm. As the water reached the tea bed, a video of about 2 min was recorded to observe its behavior. After a sufficient level of water was attained for the tea bed to swell, the pump was stopped. Images at different time intervals were taken by the same method as discussed in single particle swelling. At each time point, the height of the tea bed was noted. The change in height was correlated to % change in volume of tea bed to get the swelling kinetics. These experiments were also done in different sized columns (6, 10 and 16 mm). To assess the effect of diameter of column on swelling, the initial height of the tea bed was kept same (22 mm) in all the cases. Similarly, the effect of height of tea bed on swelling was studied. Different amounts of tea such as 0.5, 1 and 2 g, with their corresponding bed heights 17, 28 and 57 mm respectively, were taken in the sintered glass column of diameter 10 mm. At each initial height of tea bed, the swelling was recorded.
Swelling of tea bed was also done in a separating funnel. This swelling was confined to the lower conical section of the funnel. Tea bed was supported at the bottom with cotton plug. The schematic representation of the setup with separating funnel is shown in Fig. 1b. The conical section was extended by image editing to get the apex of the cone. The angle at the apex (θ) was measured by image analysis software and the volume of the cone was calculated as
| 9 |
Where, h is the height of the cone from the top surface of the tea bed to the apex. Hence, by knowing the total volume of cone, volume of tea bed was calculated and % volume change with time was obtained. For each set of tea samples of T1 and T5, the experiments were done at 50, 60, 70 and 80 °C respectively. Tea sample T5 was ground in a mixer and then passed through different sized sieves as mentioned earlier. Fraction size retaining on 820 and 500 μm were taken for further studies to have the effect of particle size on swelling characteristics of tea bed. For these experiments the speed of peristaltic pump was adjusted to 1 rpm to avoid fluidization of the particles.
Initial size measurement of each particle cut size and original samples was done by image analysis. Since, each set contains a range of particle sizes, Sauter mean diameter (d32) was determined which gives an average of particle sizes (Merkus 2009).
| 10 |
The swelling experiments were repeated for the two brands ‘X’ and ‘Y’ at 60 °C for comparison.
Kinetic studies were carried out up to 2 min at 60 °C by infusing 2 g of tea particles of T5, T1, X and Y in 100 ml distilled water. Samples of the infusion were taken at 30, 60 and 120 s and their absorbance was measured using UV-visible spectrophotometer (Varian CARY 50 Conc, Agilent) at 272 nm. Gallic acid (GA) is a base molecule for most of tea Polyphenols (Harbowy and Balentine 1997). Hence, Gallic acid was used as standard for calibration of absorbance at 272 nm wavelength. Using the developed calibration equation, absorbance of tea infusion samples was converted to Gallic Acid Equivalence (GAE). GAE is not the amount of Gallic acid that would be present in infusion but the equivalent amount of Gallic acid which would give same absorbance. The GAE values are used as a measure of extent of elution of polyphenols from tea. To obtain relationship between quality of tea and swelling, fractional volume changes of all tea types and brands were compared with their corresponding GAE values.
The effect of height of the bed of tea granules on volume changes was studied in a 25 ml funnel at 60 °C with different amounts of tea 0.5, 1, 2 and 4 g. Their corresponding heights were 26, 38, 46 and 54 mm respectively.
Mathematical modeling
A dimensionless swelling parameter ‘α’ as explained in Eq. 3 was used to compare the swelling measurements of various experiments.
Weibull model
Weibull’s probabilistic distribution model has found a variety of applications in food engineering (Eq. 1). This model has been used to describe sorption kinetics of different food materials such as breakfast cereals (Machado et al. 1998), pasta (Cunningham et al. 2007), tomatoes (Goula and Adamopoulos 2009) etc. A similar model was deduced to describe swelling kinetics of tea particles.
| 11 |
Where, ϕ and λ are termed as Weibull constants. λ represents the rate parameter. It is similar to the term 1/β used in Eq. 1. This term signifies the rate of swelling kinetics which increases with increasing temperature. The dependence of λ on temperature can be calculated by Arrhenius type of equation,
| 12 |
Where, E is the activation energy of the process (kJ/mol). R is the universal gas constant (kJ kmol−1 K−1), T is Temperature (K) and λ0 is the pre-exponential factor (s−1). Using this expression, activation energy of swelling can be estimated. Weibull constant ϕ is the shape parameter which is similar to the one used in modeling of moisture sorption kinetics of breakfast cereals (Machado et al. 1998). Change in values of ϕ affects the shape of the swelling curve which indicates the nature of the process.
Peleg model
Peleg (1988) had proposed a model for moisture sorption kinetics for a variety of foodstuffs such as milk powder, soaking of rice etc. (Eq. 2). This model was modified for the swelling phenomenon of starch granules (Malumba et al. 2013)
| 13 |
Where, P1 and P2 are termed as Peleg constants. P1 represents the rate parameter for swelling with unit of time. Inverse of P1 is the rate constant for the swelling process. The parameter P2 is similar to term k2 used in Eq. 2. Inverse of P2 represents the maximum swelling possible.
Results and discussion
Single particle swelling
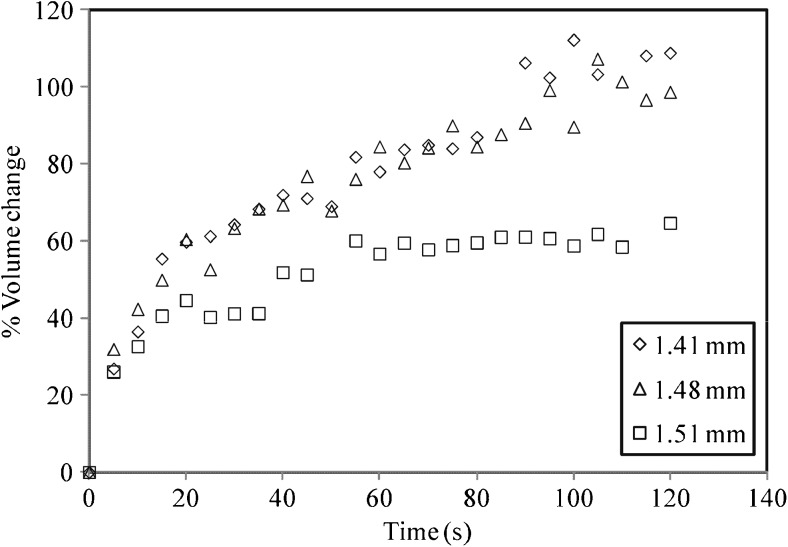
Swelling experiments carried out for individual tea particle yields some contrasting results. The percentage change in volume of three particles within range of 1.4 to 1.5 mm is shown in Fig. 2. It is seen that the swelling is rapid up to about 30–35 s and afterwards it approaches to a steady state value. The change in volume of the particles is minimal after 1 min. The nature of the curve suggests that swelling is essentially complete within 2 min. The size of the three particles considered (1.41, 1.48 and 1.51 mm) are fairly similar. However the swelling behavior observed is widely different. The swelling of 1.41 and 1.48 mm particle is similar i.e. about 98 and 102 % respectively (with respect to initial volume). However 1.51 mm particle shows considerably less swelling (64 %). This behavior of particles of same size suggests that the swelling for each and every particle is different. This may be due to the fact that these tea particles have originated from different parts of tea leaves such as the midrib and the lamina portion. These parts differ in their hydration characteristics and hence may result in different swelling. Weerts et al. (2003a) have reported the anisotropic effect in rehydration of black leaf tea Assam. They observed that the rate of hydration from cut-edges was 45 to 200 times faster than that from top or bottom surfaces of tea leaves. Other possible reasons might be the variation in porosity and hydrophilicity of tea particles.
Fig. 2.
Swelling behavior of particles of same size of T1 at 70 °C
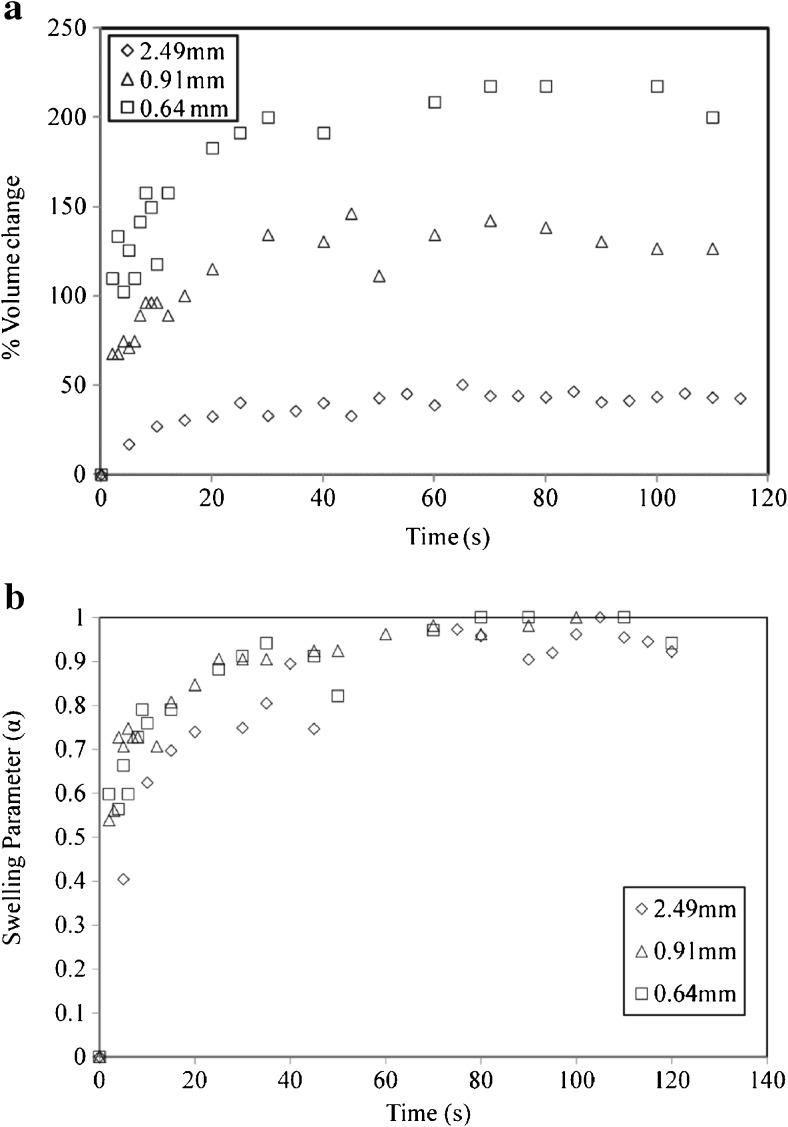
To elucidate the effect of particle size on single particle swelling, particles of wide range of sizes were taken. The effect of particle size on the rate of swelling for T5 at 70 °C is illustrated in Fig. 3a. It can be seen that with decrease in particle size from 2.49 to 0.64 mm, there is an increase in swelling. The final swelling for 2.49, 0.91 and 0.64 mm was 42, 126 and 217 % respectively. Comparing 2.49 and 0.91 mm particle, as size is reduced by a factor of 2.41, swelling increases by about three times. As particle size is reduced much further by a factor of 3.43, the swelling is increased by five times. These results also show that the swelling is faster for 0.64 mm particle than 2.49 mm particle. Faster kinetics for smaller tea particles is mainly due to enhanced surface area of smaller tea particles compared to larger ones for hydration and diffusion of water. For larger sized particle, water may not be able to reach or penetrate its micro-porous structure which results in less swelling. For lower sized particles, the micro-porous structure is exposed to water more easily and hence more swelling is observed.
Fig. 3.
Swelling behavior of a particles of different size for T5 at 70 °C; b swelling parameter with time for different particle sizes of T5 at 70 °C
Relation between dimensionless swelling parameter and time for different particles is depicted in Fig. 3b. The graph shows that the change of swelling parameter with time is more or less similar for all the particle sizes. The plot illustrates that about 75 to 80 % of maximum swelling occurs within first 20 to 25 s. After 25 s the rate of swelling becomes slower and eventually becomes constant at the end of 2 min. Though each particle shows different extent of swelling, the rate at which the particle attains its final size is similar for each of them. All these results show that maximum of the swelling is complete within first few seconds of water infusion. This result would be useful in modeling the kinetics of tea infusions.
The effect of temperature on single particle swelling is not re-producible because of the fact that the swelling characteristic of each particle is different. Hence to have a better understanding of the effect of temperature on swelling characteristics; further experiments were carried out with a bed of tea particles.
Swelling of tea bed
Swelling experiments of tea bed were initially done in a glass column and a separating funnel described earlier. The results of the experiment are tabulated in Table 1. For glass column, only 21.5 % swelling was observed within 2 min. For separating funnel, the swelling increased to about 38 %. It is seen that at each instant, the swelling observed in separating funnel is much more than that in glass column. In the glass column, as soon as swelling starts it becomes closely packed. The geometry of the column resists free swelling of tea particles from all sides. The size of the particle is allowed to increase only in one dimension. This results in much lower swelling. The tea particles should be provided with sufficient space for them to swell completely. The geometry of the separating funnel provides larger space for the tea bed to swell than the column. The implications of these studies are to look towards the swelling behavior of tea bags. Tea bags have flexible walls and hence the studies with separating funnel are more likely to provide data applicable to tea bags.
Table 1.
Swelling of T5 at 60 °C in a glass column and conical funnel
| Swelling in glass column | Swelling in conical funnel | ||
|---|---|---|---|
| Time (min) | % Increase in volume | Time (min) | % Increase in volume |
| 0 | 0 | 0 | 0 |
| 0.5 | 12.5 | 0.5 | 16.22 |
| 1 | 18.5 | 1 | 28.78 |
| 2 | 21.5 | 2 | 38.07 |
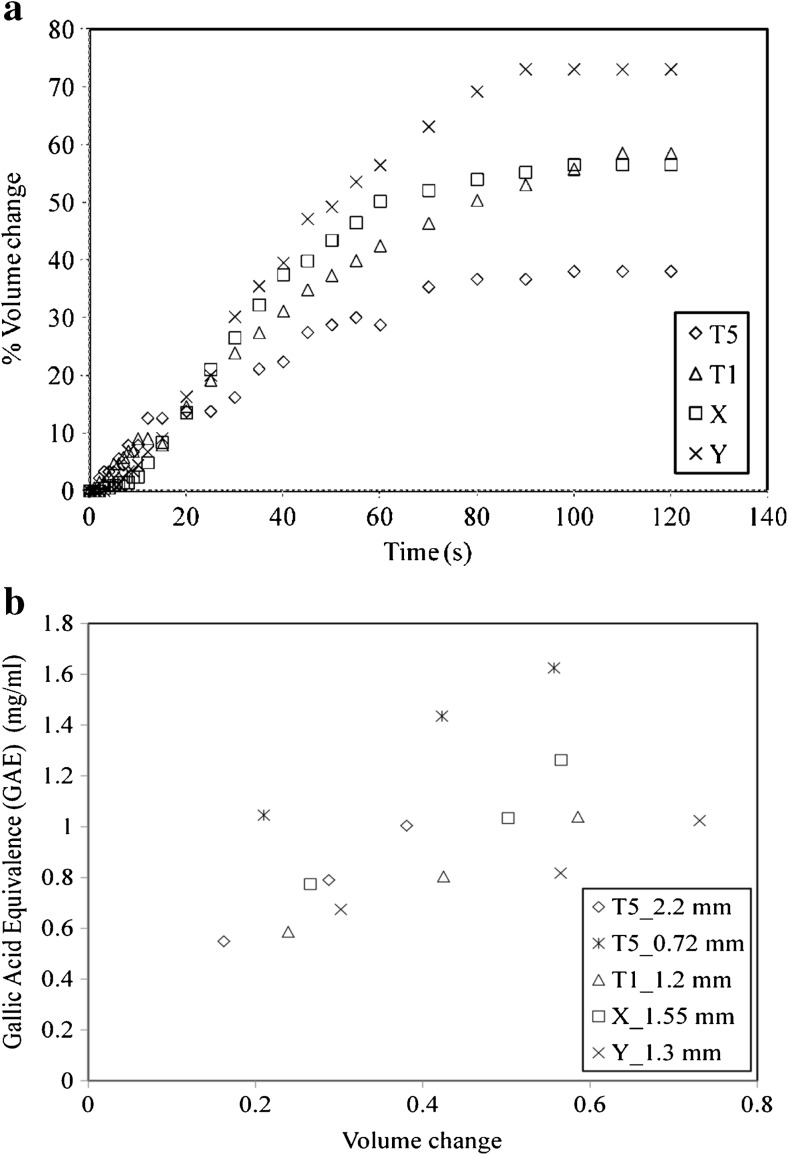
The swelling of tea particles of T5, T1 and various other brands has been illustrated in Fig. 4a. The Sauter mean diameter of tea samples T1, T5, X and Y calculated by image analysis is found to be 1.2, 2.2, 1.64 and 1.29 mm respectively. It can be seen that T1 and X shows similar swelling i.e. 58.5 and 56 % respectively. The swelling of T5 is much lesser (38 %) whereas the swelling of Y brand is the maximum (73 %). Thus the property of swelling is dependent on brand type. The processing conditions, locality, origins and various other factors are distinct for each and every brand of tea considered. This results in different swelling characteristics. Also the phenomenon of swelling is dependent on various parameters as discussed earlier. Particle size also plays an important role in swelling kinetics. The particle size of T5 is much larger which explains its lesser swelling than other brands. A plot of GAE v/s volume change (ratio of change in volume to initial volume) for different teas is depicted in Fig. 4b. It can be seen that each brand shows an increase. The trend of increase in GAE with swelling is different for each tea. Tea brand Y which has maximum swelling shows a lower GAE in the brew relative to other types. Similarly T5 which has least swelling shows a steep increasing trend. The plot for 0.72 mm particles of T5 is above the other curves because of its enhanced swelling. This study indicates that there is a relation between tea infusion quality and swelling which explains its significance.
Fig. 4.
Comparison of T5, T1, X and Y at 60 °C. a Swelling kinetics; b Relation between volume change and GAE (mg/ml)
Effect of temperature on tea bed
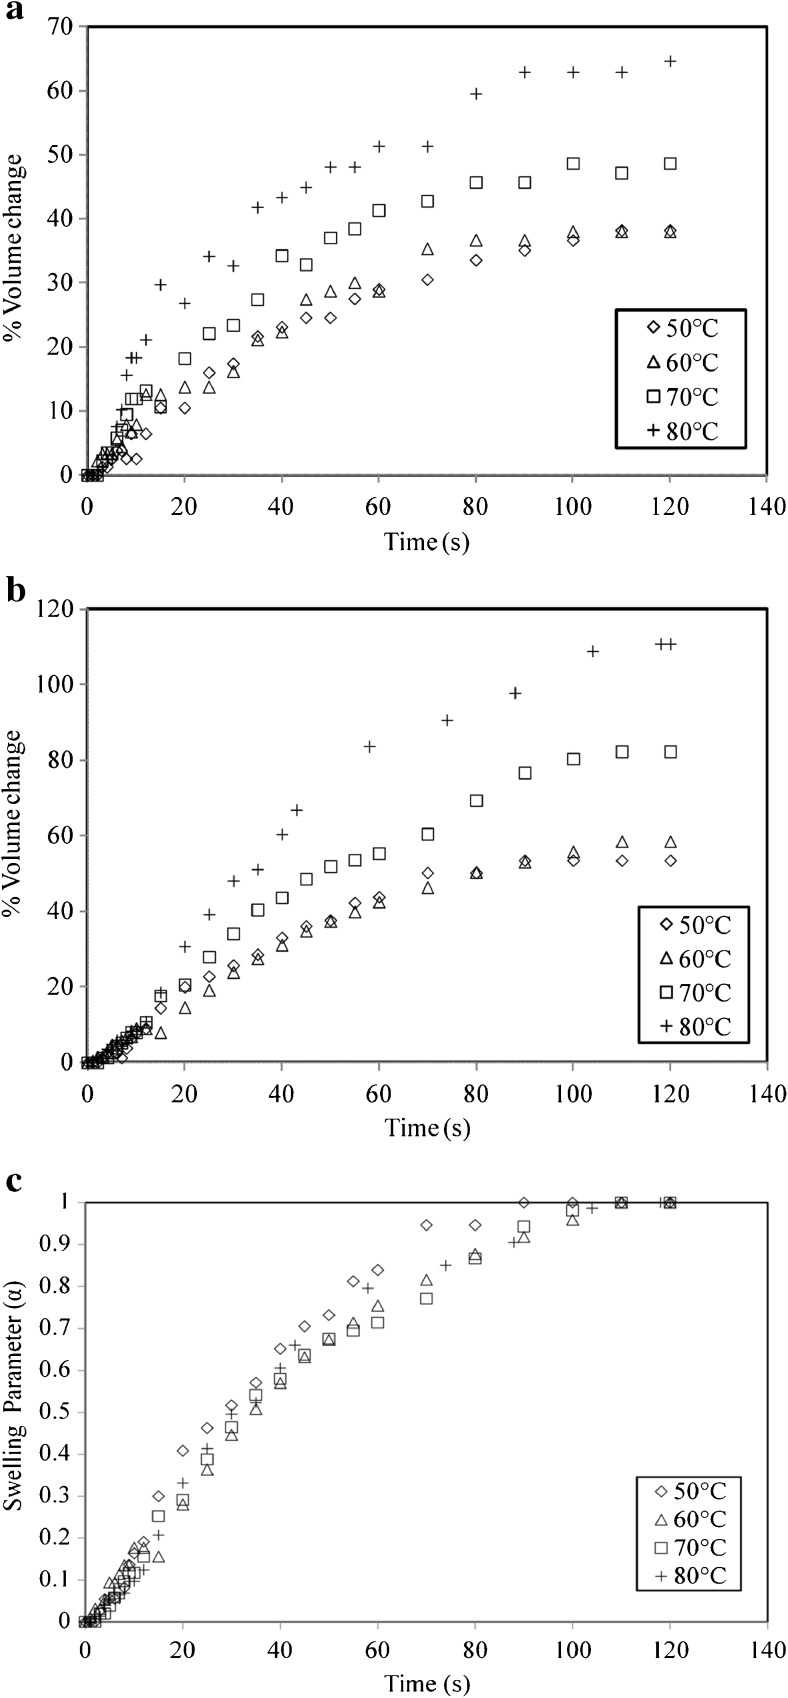
The swelling experiments of tea bed in a separating funnel were carried out at four temperatures 50, 60, 70 and 80 °C. The effect of temperature on swelling of tea bed for T5 and T1 is depicted in Fig. 5a, b respectively. It is observed that there is no effect of temperature on swelling of tea bed for 50 and 60 °C. However a significant increase in swelling is observed from 60 to 80 °C. It is seen that an increase in temperature from 60 to 80 °C results in increase in the rate of swelling. The swelling observed for T5 at 60 °C was 38 % which increased to 64.66 % at 80 °C. For T1 the swelling increased from 58.55 to 110.81 % for the same temperature range. The swelling of tea bed of type T5 increases by a factor of 1.28 from 60 to 70 °C and by 1.33 from 70 to 80 °C. Similarly for T1, the swelling of tea bed rises by a factor of 1.4 from 60 to 70 °C and by 1.34 from 70 to 80 °C. Comparing T1 and T5 at all temperatures, it is observed that swelling of T1 is more than T5. This may be due to the fact that the particle size of T1 (1.2 mm) is less than T5 (2.2 mm).
Fig. 5.
Swelling behavior of a bed of 2.2 mm particles of T5 at different temperatures; b bed of 1.2 mm particles of T1 at different temperatures; c swelling parameter with time for a bed of 2.2 mm particles of T5 at different temperatures
The behavior of dimensionless swelling parameter with respect to time is depicted in Fig. 5c for T1 at 60, 70 and 80 °C. It is observed that temperature does not have much dependence on the dimensionless swelling parameter. Swelling is different at each temperature but the rate at which the particles attain their final size is more or less similar for all temperatures. A similar behavior is also observed for T5. From the figure it can be deduced that within first 40 to 45 s, about 70 to 75 % swelling is complete. This suggests that maximum of the swelling in case of tea bed occurs within first 40 to 45 s. However for a single particle this time period was about 20 to 25 s as seen earlier. This time lag for tea bed may be due to the fact that a single particle in beaker has more spatial environment than in a tea bed. The surrounding particles to a small extent may hinder the swelling process. Also it is seen that it takes about 7 to 8 s for the tea bed to fill completely with water. This adds to the time lag found in swelling of tea bed.
Effect of particle size for swelling of tea bed
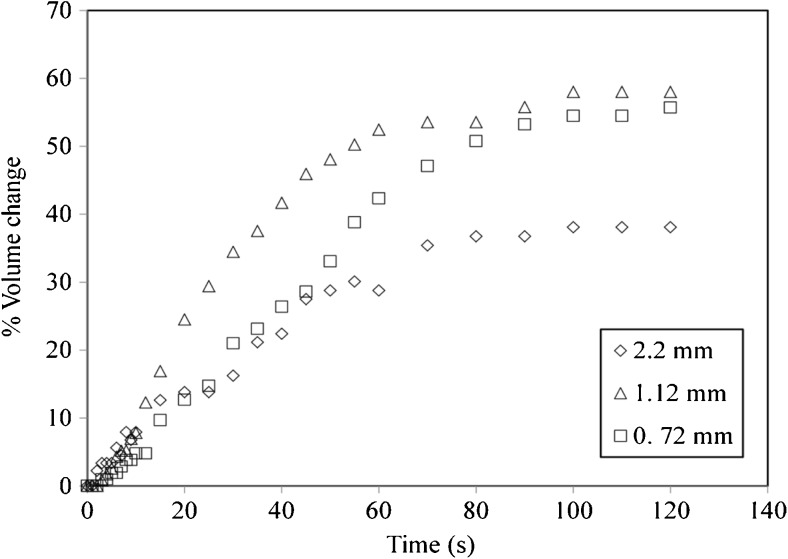
Fractions of tea particles retained on 820 and 500 μm sieves were taken. The particle size calculated by image analysis and Eq. 10 was found to be 1.12 and 0.72 mm respectively. The effect of particle size on the rate of swelling of T5 at 60 °C is shown in Fig. 6. Decrease in particle size leads to increase in swelling. This result is similar to the one obtained in effect of particle size for single particle swelling. The swelling increases from 38 % for 2.2 mm particles to 58 % for 1.12 mm particles. Hence the decrease in particle size by a factor 0.318 causes the tea bed to swell 1.46 times than the original. However as the particle size decreases from 1.12 to 0.72 mm, no effect on swelling is observed. The initial rate of swelling is also more for 1.12 mm particles. However, for 0.72 mm particles the rate of swelling appears to be slower. The reason behind this behavior is the difference in the speed of the peristaltic pump as discussed earlier. The speed of the pump was kept at 1 rpm for 0.72 mm particles. For any speed higher than 1 rpm the particles tends to fluidize which is undesirable. Also the time lag to fill the bed completely is increased due to lower speed.
Fig. 6.
Effect of Particle size on tea bed of T5 at 60 °C
Effect of initial tea bed height and vessel size on swelling
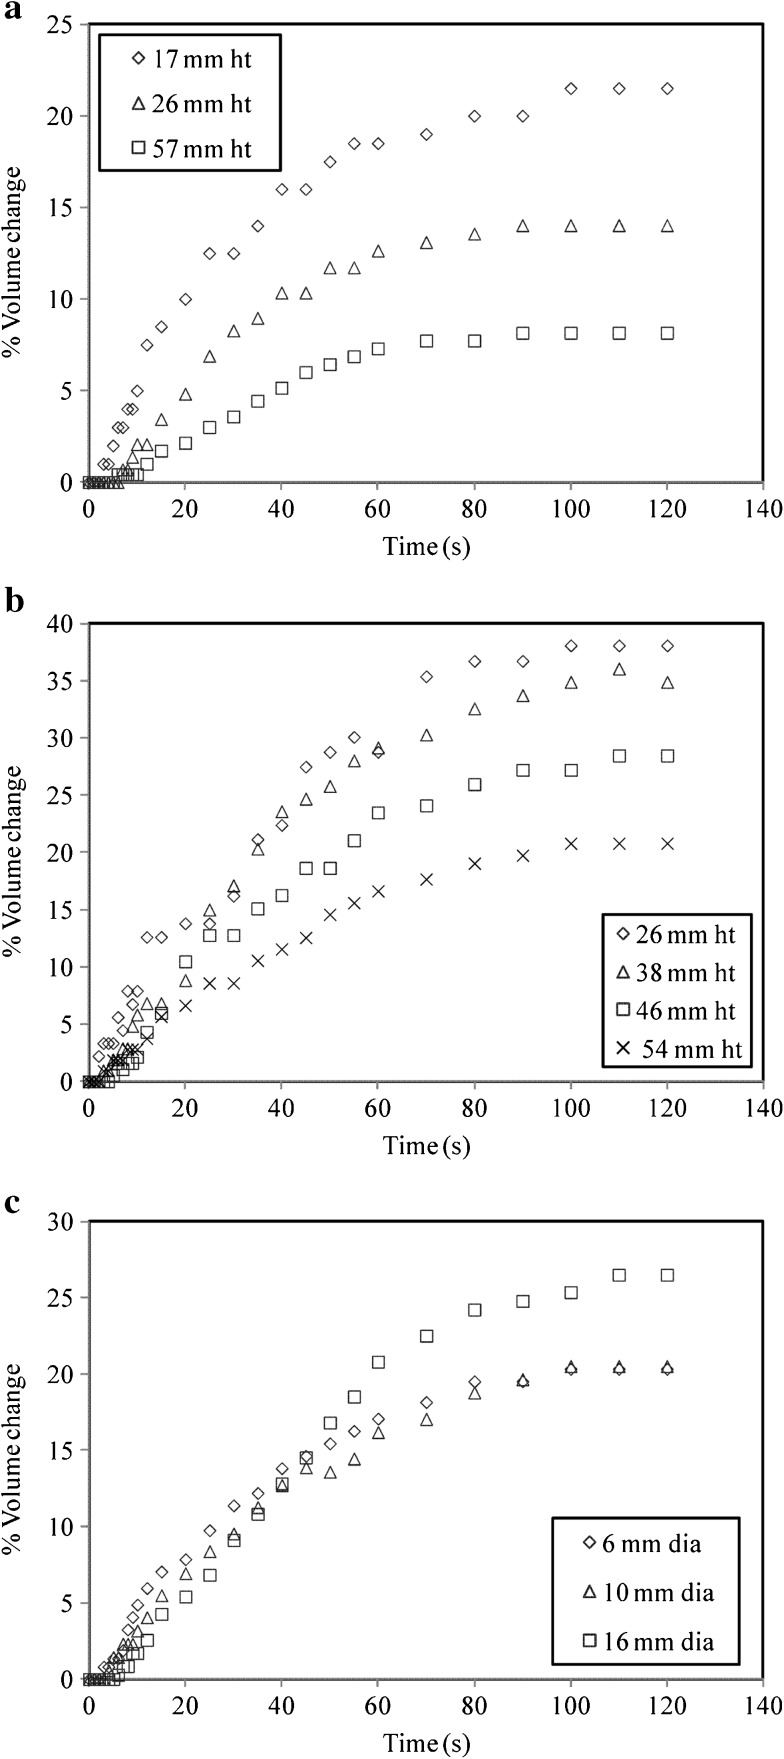
The effect of initial tea bed height on swelling of tea particles of T5 at 60 °C for cylindrical column and separating funnel has been shown in Fig. 7a and b respectively. From both the figures it can be seen that an increase in initial bed height results in decrease in swelling. From Fig. 7a, it can be deduced that as the initial tea bed height increases from 17 to 26 mm the swelling is found to decrease from 21.5 to 14 %. As the height increases to 57 mm, swelling has substantially reduced to 8.1 %. Thus as height increases by a factor of 3.3, the volume change of tea bed reduces by 2.68 times. Similar conclusions can be drawn from Fig. 7b. Increase in initial height from 26 to 38 mm in a separating funnel has no effect on swelling. However as the height increases further up to 54 mm swelling reduced to about 20.8 %. Thus an increase in height by about 2.07 times reduces the swelling by a factor of 1.82. Thus it can be seen that an increase in initial bed height for both the geometries has a significant effect on swelling kinetics. The particles at the bottom section of the tea bed are under pressure due to the weight of the particles above them. In this case the free swelling of tea bed is restricted. Also, since the geometry remains constant the free space available for swelling reduces for increased tea bed height. This situation is not encountered for lower bed heights. As bed height goes on increasing the pressure developed on the tea particles is further increased which eventually results in lesser swelling.
Fig. 7.
Effect of a initial tea bed height on swelling of T5 at 60 °C for a 10 mm cylindrical column; b initial tea bed height on swelling of T5 at 60 °C for a separating funnel; c column size on swelling of T5 at 60 °C for same height (22 mm)
The effect of diameter of the column at same height (22 mm) of the tea bed has been depicted in Fig. 7c. The figure shows that the increase in diameter from 6 to 10 mm has no effect on the swelling. The extent of swelling for both the cases was observed to be 20.5 %. The space available for 10 mm diameter column is larger than 6 mm column but probably still not sufficient for free swelling. However it can be seen that as the diameter is increased further up to 16 mm, the swelling increases to 26 %. Thus an increase in diameter of column by 1.6 times causes the tea bed to swell more by 1.26 times. This is due to the larger space availability for 16 mm column. Thus it can be said that the column size has a significant effect on the swelling kinetics of tea bed.
Analysis of swelling data
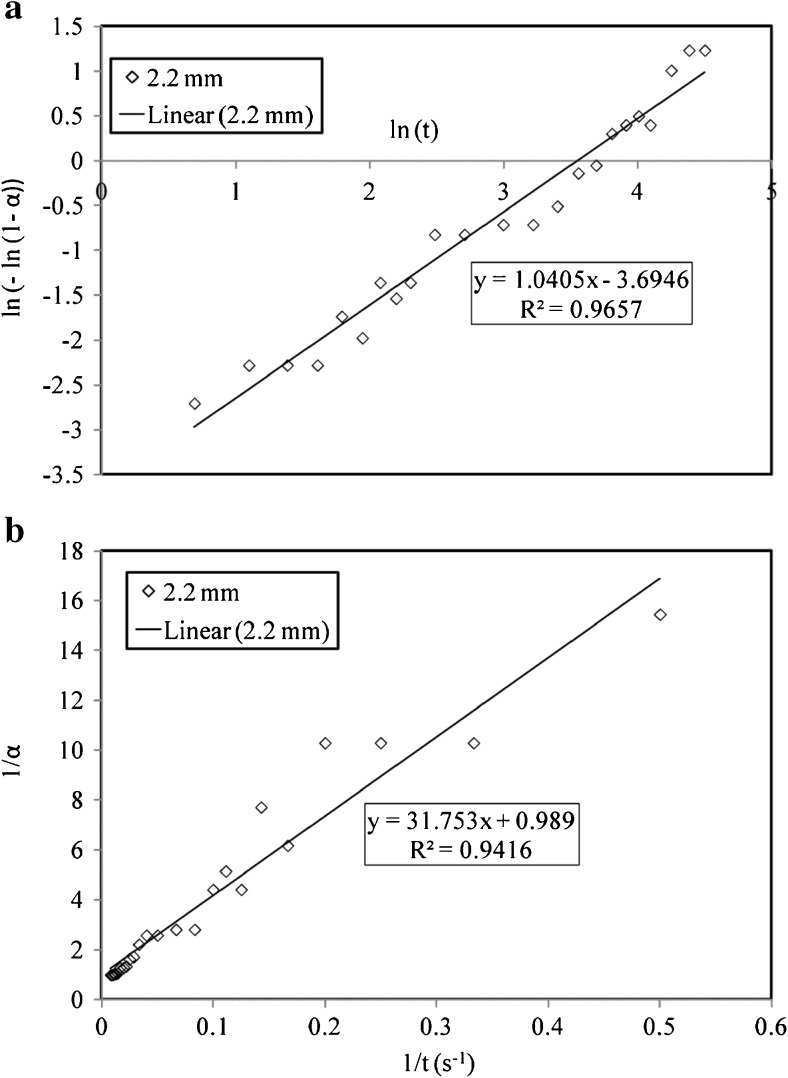
The models (Eqs. 4 to 6) reported in the literature were also used to fit the experimental data obtained from the above experiments. However the data fit obtained was not good and hence we did not use these models further. The mathematical models of Weilbull and Peleg were used for data analysis. The fit obtained for Weibull model and Peleg model for swelling of tea bed of type T5 at 60 °C has been shown in Fig. 8a and b respectively. To obtain values of the model parameters the Weibull equation was simplified into a equation of straight line as given below.
| 14 |
Fig. 8.
Comparison of different models fitted for swelling of tea bed of T5 at 60 °C. a Weibull model; b Peleg model
A plot of ln( − ln (1 − α)) v/s lnt as shown in Fig. 8a gives a slope of ϕ and intercept of ϕ ln λ. Using these values the model parameters are evaluated. Similarly the Peleg model was also mathematically simplified to get the Peleg model parameters.
| 15 |
A plot of 1/α v/s 1/t as shown in Fig. 8b yields a straight line with slope of P1 and intercept of P2. The co-efficient of determination (R2) obtained for Weibull model (R2 = 0.97) is higher than that for Peleg model (R2 = 0.94). This result shows that Weibull model gives a better fit for swelling of tea particles than Peleg model.
The Weibull and Peleg model parameters were calculated at 60, 70 and 80 °C for swelling of both tea types T1 and T5 in a separating funnel for 0.5 g of tea. The results are tabulated in Table 2. It is seen that for both T1 and T5, Weibull parameters shows some consistent results with higher R2 values. The effect of temperature on Peleg parameters is also shown in Table 2. The Peleg rate parameter P1 increases with rise in temperature for both the tea types. However P2 shows a declining trend as temperature increases. Although the R2 values are good, the data points for Peleg model are scattered. The initial data points are largely spaced and the other data points are very closely spaced. Thus Peleg model is inconsistent in describing the swelling behavior of tea particles.
Table 2.
Calculated Weibull and Peleg parameters for T1 and T5 at different temperatures
| Model parameters for T5 | Model parameters for T1 | |||||||||||
|---|---|---|---|---|---|---|---|---|---|---|---|---|
| Weibull model | Peleg model | Weibull model | Peleg model | |||||||||
| Temperature °C | λ (s−1) | φ | R2 | P1 (s) | P2 | R2 | λ (s−1) | φ | R2 | P1 (s) | P2 | R2 |
| 60 | 0.0129 | 1.04 | 0.97 | 31.75 | 0.99 | 0.94 | 0.0110 | 1.18 | 0.99 | 89.99 | −1.47 | 0.97 |
| 70 | 0.0139 | 1.13 | 0.98 | 50.34 | 0.05 | 0.95 | 0.0126 | 1.43 | 0.99 | 156.91 | −3.09 | 0.90 |
| 80 | 0.0153 | 1.21 | 0.92 | 102.95 | −2.72 | 0.81 | 0.0146 | 1.49 | 0.98 | 155.07 | −3.38 | 0.92 |
The values of Weibull rate parameter increased with rise in temperature for both the tea types. Value of λ for T5 at 80 °C was 1.19 times than that for 60 °C. Equation 12 was used to calculate activation energy. In Arrhenius plot the value of activation energy is calculated by means of slope of the line (E/R). The activation energy of swelling for T1 and T5 was found to be 14.156 and 8.37 kJ/mol respectively. Similarly the activation energy for 0.72 mm particle for T5 was calculated as 13.42 kJ/mol. Thus it can be seen that the activation energy for the process of swelling differs with the type of tea as well as particle size. The activation energy is found to increase with reduction in particle size.
From Table 2, it is seen that Weibull shape parameter also shows an increasing trend with temperature. Value of ϕ for T5 at 80 °C is 1.16 times that for 60 °C whereas for T1 it is 1.26 times greater. The value of shape parameter indicates the nature or the shape of the curve for swelling. Machado et al. (1998) have given that the internal diffusional limitations can be predicted with the values of the shape parameter used in hydration of foodstuffs. Values of shape parameter more than or equal to 1 suggests the presence of internal diffusion resistance. The values ϕ obtained in this work implies that internal diffusion limitations are present in case of hydration in tea particles. Values of rate parameter and shape parameter for different particle size and brands of tea has been shown in Table 3. It can be observed that decrease in particle size for T5 from 2.2 to 1.12 mm results in an increase in the values of λ (2.4 times) as well as ϕ (1.5 times). Variation of λ and ϕ for different types of tea such as T1, X and Y is also shown in Table 3. It can be seen that there is significant variation in the values of both the parameters. Thus it can be said that both the parameters are dependent on particle size as well as brand.
Table 3.
Effect of particle size and brands on λ and φ at 60 °C
| Tea type | λ (s−1) | φ |
|---|---|---|
| T5_2.2 mm | 0.0129 | 1.04 |
| T5_1.12 mm | 0.0302 | 1.5 |
| T1_1.2 mm | 0.0110 | 1.18 |
| X_1.55 mm | 0.0252 | 1.94 |
| Y_1.3 mm | 0.0233 | 1.74 |
Conclusions
The swelling of single tea particles showed that the volume change for particles of similar size is substantially different. This could be due to differences in various factors such as porosity, hydrophilicity, anisotropic effect and origin of the individual tea particles. The tea bed studies suggested that separating funnel gives enhanced swelling than cylindrical column. About 70 to 75 % swelling occurs in the first 40 to 45 s. The measurements on release of polyphenol into the brew indicate that there is a relation between tea infusion quality and swelling. However, the relationship is different for different tea brands. Reduction in particle size and increase in temperature increases the rate as well as the extent of swelling. Increase in bed height results in decrease in extent of swelling. However, for the same height of the tea bed, a larger sized column increases the extent of swelling. The empirical Weibull model was found to fit the swelling data very well. Activation energies estimated for T5 (2.2 mm), T1 (1.2 mm) and T5 (0.72 mm) were 8.37, 14.156, and 13.42 kJ/mol respectively. This suggests that activation energy for the process of swelling depends on particle size as well as the type of tea. The activation energy is found to increase with decrease in particle size of the same tea. The values of shape parameter and rate parameter is found to be dependent on particle size as well as tea brand. The values of shape parameter suggest that internal diffusional limitations for water intake may be present.
Acknowledgments
The authors acknowledge Unilever Industries Limited for funding the research project. One of the authors, also acknowledges All India Council for Technical Education (AICTE) for financial support.
Footnotes
Highlights
• Rise in temperature and decrease in particle size results in more swelling.
• Increase in bed height and decrease in column diameter results in less swelling
• Absorbance at 272 nm v/s swelling indicates a relation between tea quality and swelling
• The empirical Weibull model is found in good agreement with the experimental data.
• The model shows dependency of activation energy of swelling on type of tea and particle size.
References
- Aguerre RJ, Tolaba M, Suarez C. Modeling volume changes in food drying and hydration. Lat Am Appl Res. 2008;38:345–349. [Google Scholar]
- Bakalis S, Kyritsi A, Karathanos VT, Yanniotis S. Modeling of rice hydration using finite elements. J Food Eng. 2009;94:321–325. doi: 10.1016/j.jfoodeng.2009.03.023. [DOI] [Google Scholar]
- Barbosa-Canovas GV, Juliano P, Peleg M (2006) Engineering properties of foods. Encyclopedia Life Support Syst 1–32
- Cunningham SE, McMinn WAM, Magee TRA, Richardson PS. Modelling water absorption of pasta during soaking. J Food Eng. 2007;82:600–607. doi: 10.1016/j.jfoodeng.2007.03.018. [DOI] [Google Scholar]
- Goula AM, Adamopoulos KG. Modeling the rehydration process of dried tomato. Dry Technol. 2009;27:1078–1088. doi: 10.1080/07373930903218677. [DOI] [Google Scholar]
- Harbowy ME, Balentine DA. Tea chemistry. CRC Crit Rev Plant Sci. 1997;16:415–480. doi: 10.1080/07352689709701956. [DOI] [Google Scholar]
- Machado M, Oliveira F, Gekas V, Singh R (1998) Kinetics of moisture uptake and soluble solids loss by puffed breakfast cereals immersed in water. Int J Food Sci Technol 225–237
- Malumba P, Jacquet N, Delimme G. The swelling behaviour of wheat starch granules during isothermal and non-isothermal treatments. J Food Eng. 2013;114:199–206. doi: 10.1016/j.jfoodeng.2012.08.010. [DOI] [Google Scholar]
- Merkus HG (2009) Particle size, size distributions and shape. In: Particle size measurements, 1st edn. Springer, Netherlands, pp 24
- Miyagawa K, Yamano H, Ogawa I. Calorimetric measurements on the swelling of green tea. Thermochim Acta. 1995;257:13–19. doi: 10.1016/0040-6031(94)02196-U. [DOI] [Google Scholar]
- Oztop MH, McCarthy KL. Mathematical modeling of swelling in high moisture whey protein gels. J Food Eng. 2011;106:53–59. doi: 10.1016/j.jfoodeng.2011.04.007. [DOI] [Google Scholar]
- Peleg M. An empirical model for the description of moisture sorption curves. J Food Sci. 1988;53:1216–1219. doi: 10.1111/j.1365-2621.1988.tb13565.x. [DOI] [Google Scholar]
- Ramesh MN. An application of image analysis for the study of kinetics of hydration of milled rice in hot water. Int J Food Prop. 2001;4:271–284. doi: 10.1081/JFP-100105193. [DOI] [Google Scholar]
- Shinde YH, Vijayadwhaja A, Pandit AB, Joshi JB. Kinetics of cooking of rice: a review. J Food Eng. 2014;123:113–129. doi: 10.1016/j.jfoodeng.2013.09.021. [DOI] [Google Scholar]
- Weerts A, Lian G, Martin D. Modeling rehydration of porous biomaterials : anisotropy effects food engineering and physical properties. J Food Sci. 2003;68:137–142. doi: 10.1111/j.1365-2621.2003.tb08268.x. [DOI] [Google Scholar]
- Weerts A, Lian G, Martin D. Modeling the hydration of foodstuffs: temperature effects. AICHE J. 2003;49:1334–1339. doi: 10.1002/aic.690490524. [DOI] [Google Scholar]


