Abstract
A tuneable repetition rate extreme ultraviolet source (Harmonium) for time resolved photoelectron spectroscopy of liquids is presented. High harmonic generation produces 30–110 eV photons, with fluxes ranging from ∼2 × 10¹¹ photons/s at 36 eV to ∼2 × 10⁸ photons/s at 100 eV. Four different gratings in a time-preserving grating monochromator provide either high energy resolution (0.2 eV) or high temporal resolution (40 fs) between 30 and 110 eV. Laser assisted photoemission was used to measure the temporal response of the system. Vibrational progressions in gas phase water were measured demonstrating the ∼0.2 eV energy resolution.
I. INTRODUCTION
Photoelectron spectroscopy (PS) of liquids was first introduced by Siegbahn and co-workers in the early 1970s,1 then further developed by Faubel and co-workers.2,3 By directly collecting photoemitted electrons from a region of laminar flow of a liquid microjet in vacuum, the electronic structure of the solvent and solute can be determined. Liquid PS has been developed using a variety of photon sources ranging from laboratory-based ultraviolet (UV) and extreme ultraviolet (EUV)4 to synchrotron X-ray sources, enabling ultraviolet (UPS) and X-ray photoelectron spectroscopy (XPS).5–7
Pushing PS of liquids into the ultrafast time domain was pioneered by Suzuki and co-workers,8,9 and Lübcke and co-workers,10 using UV (<6 eV) pulses, and by Abel, Faubel, and co-workers using EUV pulses.11,12 Time-resolved PS allows mapping the evolving electronic structure of the photoexcited solute by the time delayed UV or EUV pulse. This evolution may occur as a result of electronic relaxation cascades, changes of oxidation state (e.g., in charge transfer processes) or structural modifications.
The photon energy used as a probe determines the type of the information collected in liquid PS namely if the measurement is bulk or surface (or near surface) sensitive. Furthermore, UV photon energies access valence orbitals and some excited states delocalised over the molecule, while higher photon energies in the EUV can also access core level orbitals: providing element specific structural information. For photon energies of interest here, the penetration depth (or information depth) of the measurement is limited by the attenuation and inelastic scattering of the emitted electron traveling out of the liquid. Recent measurements by Suzuki and co-workers13 have shown that for electron kinetic energies between 1 and 100 eV, the effective measurement depth is near constant at ∼2 nm with steep increase at higher and lower electron kinetic energies.
High harmonic generation (HHG) has emerged as the ideal laboratory based source of femtosecond EUV pulses from 10 s to 100 s eV.14 However, the intrinsic spectrum of harmonics generated by HHG requires monochromatization in order for it to be used as a photon source for PS. Several approaches have previously been employed to this aim: dielectric mirrors,15–18 single gratings in conventional geometry,19–23 single grating in off-plane geometry,23–25 double gratings in an off-plane geometry,26,27 and Fresnel zone plates.28,29 Here, we present a new set up (Harmonium) for ultrafast EUV PS of liquids developed at the Lausanne Centre for Ultrafast Science (LACUS), which is based on a single grating monochromator in the off-plane geometry, with a choice of four different gratings that can provide either high temporal resolution (40 fs) or high energy resolution (0.2 eV) between 30 and 110 eV. The use of an ellipsoidal mirror in 4:1 focusing geometry is shown to produce a ∼30 μm focal spot of the monochromatic source at the target plane.
The paper layout is as follows. The HHG source, monochromator design, and specifications are described in Section II. The performances of Harmonium: photon flux, temporal resolution (measured by laser assisted photoemission), and energy resolution are reported in Section III for all gratings in the energy range of 30–110 eV.
II. BEAMLINE
A simplified diagram of Harmonium is shown in Figure 1. The femtosecond laser system comprises of a Ti:sapphire oscillator at 80 MHz seeding a chirped-pulse regenerative amplifier. Stable operation of the latter with pulse-to-pulse intensity fluctuations smaller than 0.4% RMS has been demonstrated in the range of 3–15 kHz with an average power of up to 15 W and a pulse duration of ∼45 fs.
FIG. 1.
Schematic (top-view) of the time resolved Harmonium beamline for PS of liquids at the Lausanne Centre for Ultrafast Science (LACUS). TP: turbomolecular pump, MCP: microchannel plate detector, WP: half-wave plate and t. mirror: toroidal mirror. Measurement of the EUV photon flux after the ellipsoidal focusing is done at the sample position by means of a NIST-calibrated Al2O3 photodiode. Photoelectron collection is carried out by a time-of-flight (TOF) electron spectrometer and a time-to-digital (TDC) convertor card.30
For HHG, the full-width half maximum (FWHM) diameter of the fundamental laser beam is ∼5 mm. A 400-mm focal-length spherical Ag mirror is used for focusing it onto the continuous-flow target, which is a 4-mm-diameter capped cylindrical cell with two diametrically opposite 0.5-mm apertures for the beam to pass through. The FWHM diameter of the IR focal spot is μm. Phased-matched short-trajectory high harmonics are produced with the target located approximately 5 mm downstream from the focal plane. A high-precision needle valve is used to adjust the target gas pressure from the backing 1-bar value down to about mbar for HHG in Ar and mbar for HHG in Ne, in the HHG chamber. Differential pumping is installed between the latter and the monochromator chamber by placing a 3-mm-diameter aperture about 20 mm after the HHG gas target. This way, the pressure in the monochromator can be kept stable, on the order of mbar.
The monochromator is of similar design to Reference 25 using a single grating with the grating grooves running parallel to the grazing-incident EUV (off-plane geometry). The entrance slit of the monochromator is the EUV source which is collimated by a toroidal mirror, followed by an off-plane mounted grating with a final toroidal mirror focusing the monochromated beam to an exit slit. Details of these elements are provided in the following paragraphs.
The first toroidal mirror has an effective focal length of f = 650 mm and collimates the EUV beam diverging from the HHG source. A copper spatial filter is placed before this toroidal mirror to reduce the IR intensity on the optics. The divergence of the generated high harmonics depends strongly on the IR focusing geometry. Harmonic divergences smaller than 1 mrad have been achieved by using loose focusing geometries, i.e., m.31 For HHG in Ar, the EUV divergence has been measured to be half that of the focusing IR.32 With our geometry, the IR focusing at the HHG target has a half-width beam divergence of mrad, so that a divergence of mrad is a reasonable assumption for the EUV. The first order diffraction of the grating suffers from a delay of one wavelength for rays diffracted by two adjacent grooves, so that the temporal dispersion of the pulse after diffraction increases with the number of illuminated grooves.25 Therefore, the groove density σ is a critical parameter. One of four Au-coated gratings with different geometries and an Au flat mirror can be selected in the monochromator, either for high-temporal or high-energy resolution or transmission of the full spectrum.
In Table I, the parameters and the most efficiently diffracted harmonic by the different gratings are shown. The diffraction efficiency determines the percentage of incident intensity that is diffracted to the first order and is therefore an important parameter for the transmission of the monochromator. For each grating, the temporal dispersion has been calculated by ray tracing; the corresponding energy dispersion values have been obtained by using equation25
| (1) |
where
| (2) |
under the approximation . In Equation (2), μm is the entrance slit of the monochromator (in our case the EUV source focus), q = 650 mm is the entrance arm length, and σ [gr/mm] is the groove density. As can be seen from the previous equations, the wavelength dispersion depends only on grating parameters and for each grating is constant in wavelength while for the energy dispersion there is a non-linear dependence.
TABLE I.
Grating parameters. High Harmonic efficiency () is determined by the geometrical parameters of the grating and represents the most efficiently diffracted harmonic in the first order, with its equivalent energy in brackets assuming a 790 nm fundamental wavelength. σ is the number of grooves per millimeter. is the temporal dispersion for two particular energy values calculated by ray tracing, and is the energy dispersion, obtained using Equations (1) and (2).
| σ (gr/mm) | blaze angle (deg) | HHeff | E (eV) | (fs) | (eV) |
|---|---|---|---|---|---|
| 200 | 4.2 | 15th (23.5 eV) | 30 | 54 | 0.6 |
| … | … | … | 40 | 40 | 1.0 |
| 600 | 3.4 | 55th (86.3 eV) | 80 | 60 | 1.3 |
| … | … | … | 100 | 50 | 2.1 |
| 900 | 14.3 | 21st (32.9 eV) | 30 | 240 | 0.1 |
| … | … | … | 40 | 180 | 0.2 |
| 1200 | 6.9 | 55th (86.3 eV) | 80 | 120 | 0.7 |
| … | … | … | 100 | 100 | 1.0 |
After diffraction by the grating, the beam passes through a beam dump for the zero order. The combination of the spatial filter before the first toroidal mirror and this beam dump effectively blocks all the residual IR, such that none is measured further down the beamline on the photodiode used to measure the EUV flux.
A toroidal mirror (identical to the first to reduce aberrations,25 f = 650 mm) focuses the monochromatic EUV radiation onto the variable-width exit slit, allowing a single harmonic to be selected. The monochromatic EUV radiation at the slit is imaged on the target plane in a 4:1 geometry using an Au-coated ellipsoidal mirror. As specified by the manufacturer (Zeiss AG), the geometrical parameters of the mirror are: dimensions = mm3, clear aperture = 116 × 20 mm2, semi-axis A = 1250 mm, semi-axis B = 104.5 mm, and off-axis position mm. The mirror is mounted on a high-spatial-resolution robotic mount (Space Fab, from PI Micos) with 6 axes of motion.
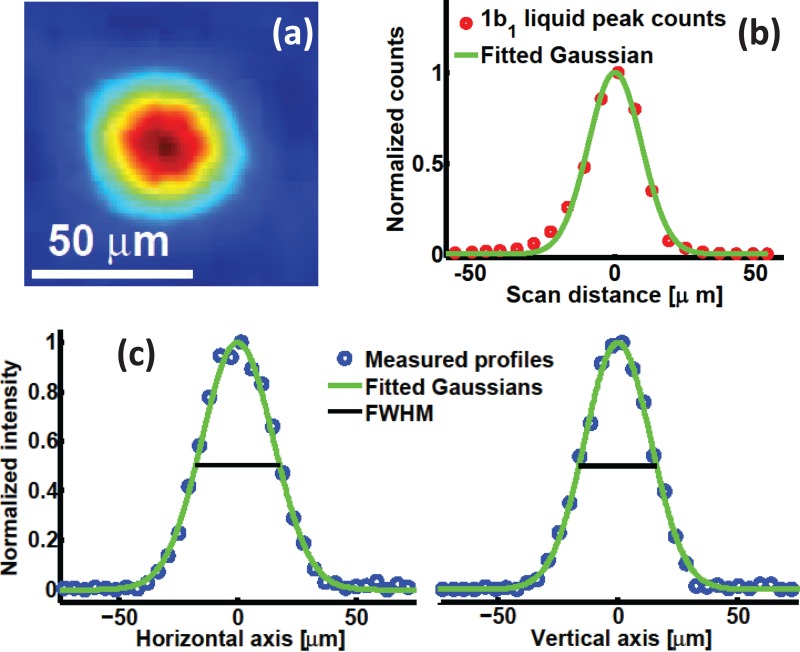
The focal spot size in the target plane (entrance of the TOF photoelectron spectrometer) was measured using a HeNe laser and a ∼100 μm pinhole placed in the HHG source plane. A value of μm2 FWHM was obtained and the beam profile is shown in Figure 2. The ellipsoidal-mirror mount allows precise alignment of the beam in front of the electron spectrometer entrance. The beam can be steered in an area of ∼ 500 × 500 μm2 without significant focal distortion (i.e., diameter increase by μm). The sub 40 μm size of the focal spot is corroborated by photoelectron measurements. When the liquid jet is moved across the EUV beam along the TOF axis, the liquid phase spectrum is only observed in a 30 μm window.
FIG. 2.
(a) Focal spot in the target plane (in front of the electron spectrometer), measured using a HeNe laser. (b) Photoelectron counts in the 1b1 liquid peak of water as the jet was translated across the focus. The FWHM of the fitted Gaussian is 22 μm. (c) Measured HeNe focal spot profiles , .
Imaging the EUV focus in front of the electron spectrometer is carried out on a daily basis for alignment purposes by means of an insertable YAG:Ce scintillator crystal.
III. BEAMLINE PERFORMANCE
In this section, we present the monochromatic photon flux and both the temporal and energy resolution of Harmonium.
A. Photon flux
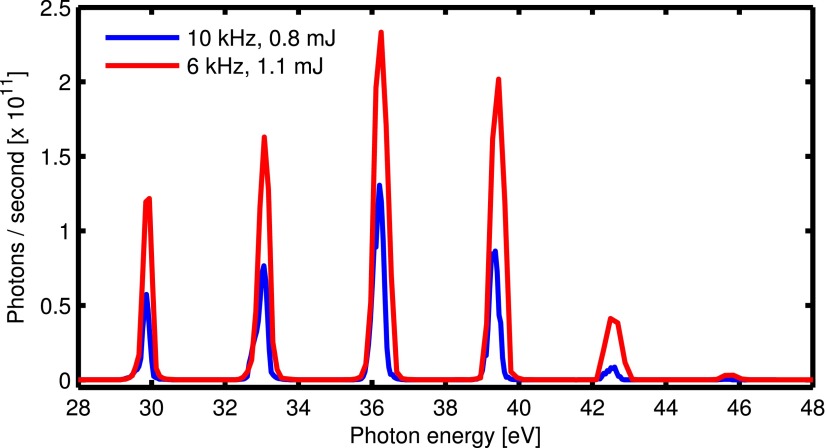
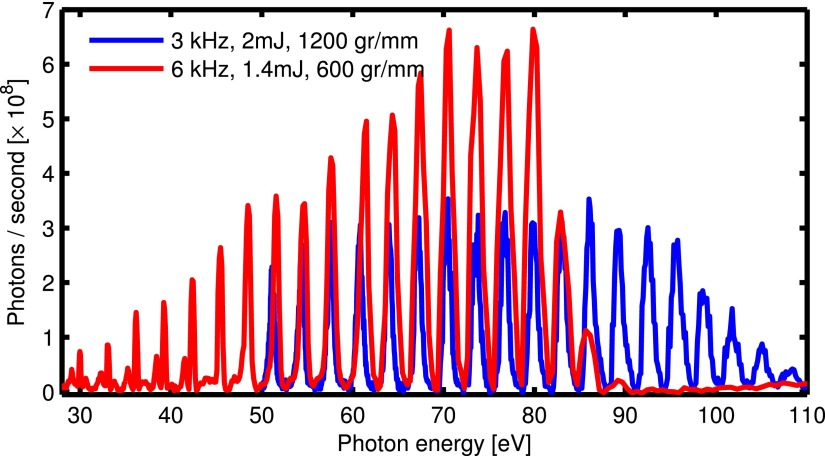
The monochromatic EUV photon flux was measured using a calibrated Al2O3 photodiode (NIST) after the ellipsoidal mirror. The EUV flux (photons/second) was measured from 30 to 110 eV as shown (Figures 3 and 4), for HHG in Ar and Ne, for different repetition rates and energies per pulse. No residual IR after monochromatization was detected on the photodiode.
FIG. 3.
s-polarized EUV photon flux measured at the target plane for HHG generation in Ar at two different repetition rates/pulse energies. The 900 gr/mm grating is used in both cases. The IR central wavelength is 785 nm.
FIG. 4.
s-polarized EUV photon flux measured at the target plane for HHG generation in Ne, two different repetition rates/pulse energies, and with different gratings. The IR central wavelength is 793 nm.
Table II compares the reported typical EUV photon fluxes of HHG beamlines coupled to a single-grating EUV monochromator. All the reported fluxes are for s-polarized EUV, with the exception of Refs. 25 and 21, in which the polarization is not indicated. Care has to be taken when comparing flux, since, from all the reported works, only Refs. 20 and 21 measure the flux of the focused beam, as required for PS in liquids. The system presented here uses an ellipsoidal EUV focusing element while conventional beamlines use a toroidal focusing geometry20,21,23,25 or no focusing at all.22 The previously reported flux at the highest photon energy is photons/s at 79 eV and 5 kHz in Ref. 23, while photons/s at 102 eV and 3 kHz can be achieved with our system (Figure 4).
TABLE II.
Reported photon fluxes for single-grating HHG monochromators. a.m. and a.f. refer to the position of flux measurement, i.e., measured after monochromatization and after a focusing element, respectively.
B. Temporal response
The temporal response of the monochromator was characterized by laser assisted photoemission (LAPE) in an atomic gas. The EUV pulse exiting the monochromator was temporally and spatially overlapped with the fundamental IR pulse in a neon gas target in front of the electron time-of-flight spectrometer.30 Photoelectron spectra were recorded as a function of time delay between both pulses for selected EUV energies and for each of the four gratings.
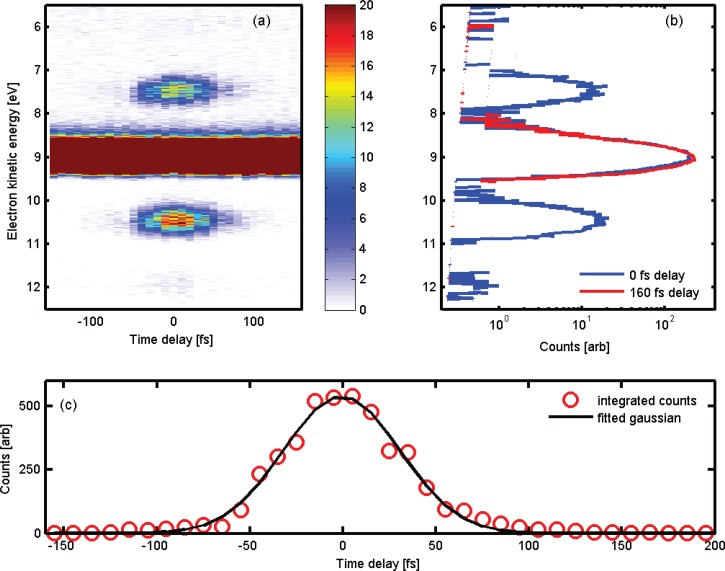
Around the single-peak neon 2p band, sidebands separated by one IR photon energy (∼1.6 eV) appear when the two pulses are overlapped in time. They originate from the free-free transition experienced by the EUV released electron when absorbing or emitting one IR photon.33–35 The sidebands provide a cross-correlation signal of the temporal profiles of the EUV and IR pulses, so that the pulse duration of the EUV can be retrieved when the IR pulse duration is known. An example of a time resolved LAPE measurement in neon is shown in Figure 5(a). The EUV photon energy was 30.6 eV (HHG in argon), groove density was 200 gr/mm, acquisition time for each time step was 20 s, and the step size was 10 fs. Both the EUV and IR were p polarised.
FIG. 5.
(a) Photoelectron spectra of the LAPE response in Ne as a function of the delay between the 23rd harmonic and the ∼790 nm fundamental with a saturated color scale. (b) Photoelectron spectra at 0 fs (blue) and −120 fs (red). (c) Integrated intensity of the 1st order sideband centered at 10.5 eV. Red circles: measured intensity, black curve: fitted Gaussian of the cross correlation signal with a FWHM of 73.6 fs.
Assuming a Gaussian shape for all the temporal profiles, the FWHM of the EUV pulse duration is given by the equation
| (3) |
where is the variance of the sideband Gaussian profile and is the variance of the IR pump Gaussian temporal profile. For the measurement in Figure 5, the FWHM of the cross correlation signal was 73.6 fs which by Equation (3) gives an EUV FWHM pulse duration of 42.6 fs assuming an IR FWHM pulse duration of 60 fs. Several time resolved LAPE measurements were recorded using different gratings for a selected harmonic range.
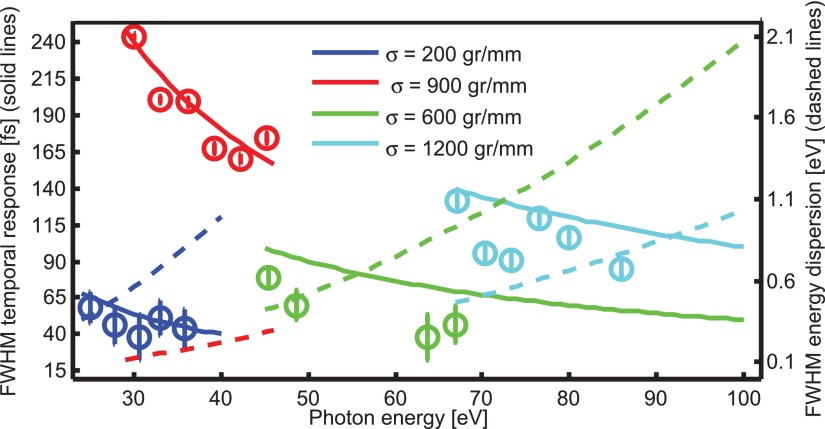
The temporal profile of the high energy sideband (lower background counts) was measured as the integral of all counts in a 1.5 eV wide window centered on the sideband, i.e., one IR photon energy above the 2p ionization peak. The IR pulse duration was measured with a FROG, and a FWHM between 50–70 fs was used for the different measurements. The longer pulse duration is a result of optimising the laser compression for HHG and not including additional compression in the dressing field arm further down the beamline. The results are shown in Figure 6 for all measurements. Ray tracing was used to calculate the temporal response of each grating. Retrieved EUV pulse durations from the LAPE measurements are shown as open circles, with error bars given by the uncertainly in the IR pulse duration. A good agreement between the measured and calculated EUV temporal response is observed, with a slight overestimate in the calculated compared to the measured value. This is most likely due to a lower EUV divergence than assumed (3 mrad).
FIG. 6.
Time response and energy bandwidth of the four different gratings in the monochromator. Colors correspond to different groove densities, which are shown in the legend. Solid lines, left vertical axis: calculated temporal response by ray-tracing. Dashed lines, right vertical axis: FWHM energy dispersion calculated by using Equations (1) and (2) assuming an EUV source spot size of 100 μm. Open circles: retrieved EUV pulse duration by LAPE measurements. The error bars in the retrieved temporal response are from the uncertainly in the IR pulse duration.
Figure 6 illustrates the trade-off between time and energy resolution mentioned earlier. Two gratings designed for maximum diffraction efficiency in the low energy part of the spectrum () and two gratings with maximum efficiency on the higher energy side () provide two possibilities depending on the desired performance, either high energy or high temporal resolution modes. The energy resolution of the system is discussed in more detail in Section III C.
C. Energy resolution
The ultimate energy resolution of the system is dependent on several factors: the entrance slit of the monochromator (taken as the EUV source point), the grating, the exit slit of the monochromator, and finally the electron spectrometer. The effective entrance slit is a parameter which will change considerable during HHG optimisation and will depend amongst other things on the IR beam profile, IR pulse intensity, target gas density, and phase matching conditions. As such, the energy resolution will change according to the experimental environment.
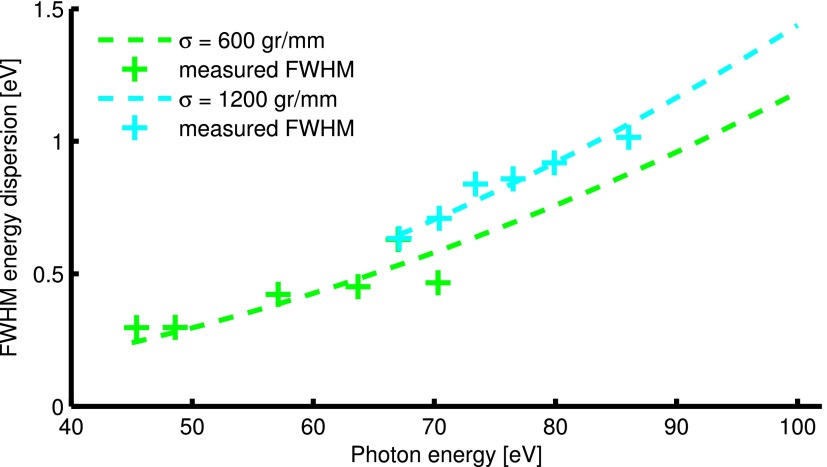
To confirm the validity of Equations (1) and (2), photoelectron spectra of neon were collected. The FWHM of the 2p ionization peak was measured for harmonics produced in neon gas for gratings with a groove density of 600 gr/mm and 1200 gr/mm. EUV produced in neon was used as the lower flux and hence fewer photoelectrons created reduces any influence of space charge or electron-electron repulsion distorting photoelectron measurements. The measured FWHM are plotted in Figure 7. The curves are a fit of Equations (1) and (2) to the data with (the EUV source spot size) as the fitting parameter.
FIG. 7.
Crosses: measured FWHM of 2p ionisation peak of neon. Dashed curves: fit of Equations (1) and (2) with ΔS as the fitting parameter (ΔS = 57 μm for 600 grooves/mm and ΔS = 139 μm for 1200 grooves/mm).
The retrieved values of ΔS were 57 μm for the grating with 600 grooves/mm (measurements from 45–70 eV) and 139 μm for the grating with 1200 grooves/mm (measurements from 45–86 eV). The harmonic generation conditions were changed for each grating, namely, the closing of an iris before the generation chamber. It is likely this change accounts for the difference in the EUV source spot size. The good fit of the measured FWHM and the curve demonstrates the validity of Equations (1) and (2).
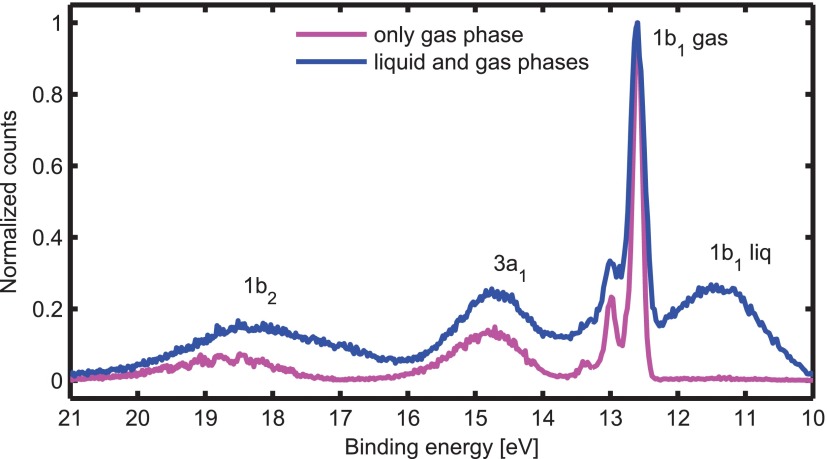
The energy resolution of the system was also demonstrated by measuring the valence-band photoelectron spectra of gas and liquid phase water (Figure 8). To suppress electrokinetic charging,36–38 NaCl was added to the water to form a 25 mM solution. The 25th harmonic of the fundamental 790 nm produced by HHG in Ar at 6 kHz was monochromatized by the 900 gr/mm grating, giving 39.2 eV EUV photons. For this harmonic, the expected grating energy resolution is meV (Table I).
FIG. 8.
Water gas and liquid phase photoelectron spectra taken with p-polarized 39.2 EUV photon energy and using the 900 gr/mm grating. For the liquid phase, the EUV beam is focused onto the bulk and contributions from the surrounding gas-phase molecules are also present. For recording the gas phase spectrum only, the liquid microjet was moved μm from the EUV focus away from the TOF entrance.
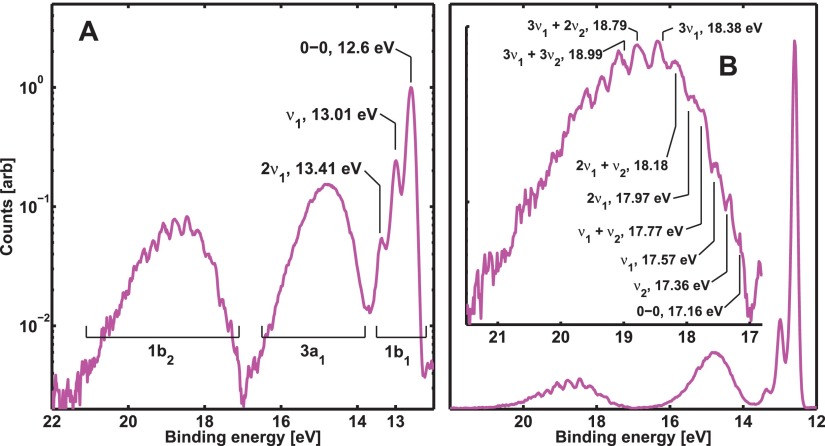
A close examination of the gas phase spectrum in Figure 8 reveals a modulation on top of the bands which arises from the vibrational structure in the ionic states of the water cation.39–42 In Figure 9, the progressions are assigned as combinations of the stretch and bending modes of water. The experimental energy resolution is estimated as meV as progressions separated by the bend mode () are clearly resolved. This is also the limit of the energy resolution of the electron spectrometer used.30 To our knowledge, this is the first time such progressions have been resolved using a HHG source of EUV radiation.
FIG. 9.
Photoelectron spectrum of the first three valence orbitals of gas phase water, measured with 39.2 eV EUV. A: logarithmic plot with vibrational progression assignment for the 1b1 orbital. B: Plot of first three orbitals—insert, assignment of vibrational progression for 1b2 (logarithmic plot).
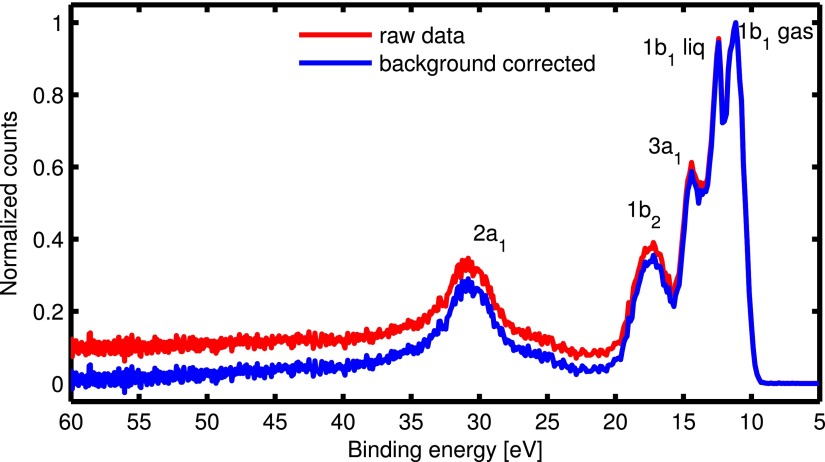
Figure 10 shows the full valence band water spectrum, measured for the first time using HHG as the EUV source. The laser repetition rate was 3 kHz, and the 600 gr/mm grating was used for monochromating the 89.6 eV harmonic. The secondary electron background has been corrected using the Shirley algorithm.43
FIG. 10.
Water gas and liquid phase photoelectron spectrum taken with p-polarized 89.6 EUV photon energy and using the 600 gr/mm grating.
IV. CONCLUSION
A versatile set-up to conduct ultrafast EUV photoelectron spectroscopy has been described. Using a single grating monochromator in a time-preserving fashion, either high energy resolution (∼0.2 eV) or high temporal resolution (∼40 fs) can be achieved between 30 and 110 eV. This flexibility in energy range and resolution allows for both the electronic and structural dynamics to be followed in a large variety of systems. The application of the set-up to the liquid phase has been demonstrated, and the use of an ellipsoidal mirror produced a ∼35 μm focal spot to match the dimensions of liquid microjets.
The high EUV photon flux reported (1011 photon/s at 36 eV and 108 photon/s at 100 eV), coupled with repetition rate control of the laser, makes the system suitable to study different states of matter other than liquids. To this end, a molecular beam and an angle-resolved photoemission spectroscopy (ARPES) end stations are under construction.
ACKNOWLEDGMENTS
Funding from the Swiss NSF via the NCCR:MUST and the R'Equip Contract 206021_145057 is acknowledged. J.G. acknowledges support by the European Research Agency via the FP-7 PEOPLE Program (Marie Curie Action 298210).
References
- 1. Siegbahn H. and Siegbahn K., “ ESCA applied to liquids,” J. Electron Spectrosc. Relat. Phenom. 2, 319–325 (1973). 10.1016/0368-2048(73)80023-4 [DOI] [Google Scholar]
- 2. Faubel M., Photoelectron Spectroscopy at Liquid Surfaces, edited by Ng C. ( World Scientific, 2000), Vol. 2. [Google Scholar]
- 3. Brown M. A., Faubel M., and Winter B., “ X-ray photo- and resonant Auger-electron spectroscopy studies of liquid water and aqueous solutions,” Annu. Rep. Sec. C 105, 174–212 (2009). 10.1039/b803023p [DOI] [Google Scholar]
- 4. Faubel M., Steiner B., and Toennies J., “ Measurement of HeI photoelectron spectra of liquid water, formamide and ethylene glycol in fast-flowing microjets,” J. Electron Spectrosc. Relat. Phenom. 95, 159–169 (1998). 10.1016/S0368-2048(98)00208-4 [DOI] [Google Scholar]
- 5. Weber R., Winter B., Schmidt P., Widdra W., Hertel I., Dittmar M., and Faubel M., “ Photoemission from aqueous alkali-metal-iodide salt solutions using EUV synchrotron radiation,” J. Phys. Chem. B 108, 4729–4736 (2004). 10.1021/jp030776x [DOI] [Google Scholar]
- 6. Winter B., Weber R., Widdra W., Dittmar M., Faubel M., and Hertel I., “ Full valence band photoemission from liquid water using EUV synchrotron radiation,” J. Phys. Chem. A 108, 2625–2632 (2004). 10.1021/jp030263q [DOI] [Google Scholar]
- 7. Seidel R., Thürmer S., and Winter B., “ Photoelectron spectroscopy meets aqueous solution: studies from a vacuum liquid microjet,” J. Phys. Chem. Lett. 2, 633–641 (2011). 10.1021/jz101636y [DOI] [Google Scholar]
- 8. Tang Y., Shen H., Sekiguchi K., Kurahashi N., Mizuno T., Suzuki Y., and Suzuki T., “ Direct measurement of vertical binding energy of a hydrated electron,” Phys. Chem. Chem. Phys. 12, 3653–3655 (2010). 10.1039/b925741a [DOI] [PubMed] [Google Scholar]
- 9. Suzuki T., “ Time-resolved photoelectron spectroscopy of non-adiabatic electronic dynamics in gas and liquid phases,” Int. Rev. Phys. Chem. 31, 265–318 (2012). 10.1080/0144235X.2012.699346 [DOI] [Google Scholar]
- 10. Lübcke A., Buchner F., Heine N., Hertel I. V., and Schultz T., “ Time-resolved photoelectron spectroscopy of solvated electrons in aqueous NaI solution,” Phys. Chem. Chem. Phys. 12, 14629–14634 (2010). 10.1039/c0cp00847h [DOI] [PubMed] [Google Scholar]
- 11. Link O., Lugovoy E., Siefermann K., Liu Y., Faubel M., and Abel B., “ Ultrafast electronic spectroscopy for chemical analysis near liquid water interfaces: concepts and applications,” Appl. Phys. A 96, 117–135 (2009). 10.1007/s00339-009-5179-1 [DOI] [Google Scholar]
- 12. Faubel M., Siefermann K., Liu Y., and Abel B., “ Ultrafast soft X-ray photoelectron spectroscopy at liquid water microjets,” Acc Chem. Res. 45, 120–130 (2012). 10.1021/ar200154w [DOI] [PubMed] [Google Scholar]
- 13. Suzuki Y.-I., Nishizawa K., Kurahashi N., and Suzuki T., “ Effective attenuation length of an electron in liquid water between 10 and 600 eV,” Phys. Rev. E 90, 010302 (2014). 10.1103/PhysRevE.90.010302 [DOI] [PubMed] [Google Scholar]
- 14. Gibson E. A., Paul A., Wagner N., Tobey R., Backus S., Christov I. P., Murnane M. M., and Kapteyn H. C., “ High-order harmonic generation up to 250 eV from highly ionized argon,” Phys. Rev. Lett. 92, 033001 (2004). 10.1103/PhysRevLett.92.033001 [DOI] [PubMed] [Google Scholar]
- 15. Siffalovic P., Drescher M., Spieweck M., Wiesenthal T., Lim Y. C., Weidner R., Elizarov A., and Heinzmann U., “ Laser-based apparatus for extended ultraviolet femtosecond time-resolved photoemission spectroscopy,” Rev. Sci. Instrum. 72, 30–35 (2001). 10.1063/1.1329904 [DOI] [Google Scholar]
- 16. Miaja-Avila L., Lei C., Aeschlimann M., Gland J. L., Murnane M. M., Kapteyn H. C., and Saathoff G., “ Laser-assisted photoelectric effect from surfaces,” Phys. Rev. Lett. 97, 113604 (2006). 10.1103/PhysRevLett.97.113604 [DOI] [PubMed] [Google Scholar]
- 17. Christensen B. H., Raarup M. K., and Balling P., “ Photoemission with high-order harmonics: A tool for time-resolved core-level spectroscopy,” Nucl. Instrum. Methods Phys. Res. A 615, 114–126 (2010). 10.1016/j.nima.2009.12.078 [DOI] [Google Scholar]
- 18. Frank F., Arrell C., Witting T., Okell W. A., McKenna J., Robinson J. S., Haworth C. A., Austin D., Teng H., Walmsley I. A., Marangos J. P., and Tisch J. W. G., “ Invited review article: Technology for attosecond science,” Rev. Sci. Instrum. 83, 071101 (2012). 10.1063/1.4731658 [DOI] [PubMed] [Google Scholar]
- 19. Link O., Vöhringer-Martinez E., Lugovoj E., Liu Y., Siefermann K., Faubel M., Grubmüller H., Gerber R. B., Miller Y., and Abel B., “ Ultrafast phase transitions in metastable water near liquid interfaces,” Faraday Discuss. 141, 67–79 (2009). 10.1039/B811659H [DOI] [PubMed] [Google Scholar]
- 20. Wernet P., Gaudin J., Godehusen K., Schwarzkopf O., and Eberhardt W., “ Femtosecond time-resolved photoelectron spectroscopy with a vacuum-ultraviolet photon source based on laser high-order harmonic generation,” Rev. Sci. Instrum. 82, 063114 (2011). 10.1063/1.3600901 [DOI] [PubMed] [Google Scholar]
- 21. Frietsch B., Carley R., Döbrich K., Gahl C., Teichmann M., Schwarzkopf O., Wernet P., and Weinelt M., “ A high-order harmonic generation apparatus for time-and angle-resolved photoelectron spectroscopy,” Rev. Sci. Instrum. 84, 075106 (2013). 10.1063/1.4812992 [DOI] [PubMed] [Google Scholar]
- 22. Chiang C.-T., Blättermann A., Huth M., Kirschner J., and Widdra W., “ High-order harmonic generation at 4 MHz as a light source for time-of-flight photoemission spectroscopy,” Appl. Phys. Lett. 101, 071116 (2012). 10.1063/1.4746264 [DOI] [Google Scholar]
- 23. Grazioli C., Callegari C., Ciavardini A., Coreno M., Frassetto F., Gauthier D., Golob D., Ivanov R., Kivimäki A., Mahieu B., Bučar B., Merhar M., Miotti P., Poletto L., Polo E., Ressel B., Spezzani C., and De Ninno G., “ CITIUS: An infrared-extreme ultraviolet light source for fundamental and applied ultrafast science,” Rev. Sci. Instrum. 85, 023104 (2014). 10.1063/1.4864298 [DOI] [PubMed] [Google Scholar]
- 24. Dakovski G. L., Li Y., Durakiewicz T., and Rodriguez G., “ Tunable ultrafast extreme ultraviolet source for time- and angle-resolved photoemission spectroscopy,” Rev. Sci. Instrum. 81, 073108 (2010). 10.1063/1.3460267 [DOI] [PubMed] [Google Scholar]
- 25. Frassetto F., Cacho C., Froud C. A., Turcu I., Villoresi P., Bryan W. A., Springate E., and Poletto L., “ Single-grating monochromator for extreme-ultraviolet ultrashort pulses,” Opt. Express 19, 19169–19181 (2011). 10.1364/OE.19.019169 [DOI] [PubMed] [Google Scholar]
- 26. Poletto L., Villoresi P., Benedetti E., Ferrari F., Stagira S., Sansone G., and Nisoli M., “ Intense femtosecond extreme ultraviolet pulses by using a time-delay-compensated monochromator,” Opt. Lett. 32, 2897–2899 (2007). 10.1364/OL.32.002897 [DOI] [PubMed] [Google Scholar]
- 27. Ito M., Kataoka Y., Okamoto T., Yamashita M., and Sekikawa T., “ Spatiotemporal characterization of single-order high harmonic pulses from time-compensated toroidal-grating monochromator,” Opt. Express 18, 6071 (2010). 10.1364/OE.18.006071 [DOI] [PubMed] [Google Scholar]
- 28. Ibek M., Leitner T., Erko A., Firsov A., and Wernet P., “ Monochromatizing and focussing femtosecond high-order harmonic radiation with one optical element,” Rev. Sci. Instrum. 84, 103102 (2013). 10.1063/1.4822114 [DOI] [PubMed] [Google Scholar]
- 29. Metje J., Borgwardt M., Moguilevski A., Kothe A., Engel N., Wilke M., Al-Obaidi R., Tolksdorf D., Firsov A., Brzhezinskaya M., Erko A., Yu Kiyan I., and Aziz E. F., “ Monochromatization of femtosecond XUV light pulses with the use of reflection zone plates,” Opt. Express 22, 10747–10760 (2014). 10.1364/OE.22.010747 [DOI] [PubMed] [Google Scholar]
- 30. Arrell C., Ojeda J., Sabbar M., Okell W., Witting T., Siegel T., Diveki Z., Hutchinson S., Gallmann L., Keller U., van Mourik F., Chapman R. T., Cacho C., Rodrigues N., Turcu I. C. E., Tisch J. W. G., Springate E., Marangos J. P., and Chergui M., “ A simple electron time-of-flight spectrometer for ultrafast vacuum ultraviolet photoelectron spectroscopy of liquid solutions,” Rev. Sci. Instrum. 85, 103117 (2014). 10.1063/1.4899062 [DOI] [PubMed] [Google Scholar]
- 31. Takahashi E. J., Nabekawa Y., and Midorikawa K., “ Low-divergence coherent soft X-ray source at 13 nm by high-order harmonics,” Appl. Phys. Lett. 84, 4–6 (2004). 10.1063/1.1637949 [DOI] [Google Scholar]
- 32. Valentin C., Douillet D., Kazamias S., Lefrou T., Grillon G., Augé F., Mullot G., Balcou P., Mercére P., and Zeitoun P., “ Imaging and quality assessment of high-harmonic focal spots,” Opt. Lett. 28, 1049–1051 (2003). 10.1364/OL.28.001049 [DOI] [PubMed] [Google Scholar]
- 33. Schins J. M., Breger P., Agostini P., Constantinescu R. C., Muller H. G., Grillon G., Antonetti A., and Mysyrowicz A., “ Observation of laser-assisted auger decay in argon,” Phys. Rev. Lett. 73, 2180–2183 (1994). 10.1103/PhysRevLett.73.2180 [DOI] [PubMed] [Google Scholar]
- 34. Glover T. E., Schoenlein R. W., Chin A. H., and Shank C. V., “ Observation of laser assisted photoelectric effect and femtosecond high order harmonic radiation,” Phys. Rev. Lett. 76, 2468–2471 (1996). 10.1103/PhysRevLett.76.2468 [DOI] [PubMed] [Google Scholar]
- 35. Bouhal A., Evans R., Grillon G., Mysyrowicz A., Breger P., Agostini P., Constantinescu R., Muller H., and Von der Linde D., “ Cross-correlation measurement of femtosecond noncollinear high-order harmonics,” J. Opt. Soc. Am. B 14, 950–956 (1997). 10.1364/JOSAB.14.000950 [DOI] [Google Scholar]
- 36. Holstein W. L., Hayes L. J., Robinson E. M., Laurence G. S., and Buntine M. A., “ Aspects of electrokinetic charging in liquid microjets,” J. Phys. Chem. B 103, 3035–3042 (1999). 10.1021/jp984336v [DOI] [Google Scholar]
- 37. Preissler N., Buchner F., Schultz T., and Lübcke A., “ Electrokinetic charging and evidence for charge evaporation in liquid microjets of aqueous salt solution,” J. Phys. Chem. B 117, 2422–2428 (2013). 10.1021/jp304773n [DOI] [PubMed] [Google Scholar]
- 38. Kurahashi N., Karashima S., Tang Y., Horio T., Abulimiti B., Suzuki Y. I., Ogi Y., Oura M., and Suzuki T., “ Photoelectron spectroscopy of aqueous solutions: Streaming potentials of NaX (X= Cl, Br, and I) solutions and electron binding energies of liquid water and ,” J. Chem. Phys. 140, 174506 (2014). 10.1063/1.4871877 [DOI] [PubMed] [Google Scholar]
- 39. Hertel I. V. and Schulz C.-P., “ Molecular spectroscopy,” in Atoms, Molecules and Optical Physics 2 ( Springer, 2015), pp. 289–381. [Google Scholar]
- 40. Potts A. and Price W., “ Photoelectron spectra and valence shell orbital structures of groups V and VI hydrides,” Proc. R. Soc. London Ser. A 326, 181–197 (1972). 10.1098/rspa.1972.0004 [DOI] [Google Scholar]
- 41. Reutt J., Wang L., Lee Y., and Shirley D., “ Molecular beam photoelectron spectroscopy and femtosecond intramolecular dynamics of H2O+ and D2O+,” J. Chem. Phys. 85, 6928–6939 (1986). 10.1063/1.451379 [DOI] [Google Scholar]
- 42. Truong S., Yencha A., Juarez A., Cavanagh S., Bolognesi P., and King G., “ Threshold photoelectron spectroscopy of H2O and D2O over the photon energy range 12–40 eV,” Chem. Phys. 355, 183–193 (2009). 10.1016/j.chemphys.2008.12.009 [DOI] [Google Scholar]
- 43. Végh J., “ The Shirley background revised,” J. Electron Spectrosc. Relat Phenom 151, 159–164 (2006). 10.1016/j.elspec.2005.12.002 [DOI] [Google Scholar]


