Abstract
Time-resolved X-ray absorption spectroscopy was performed for aqueous ammonium iron(III) oxalate trihydrate solutions using an X-ray free electron laser and a synchronized ultraviolet laser. The spectral and time resolutions of the experiment were 1.3 eV and 200 fs, respectively. A femtosecond 268 nm pulse was employed to excite [Fe(III)(C2O4)3]3− in solution from the high-spin ground electronic state to ligand-to-metal charge transfer state(s), and the subsequent dynamics were studied by observing the time-evolution of the X-ray absorption spectrum near the Fe K-edge. Upon 268 nm photoexcitation, the Fe K-edge underwent a red-shift by more than 4 eV within 140 fs; however, the magnitude of the redshift subsequently diminished within 3 ps. The Fe K-edge of the photoproduct remained lower in energy than that of [Fe(III)(C2O4)3]3−. The observed red-shift of the Fe K-edge and the spectral feature of the product indicate that Fe(III) is upon excitation immediately photoreduced to Fe(II), followed by ligand dissociation from Fe(II). Based on a comparison of the X-ray absorption spectra with density functional theory calculations, we propose that the dissociation proceeds in two steps, forming first [(CO2•)Fe(II)(C2O4)2]3− and subsequently [Fe(II)(C2O4)2]2−.
I. INTRODUCTION
X-ray absorption spectroscopy (XAS) interrogates inner-shell electrons strongly bound to nuclei, and it enables element-specific investigation of the electronic and geometrical structures of molecules. The ionization energy of an inner-shell electron, observed as the absorption edge, varies with the atomic number and exhibits a “chemical shift” that reveals the oxidation state and/or chemical bonding of the atom. An X-ray absorption spectrum also exhibits oscillatory features, termed as extended X-ray absorption fine structure (EXAFS), in the post-edge region owing to scattering of a photoelectron by neighboring atoms. The analysis of EXAFS provides the bond lengths around the atom of interest.
Time-resolved XAS (TRXAS),1–3 which is based on the pump and probe method, utilizes the unique performance of XAS for studies of short-lived chemical species and transient states of matter. Although TRXAS has been previously performed using X-ray sources such as synchrotron radiation,4–6 time-sliced synchrotron radiation,7–10 and laser-induced plasma,11,12 the X-ray pulses from these sources are either long in duration or low in pulse energy, so that TRXAS has been developed along with continuous innovation of the light sources. An X-ray free electron laser (XFEL), which generates X-ray pulses as short as 10 fs with unprecedentedly high pulse energies,13–16 opens new avenues for femtosecond TRXAS.17 Such efforts have already been initiated at LCLS (Linac Coherent Light Source)18,19 and SACLA (SPring-8 Angstrom Compact Free Electron Laser).20
In our previous study,20,21 we reported TRXAS of aqueous solutions carried out with a dual beam multiplex detection method using SACLA. In this method, a transmission grating splits a hard X-ray pulse (FWHM = 30 eV) into two equally intense beams, one of which is transmitted through a sample solution and used as a signal beam.21 The signal beam and the reference beam, which do not pass through the sample, are spectrally dispersed and simultaneously recorded on a shot-to-shot basis. From these signal and reference spectra, an X-ray direct absorption spectrum is obtained for the entire 30 eV spectral bandwidth of the X-ray pulse. The smallest detectable absorbance using an optimized data acquisition algorithm was 0.002.20
The major difficulty of performing TRXAS using a visible/ultraviolet (UV) pump and hard X-ray probe is that the absorption cross-section of chemical species in the X-ray region is several orders of magnitude smaller than that in the visible/UV.2 Consequently, the sample concentration suitable for hard X-ray absorption spectroscopy tends to be too high for the visible/UV pump step, so that the pump pulse is strongly absorbed near the liquid surface and unable to illuminate the entire sample. For successful TRXAS, it is necessary to achieve the highest detection sensitivity of the X-ray absorption at low optical density. With conventional light sources, action spectroscopy, in which the X-ray photon energy is scanned while monitoring the emission intensity of the X-rays, photoelectrons, or photoions, has been proven to achieve higher sensitivity than X-ray direct absorption spectroscopy. However, it is not immediately clear whether action spectroscopy is superior to direct absorption spectroscopy using the dual beam multiplex detection method because the intensity fluctuations of the X-ray pulses are enhanced by monochromatization of the radiation from the SASE (self-amplification of spontaneous radiation) source. Furthermore, action spectroscopy requires the narrow spectral width provided by monochromatized X-rays, e.g., that of ca. 1 eV, which is considerably smaller than that of the direct X-ray beam employed in the dual beam multiplex detection method. Therefore, the high-sensitivity advantage of action spectroscopy may be curtailed by the longer scanning time required to cover the energy region of interest. Thus, it is interesting to examine the performance of X-ray absorption spectroscopy by monitoring the total X-ray fluorescence intensity in combination with SACLA.
In this paper, we present a TRXAS study using SACLA with the total X-ray fluorescence yield (TFY) method. The focus of this work is the photochemistry of ferrioxalate, [Fe(III)(C2O4)3]3−, in aqueous solution. Polycarboxylates, including oxalate, are common constituents of precipitation, aerosol, and surface water. [Fe(III)(C2O4)3]3− undergoes a rapid photochemical reaction under sunlight that induces the decomposition of contaminants in natural water22 and is also employed as a chemical actinometer.23 Although the overall photochemical reaction of [Fe(III)(C2O4)3]3− in aqueous solution is known to be a photoreduction reaction, which is often expressed as 2[Fe(III)(C2O4)3]3− + hν → 2[Fe(II)(C2O4)2]2− + 2CO2 + C2O42−, the elementary steps of this reaction have not yet been elucidated. It has been speculated that photoexcitation in the UV region induces ligand-to-metal charge transfer (LMCT) followed by metal–ligand bond cleavages as follows:
| (1) |
where s is a spin quantum number; the electronic ground state of [Fe(III)(C2O4)3]3− is a high spin (HS) state (s = 5/2). The quantum yield of Fe(II) exceeds unity24–26 and also varies with the concentration of the solution and the presence of radical scavengers, which indicates that a ligand, C2O4•− (or CO2 + CO2•−), is dissociated from the complex, inducing a secondary reduction reaction with a different [Fe(III)(C2O4)3]3− complex in solution. On the other hand, Chen et al. proposed a different reaction mechanism based on their time-resolved X-ray absorption spectroscopy measurements performed using a table-top laser-driven X-ray source.27,28 They estimated the Fe-O bond length of transient species from the X-ray absorption spectra and suggested that the bond length varies within 10 ps to finally reach 0.19 nm in the primary photoproduct. Although this length was too short to correspond to the Fe(II)-O bond, it agreed with the expected Fe(III)-O distance in [Fe(III)(C2O4)2]−. Thus, Chen et al. proposed that the primary photochemical reaction for both 400 and 266/267 nm photoexcitation is27,28
| (2) |
In this scenario, photoexcitation creates [Fe(III)(C2O4)2]− and the reduction of Fe(III) is caused entirely by a secondary reduction reaction initiated by the dissociated ligands.
There are also additional reaction channels, which are considered to be less important. For example, the charge-transfer-to-solvent (CTTS) reaction can possibly create a hydrated electron as follows:
| (3) |
Regarding reaction (3), previous transient absorption spectroscopy measurements have identified two visible absorption bands in the regions of 500–800 and 380–500 nm corresponding to photoproducts,27,28 of which the former is assigned to a hydrated electron, while assignment of the latter has not yet been established. Goldstein and Rabani observed that the quantum yield of Fe(II) varies with the photoexcitation wavelength, 1.24 at λ > 270 nm to 1.48 at λ < 250 nm, from which they speculated that the yield of a hydrated electron increases in the region below 250 nm.25 Nevertheless, the quantum yield of a hydrated electron has been determined to be 0.05 for 266/267 nm photoexcitation; therefore, reaction (3) is unimportant in our experiment using 268 nm. Additionally, the non-reactive spin cross-over dynamics (or intersystem crossing process) indicated below creates low spin (LS) states
| (4) |
However, because reaction (4) is not an overall reduction process, it is not considered to be the primary reaction pathway.
As for reactions (1) and (2), there has also been speculation that a pentacoordinated complex is formed as an intermediate as follows:
| (5) |
When two metal-ligand bonds are not dissociated simultaneously, a radical complex is created as a transient species. Chen et al. have proposed that the radical intermediate [(C2O3O−)Fe(III) (C2O4)2]3− is created upon excitation and decomposes within 5 ps.28 On the other hand, Pozdnyakov et al. have performed nanosecond flash photolysis using 355 nm excitation and argued that the yield of organic radicals (CO2•− and C2O4•−) expected for reactions (1) and (2) is only 0.06, indicating that the primary product of [Fe(III)(C2O4)3]3− is [(C2O4•)Fe(II) (C2O4)2]3− with a long lifetime (longer than a microsecond).29–31
In the present study, we investigate the ultrafast dynamics of a photochemical reaction of [Fe(III)(C2O4)3]3− upon 268 nm photoexcitation from the viewpoint of near-edge X-ray absorption fine structure (NEXAFS) at the Fe K-edge. The spectral and time resolutions of the experiment were 1.3 eV and 200 fs, respectively. To aid the interpretation of our experimental results, we also perform electronic structure calculations using density functional theory (DFT) and time-dependent DFT (TDDFT).
II. EXPERIMENT
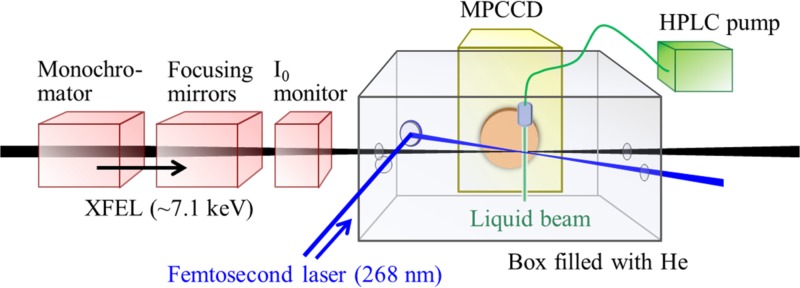
Figure 1 schematically shows our experimental setup for TFY-TRXAS. The sample is an aqueous 0.1M solution of ammonium iron(III) oxalate trihydrate, (NH4)3[Fe(C2O4)3]·3H2O. The solution was pressurized using a gradient-flow high performance liquid chromatography (HPLC) pump with a built-in degasser and was discharged from a fused silica capillary with a 50 μm inner diameter. To prevent decomposition of the sample by room light, the sample bottle was covered with aluminum foil and the solution was not recycled for repeated measurements. The central photon energy of the hard X-ray pulse was tuned for the Fe K-edge by adjusting the accelerator conditions and the undulator of SACLA. The X-ray bandwidth was decreased to 1.3 eV (FWHM) using a Si(111) X-ray monochromator. The monochromatized X-ray beam was focused on the sample solution by a pair of Kirkpatrick-Baez mirrors,32 which produced a focal spot diameter of 1.5 μm, as measured by knife-edge scanning using a 200 μm gold wire. The repetition rate of SACLA was 30 Hz. The X-ray pulse intensity was monitored by reflecting a small portion of the pulse from a Kapton film tilted at 45° with respect to the X-ray k-vector into a homemade instrument (I0 monitor, Figure 1).
FIG. 1.
Schematic diagram of our experimental setup.
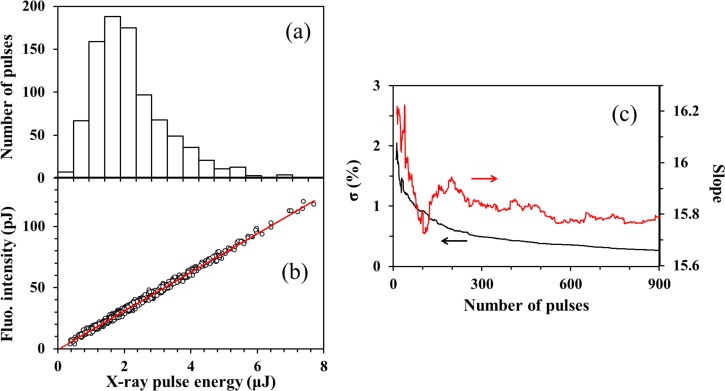
The X-ray fluorescence from the sample was detected using a multi-port charge-coupled device (MPCCD) sensor.33 We covered the detector surface with a Kapton film and a beryllium plate to protect it from accidental splash of the liquid. The 25.6 × 51.2 mm2 detection area of the MPCCD and the 100 mm distance between the sample and the detector surface provide a fluorescence detection solid angle of 0.12 sr. The dynamic range of the MPCCD was 2000 photons/pixel and its quantum efficiency was 0.8 at a X-ray photon energy of 6.4 kV. Because SACLA is an SASE-XFEL, the X-ray pulse intensity and spectrum fluctuate on a shot to shot basis. Moreover, the intensity fluctuations of the monochromatized radiation are greater than that of the undispersed direct X-ray beam. A representative intensity histogram of 900 monochromatized X-ray pulses (hν = 7.125 keV) is shown in Figure 2(a), for which the average pulse energy was 2.3 μJ/pulse. Figure 2(b) shows the correlation between the fluorescence intensity and the X-ray pulse intensity (hν = 7.125 keV). The X-ray fluorescence intensity, F, is expressed as
where E is the photon energy, C is a constant, is the photoabsorption cross-section, Φfluo is the fluorescence quantum yield (approximated as being independent of energy), Φdet is the detection quantum yield, and P(E) is the X-ray pulse energy. Thus, the relative absorption intensity is related to the slope of F against P
FIG. 2.
(a) Histogram of the X-ray pulse energy for 900 shots. (b) Shot-to-shot fluorescence intensity plotted against the X-ray pulse energy obtained at an X-ray photon energy of 7.125 keV. The slope obtained using linear least squares fitting is taken as the fluorescence intensity. (c) Variation of the slope (red) and its standard deviation (black) as a function of the number of X-ray shots.
Figure 2(c) presents the averaged value and standard deviation of the slope (CσabsΦfluoΦdet) determined for different numbers of X-ray pulses; the result indicates that the slope is determined with an accuracy of higher than 0.5% when it is calculated using more than 300 X-ray shots.
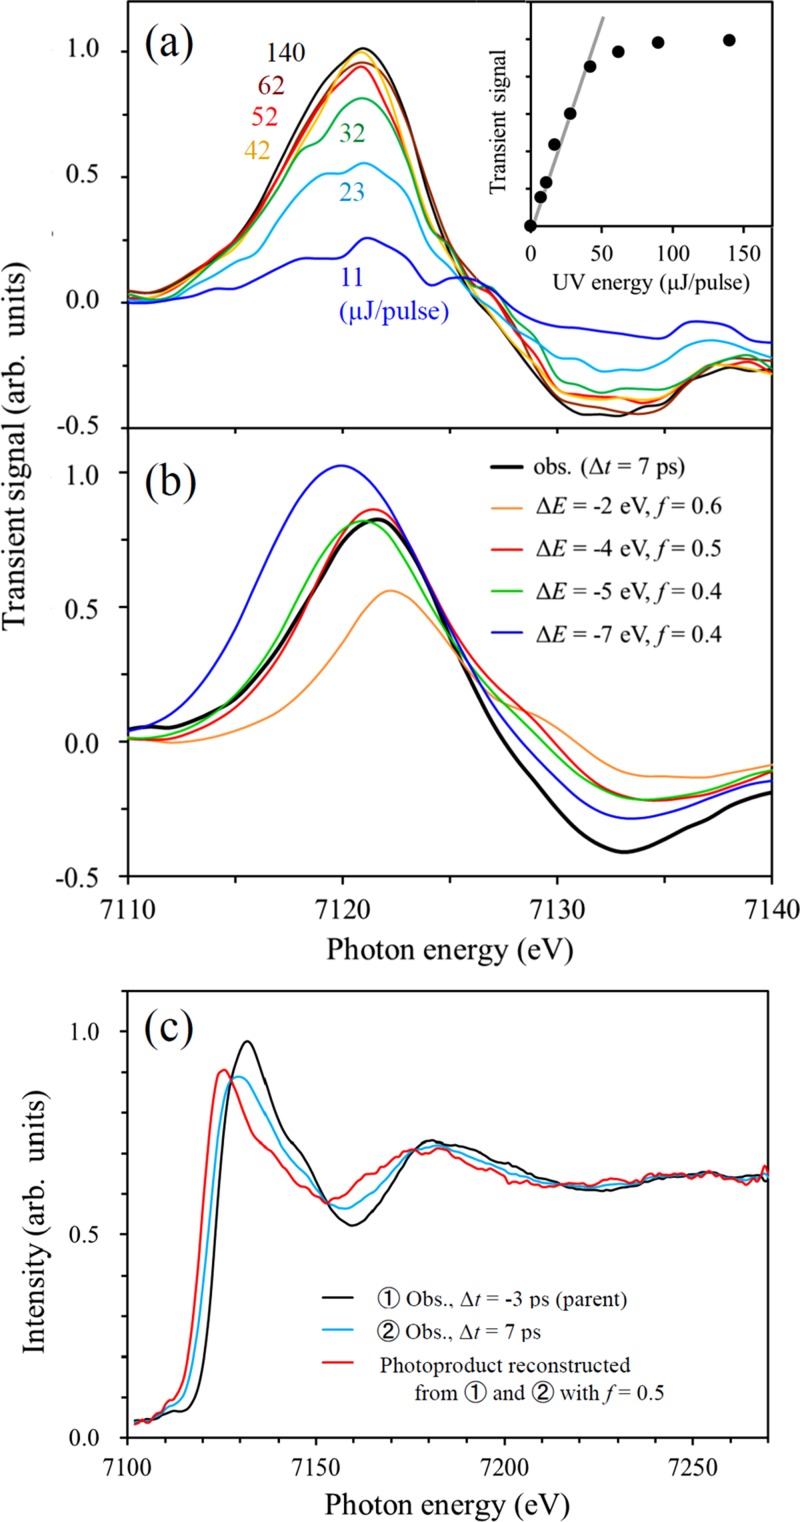
The 268 nm excitation pulse (100 fs) was the third harmonic of a Ti:sapphire laser, generated using two β-BaB2O4 crystals for frequency doubling and mixing. As described in our previous paper,20 the output from a 1 kHz Ti:sapphire regenerative amplifier was boosted up using a separate two-pass amplifier operated at 60 Hz. The 60 Hz pulse train was reduced to 30 Hz using a chopper wheel, and the beam was focused on the sample using an axisymmetric lens (f = 300 mm). The cross-correlation between the UV and X-ray pulses is estimated as 200 fs considering the timing jitter between SACLA and the synchronized laser, as well as an estimated UV pulse duration. The effective spot diameter at the sample position was estimated to be 150 μm by monitoring the transient X-ray fluorescence intensity while moving the 268 nm light against the fixed liquid beam; the spatial mode monitored using a beam profiler exhibited deviation from an ideal Gaussian profile. The crossing angle between the k-vectors of the 268 nm and X-ray beams was less than 10°. As will be presented later in Figure 6, we measured the 268 nm pulse-energy dependence of the transient absorption spectrum and found that the absorption intensity varied linearly with the UV pulse energy up to ca. 40 μJ. The transient absorption time profiles were measured at higher pulse energy of 90 μJ to compensate for low signal-to-noise ratio; the results were consistent between the spectra obtained at 42 μJ/pulse and the time profiles at 90 μJ/pulse. Spectroscopic scans were performed primarily at a UV pulse energy of 42 μJ. When the 268 nm pulse energy exceeded 90 μJ, visible emission was observed due to breakdown of the sample solutions. From the molar extinction coefficient of the sample at 268 nm (4800 cm−1 M−1) and the number of molecules in the UV path (2.3 × 10¹³), the excitation efficiency was expected to exceed 50%. Ray tracing suggests that optical refraction at the air-liquid interface and internal reflection in the cylindrical liquid beam introduces spatial variation of the UV intensity in the liquid. However, our X-ray beam diameter was very narrow (1.5 μm) and passed through the middle of the liquid beam, where the UV intensity was uniform.
FIG. 6.
(a) Dependence of the difference spectrum on the 268 nm pulse energy. The inset shows the absorption peak intensity as a function of UV pulse energy. (b) Comparison of the observed difference spectrum and simulated spectra assuming various K-edge shifts (ΔE) and fractional populations of the photoproducts (f). The simulated spectra are in reasonable agreement with the observed one when ΔE is assumed to be −4 and −5 eV. (c) Reconstructed spectrum of the photoproduct (red) generated from the static spectrum of [Fe(III)(C2O4)3]3− (s = 5/2) (black) and the difference spectrum measured at t = 7 ps (blue), assuming f = 0.5.
The timing of the UV pulses with respect to the X-ray pulses was crudely adjusted using an electronic delay circuit and subsequently fine-tuned using a computer-controlled linear translation stage in the UV beam line. The electronic timing system exhibited drifting that depended on experimental conditions such as temperature in the SACLA facility; therefore, we checked the timing at regular intervals during our measurements to determine the accurate pump-probe delay times.
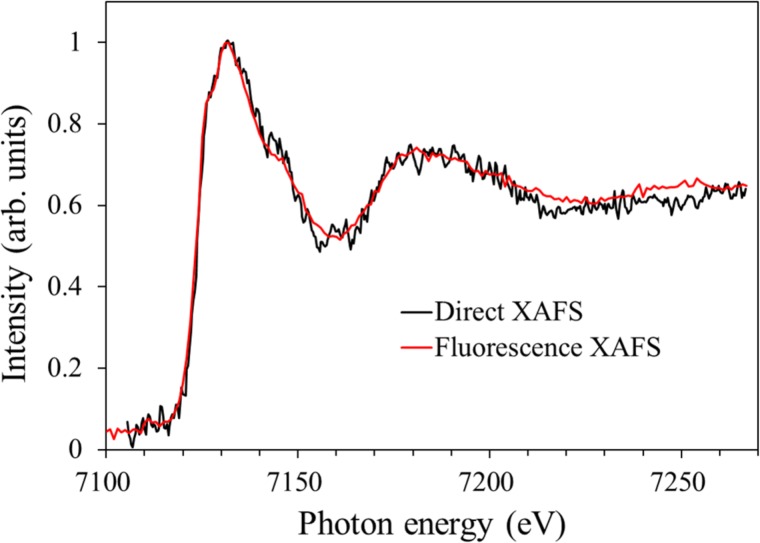
Figure 3 compares our X-ray absorption spectra of the [Fe(III)(C2O4)3]3− complex measured using the dual beam multiplex detection method20 with the results of the TFY method (this study). The peak positions in the two spectra are in excellent agreement (within 0.5 eV), which confirms the accuracy of our measurements. For the dual beam multiplex detection method, the minimum detectable absorbance change when using 10 000 X-ray pulses was 0.002 at an absorbance of 0.1, corresponding to 2%. The average pulse energy and the bandwidth were 1.4 μJ and 30 eV, respectively. For the TFY method, the standard deviation of the absorbance calculated from the correlation between the incident X-ray pulse energy and X-ray fluorescence intensity was 0.4% for 600 X-ray pulses. The average pulse energy and the bandwidth were 2.2 μJ and 1.3 eV, respectively. The effective photon flux within the same bandwidth is 2.2 times higher for the TFY method than the dual beam multiplex detection method. Assuming the same bandwidth and photon flux, the signal-to-noise ratio of the TFY method is calculated to be three times higher than that of the dual beam multiplex detection method. However, we also note that the product of the sample concentration and optical path length used for the TFY method was 10 times smaller than that for the dual beam multiplex detection method. Therefore, the overall sensitivity of the TFY method is higher than the dual beam multiplex detection method by an order of magnitude. The spectra of [Fe(III)(C2O4)3]3− reported by Chen et al.27,28 are inconsistent with each other and are different from ours, suggesting that their energy calibration was not quite accurate. Additionally, the 1.3 eV spectral resolution of our study is considerably higher than the 20 eV resolution of their study.27,28 The higher signal-to-noise ratio of the TFY method compared with the dual beam multiplex detection method enabled observation of a small pre-edge peak at 7111 eV, which is ascribed to a bound-to-bound electronic transition from a high-spin ground state (s = 5/2) of [Fe(III)(C2O4)3]3− to excited state(s).
FIG. 3.
X-ray absorption spectra of aqueous [Fe(III)(C2O4)3]3− solutions measured using the dual beam multiplex detection method (black) and the TFY method (red). With the former method, a single absorption spectrum covering the 30 eV bandwidth of an X-ray pulse was obtained on a shot-to-shot basis and integrated for 10 000 shots. Five such spectra were similarly measured for different energy regions by shifting the X-ray pulse spectrum, and these were then combined to obtain the entire spectrum, shown in black. The sample concentration used for this method was 500 mM. With the latter method, monochromatized X-ray pulses (spectral width of 1.3 eV) were generated and energy-scanned stepwise over the original 30 eV bandwidth to obtain a single spectrum. The detected fluorescence intensity was averaged for 600–1200 shots at each X-ray energy step in the scanned region. Five such spectra were combined to produce the spectrum shown in red. The sample concentration used for the TFY method was 100 mM.
III. THEORETICAL CALCULATIONS
We performed electronic structure calculations on [Fe(III)(C2O4)3]3− and its possible reaction products using the DFT (for ground states) and TDDFT (for excited states) methods.34 The geometries of the complexes were optimized at the DFT level using different DFT functionals (BLYP, B3LYP, BHandHLYP, and LC-wPBE yielded similar results) with the aug-cc-pVDZ basis set for carbon and oxygen and a Stuttgart relativistic small-core pseudopotential35 with a corresponding double zeta basis set for iron. The polarizable continuum model was used within the optimization.36,37 The UV absorption spectrum of the ferrioxalate complex was calculated with TDDFT. As charge transfer states are involved in the electronic transitions, we used the BMK functional38 with a large contribution of exact exchange. The spectral shape was obtained using an empirical broadening scheme.39 The character of the transitions was investigated by constructing the Natural Transition Orbitals (NTO).40 The first excited state was optimized on the TDDFT/BMK (Boese-Martin for Kinetics) level. The relative core ionization energies were modeled with TDDFT as excitations from core orbitals into a distant center. We employed the BHandHLYP functional with def2-TZVP(-f) using a ZORA Hamiltonian. The solvent effects were modeled within a dielectric continuum framework using an optical part of the dielectric function, taking into account the non-equilibrium character of solvation during the excitation and ionization processes. The geometry optimization and valence excited state calculations were performed in the Gaussian09 code,41 and the core-excited TDDFT calculations were performed in the ORCA code.42
IV. RESULTS
A. TRXAS upon 268 nm photoexcitation
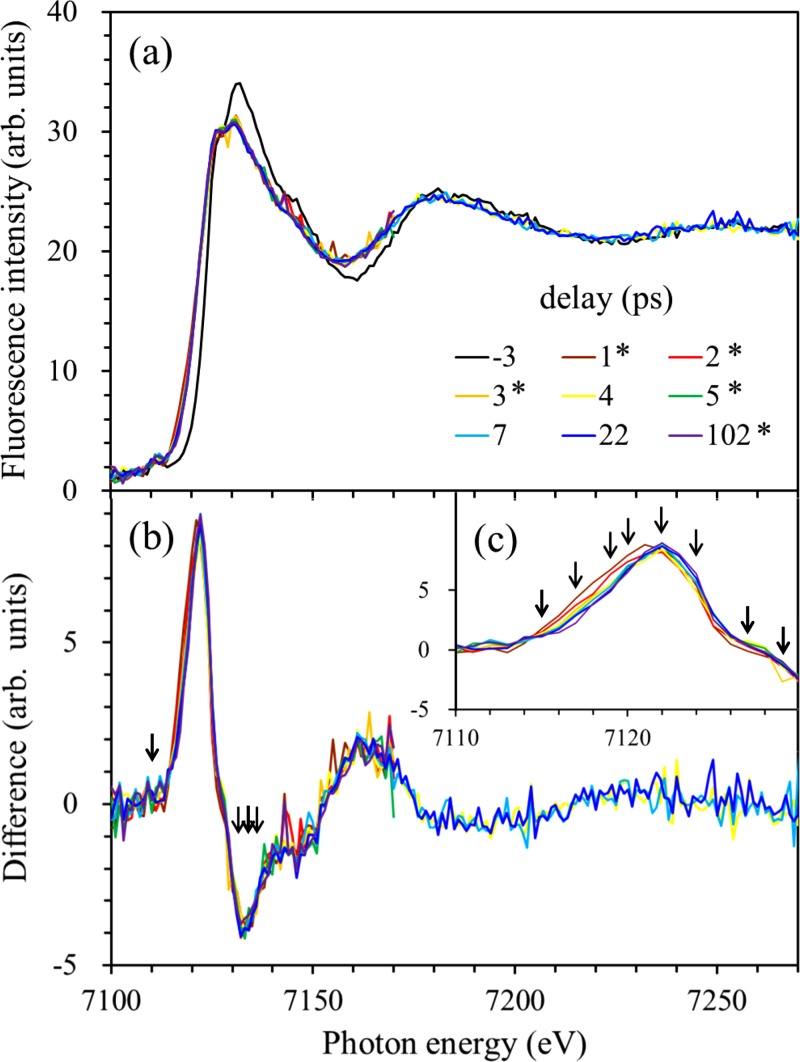
Figure 4(a) shows the observed X-ray absorption spectra of aqueous 0.1M ammonium iron(III) oxalate trihydrate solution at selected pump-probe delay times. The spectra reveal a clear change upon UV irradiation, particularly in the region from the K-edge up to 7180 eV. The K-edge exhibits a distinct red-shift after the generation of transient species by the 268 nm pulse, which indicates that the K-edges of the transients are lower in energy than that of the parent. We find noticeable differences between our spectra and those reported previously by Chen et al. using a laser-based X-ray source.28 For example, we observed a red-shift of the K-edge, in contrast to the blue-shift they reported28 for 267 nm photoexcitation of [Fe(III)(C2O4)3]3−. Additionally, our X-ray absorption spectra exhibit only small spectral changes after 1 ps, while their spectra exhibit a progressive blue-shift and spectral evolution even after 2 ps.28 Although the reason for these differences is unclear at this point, they lead to different conclusions between the two studies, as explained below.
FIG. 4.
(a) Time-resolved X-ray absorption spectra of an aqueous [Fe(III)(C2O4)3]3− solution observed at various time delays. The excitation wavelength is 268 nm. (b) Difference spectra between those obtained at positive delay times and that measured at a delay of −3 ps. (c) Expanded views of the reddest region of the difference spectra, revealing that the magnitude of the K-edge shift diminishes within 3 ps. The arrows in the figure are the excitation energies at which the decay profiles were measured, as shown in Fig. 5.
Figure 4(b) shows the difference spectra calculated from the observed spectra shown in Figure 4(a), obtained by subtracting the spectrum measured at −3 ps from those measured at positive time delays. Close examination of the blowup view of the K-edge region, presented as Figure 4(c), reveals that the magnitude of the red-shift of the K-edge subsequently diminishes within 3 ps. A pre-edge peak is seen at 7111 eV in all of the spectra in Figure 4(a), while it is not discernible in the difference spectra shown in Figure 4(b).
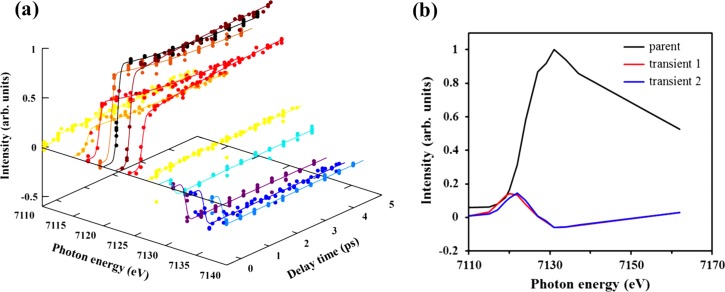
To examine the ultrafast change of the absorption spectrum around the K-edge more closely, we have measured time profiles of the X-ray fluorescence intensities at 13 different X-ray photon energies and performed a global fit. The arrows shown in Figure 4 indicate the X-ray photon energies employed for these measurements. Figure 5(a) displays examples of observed time profiles and the fitted decay curves. The time profiles at 7115–7120 eV exhibit an immediate rise followed by decays, while those in the 7130–7140 eV region exhibit bleach upon UV irradiation and subsequent partial recovery. The fitted decay curves reproduce the experimentally observed time profiles very well. Using the global fit, we extracted three spectral components, as shown in Figure 5(b), in which the black line indicates the X-ray absorption spectrum of the parent and other colors indicate the spectra of transient species. These transient signals have enhanced absorption in the energy region below 7125 eV while exhibiting negative signal in the region around 7130 eV, which is due to bleaching of the parent. The transient species shown in red and blue colors appear with time constants of 140 fs and 3 ps, respectively.
FIG. 5.
(a) Time profiles of the X-ray fluorescence intensities at different X-ray photon energies and the global fit of the exponential decay curves; the X-ray photon energies employed for these measurements are indicated by the arrows shown in Fig. 4. (b) X-ray absorption spectrum of transient species extracted using the global fit.
The transient absorption spectra shown in Figures 4 and 5 are the sum of the spectra of the parent and transient species. To extract the contribution due to transient species from the overall absorption spectrum, the UV excitation efficiency must be estimated. We performed this estimation by measuring the pump pulse energy dependence of the difference spectrum, as shown in Figure 6(a). The intensity of the difference spectrum increased linearly with the UV pulse energy up to ca. 40 μJ, after which it was saturated; the spectral features were independent of the UV pulse energy within the range we examined. This result suggests that when using a pump pulse energy of 42 μJ, the fractional population (f: 0 ≦ f ≦ 1) of excited complexes reaches 0.5 or larger. In Figure 6(b), we simulated the difference spectrum by approximating the spectrum of a photoproduct with a red-shifted spectrum of the parent with K-edge shifts of −2, −4, −5, and −7 eV and found the best-fit f values for each case. Assuming a K-edge shift of less than 3 eV or greater than 6 eV poorly reproduces the observed difference spectrum, while red-shifts of ca. 4 eV and f ≈ 0.5 reproduce the difference spectrum well. Thus, based on these results we reconstructed the X-ray absorption spectrum of the photoproduct as shown in Figure 6(c) using the static spectrum of the parent, the difference spectrum obtained at Δt = 7 ps, and a fractional population of f = 0.5. We note that the constructed absorption spectrum of the photoproduct exhibits a flatter spectral feature with a diminished amplitude of the oscillatory component in the post-edge region compared with the observed spectrum of [Fe(III)(C2O4)3]3− (s = 5/2). The predicted red-shift for f = 0.5, measured as the difference of the peak positions, is −6 eV.
If the true f value is larger than 0.5, the reconstructed spectrum of a product will exhibit a similarly small amplitude of the oscillatory feature, while the red-shift becomes smaller than −6 eV. For example, if f is unity, the observed spectrum should be entirely of the product and the red-shift becomes ca. −3 eV, measured from the observed peak to peak shift. This result clearly indicates that the red-shift of the K-edge is greater than −3 eV.
B. Possible intermediates: Calculated Fe-O bond distances and K-edge energies
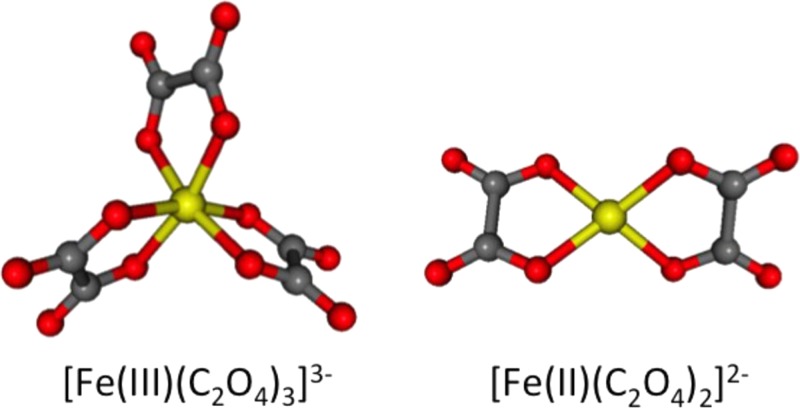
The experiment provides two types of observations that can be compared with theoretical calculations: the Fe-O distances and the K-edge shifts of the intermediate structures. Table I shows the Fe-O bond distances calculated for the parent molecule [Fe(III)(C2O4)3]3− and various product candidates using different levels of theory. Although the absolute values vary with the level of theory, the general trends are the same. The [Fe(III)(C2O4)3]2− complex and the spin crossover complex in the quintet state have asymmetric structures, for which two or three different Fe-O bond distances are predicted. The structures of [Fe(III)(C2O4)3]3− in the ground state and [Fe(II)(C2O4)2]2− are shown graphically in Figure 7. Table I also lists the corresponding values for a transient species, [(CO2•)Fe(II)(C2O4)2]3−, which will be discussed in Sec. V.
TABLE I.
Fe-O bond lengths (in Angstroms) in the parent molecule and possible reaction products.
| [Fe(III)(C2O4)3]3−(s = 5/2) | [Fe(II)(C2O4)2]2− (s = 2) | [(CO2•)Fe(II)(C2O4)2]3− (s = 5/2) | [Fe(III)(C2O4)3]2− (s = 2) | [Fe(III)(C2O4)2]− (s = 5/2) | [Fe(III)(C2O4)3]3− (s = 3/2) | [Fe(III)(C2O4)3]3− (s = 1/2) | |
|---|---|---|---|---|---|---|---|
| B3LYP | 2.04 | 2.04 | 2.14/2.05/2.06/2.12/2.17 | 1.91/2.05 | 1.94 | 2.10/1.96/1.93 | 1.94 |
| BHandHLYP | 2.01 | 2.04 | 2.12/2.06/2.08/2.12/2.11 | 1.92/2.08 | 1.93 | 2.07/1.94/1.90 | 1.92 |
| LC-wPBE | 2.01 | 2.02 | 2.11/2.01/2.03/2.15/2.17 | 1.85/2.02 | 1.92 | 2.08/1.94/1.90 | 1.91 |
| BLYP | 2.07 | 2.04 | 2.09/2.06/2.09/2.08/2.11 | 1.94/2.09 | 1.95 | 2.14/1.99/1.96 | 1.96 |
FIG. 7.
Structures of [Fe(III)(C2O4)3]3− in the ground high-spin state and a dissociation product [Fe(II)(C2O4)2]2−. The structures of [Fe(III)(C2O4)3]3− in other spin states are visually indistinguishable from the ground state structure.
The most robust experimental observation is the red-shift of the Fe K-edge energy. We have therefore estimated the K-edge energies (the binding energies of the 1s electron) of different species using a dielectric continuum model, as shown in Table II. The absolute energies are not sufficiently accurate to directly compare with the experimental values, so the K-edge shifts from the parent are also tabulated in the parentheses. An inspection of Table II reveals that the observed red-shift of the K-edge of greater than 3 eV is predicted only for [Fe(II)(C2O4)2]2− and [(CO2•)Fe(II)(C2O4)2]3−. The [Fe(III)(C2O4)2]− complex is excluded from the product, because a blue-shifted K-edge (+1.4 eV) is expected for it.
TABLE II.
The Fe 1s electron binding energies (in eV) of the parent molecule and possible reaction products. The numbers in the parentheses are relative values.
| [Fe(III)(C2O4)3]3− (s = 5/2) | [Fe(II)(C2O4)2]2− (s = 2) | [(CO2•)Fe(II)(C2O4)2]3− (s = 5/2) | [Fe(III)(C2O4)3]2− (s = 2) | [Fe(III)(C2O4)2] − (s = 5/2) | [Fe(III)(C2O4)3]3− (s = 3/2) | [Fe(III)(C2O4)3]3− (s = 1/2) | |
|---|---|---|---|---|---|---|---|
| TDDFT, dielectric model | 7152.7 (0) | 7147.9 (−4.8) | 7147.0 (−5.7) | 7154.0 (1.3) | 7154.1 (1.4) | 7151.4 (−1.3) | 7150.6 (−2.1) |
C. Comparison of simulated and observed XAS spectra
The oscillatory feature in the post-edge region is caused by interference of the outgoing and scattered photoelectron waves, which enables analysis of the Fe-O bond distance and structural orders around the Fe atom. Accurate determination of the bond length requires measurements of the oscillatory features for more than several hundred eV above the absorption edge; however, such measurements were not possible in the limited beam-time of SACLA provided. Therefore, we have focused on the energy region near the K-edge (7.1–7.27 keV) in this experiment. Although this energy window is too narrow to accurately estimate the Fe-O bond lengths of transient species, we may still be able to examine the consistency between the observed spectra and the assignment of a photoproduct. In the previous study by Chen et al., the Fe-O bond lengths were determined by analysis of the spectra for a similar energy range of 7.05–7.35 keV;28 our spectra cover more than 85% of the spectral region studied in that work.
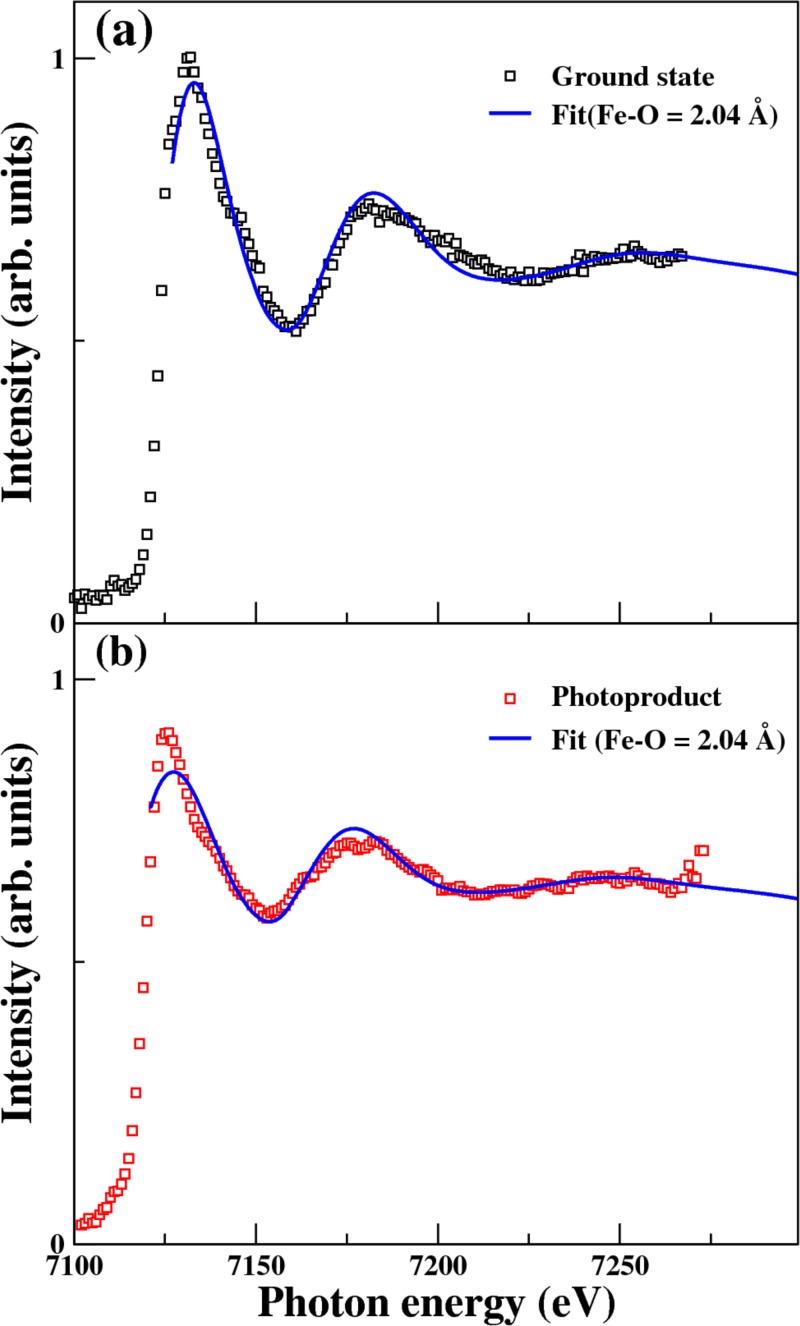
Figure 8(a) compares the observed near-edge structure of the parent molecule, [Fe(III)(C2O4)3]3− with the spectrum simulated using the FEFF6 program43 and the molecular geometry (including all atoms) obtained by our DFT calculations. The observed and calculated spectral features are in very good agreement. Based on this reasonable spectral agreement, we also compare the near-edge structure of the photoproduct (the same spectrum shown in Fig. 6(c)) with the predicted spectra for [Fe(II)(C2O4)2]2− in Figure 8(b). In this case, the predicted spectrum of [Fe(II)(C2O4)2]2−, calculated using an Fe(II)-O bond length of 0.204 nm, agrees reasonably well with the observed spectrum. The red-shift of the Fe K-edge between the parent and product is 6 eV, as mentioned earlier. Because the absorption intensity of the photoproduct in Fig. 8(b) is normalized to the intensity of the parent molecule, the maximum of the absorption intensity appears lower than that of the parent molecule. This is reasonable because the parent molecule exhibits oscillatory features with larger magnitudes, so that the peak of the absorption intensity can be higher than that of the photoproduct.
FIG. 8.
(a) A fit (solid blue line) to the fluorescence X-ray absorption spectra μ(E) (black squares), in which the oscillatory structure χ(E) is given by χ(E) = [μ(E) − μ0(E)]/μ0(E). μ0(E) is a smooth background modeled by a(E − E0) + b with best-fit parameters of a = −0.000357(eV−1), b = 3.22, and E0 = 7127 eV. χ(E) is simulated for the ground state of [Fe(III)(C2O4)3]3− using FEFF6 with the geometries calculated by TDDFT (Fe-O = 2.04 Å). (b) A fit to the reconstructed product absorption spectra (red squares). In this case, χ(E) is simulated for [Fe(II)(C2O4)2]2− (Fe-O = 2.04 Å). The best-fit parameters are a = −0.000393 (eV−1), b = 3.48, and E0 = 7121 eV.
D. Simulated UV absorption spectrum of [Fe(III)(C2O4)3]3−
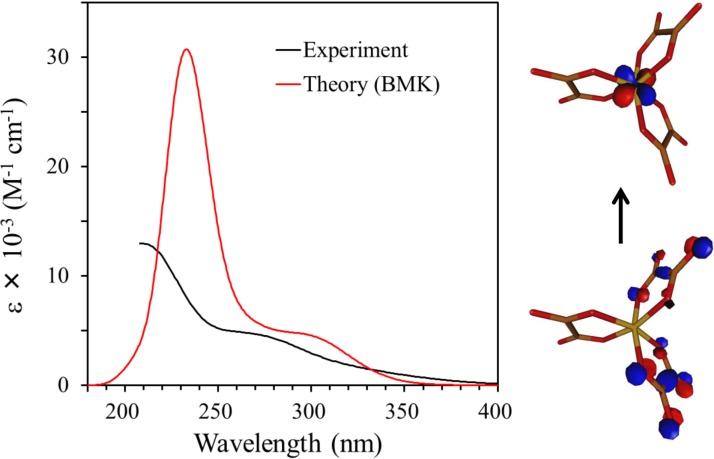
To gain further insight into the character of the excitation process, we have simulated the UV absorption spectrum of the parent [Fe(III)(C2O4)3]3− ion. Figure 9 compares the experimental UV absorption spectrum with the one calculated using the TDDFT method. The calculated spectrum reproduces the experimental spectral features reasonably well even though the calculated band intensity is larger than the experimental value in the high energy region. The smooth calculated spectrum involves 85 individual transitions underneath. The character of the states can be conveniently visualized within the NTO scheme. We have constructed the NTOs for all states contributing non-negligibly to the spectrum. As an example, the dominant NTOs for 15th electronic state are presented on the right panel of Figure 9, clearly revealing the LMCT character of the transition. Similar NTOs are found for all transitions contributing to the absorption band at 270 nm.
FIG. 9.
Experimental (black) and simulated (red) UV absorption spectra of [Fe(III)(C2O4)3]3− in water. The experimental spectrum is available only down to 210 nm. On the right, the dominant natural transition orbitals characterizing the electronic excitation for 15th excited state are shown. The electronic transition predominantly occurs from an occupied ligand orbital to an unoccupied metal atom orbital. Similar natural transition orbitals are observed for other transitions contributing to the same absorption band.
V. DISCUSSION
Presently, the most thoroughly investigated ultrafast dynamics in Fe complexes is the spin crossover dynamics of the Fe(II) complex. The 3d orbitals of an Fe atom in an octahedral ligand field split into the eg and t2g orbitals, and the interaction of an Fe(II) atom with strong-field ligands such as CN− or bipyridine creates the LS ground state with a fully occupied HOMO of (t2g).6 Photoexcited Fe(II) complexes undergo light-induced spin crossover dynamics between the LS ground state and a HS quintet excited state, and these processes have been studied extensively over the years.44–50 For example, strong photoabsorption bands of the Fe(II) tris bipyridine complex in the visible to UV range are due to metal-to-ligand charge transfer (MLCT) bands. These 1,3MLCT states have similar metal-ligand bond lengths with those in the ground electronic state, while the 1T1,2, 3T1,2, and 5T2 electronic states with an occupied anti-bonding LUMO (eg) have larger metal-ligand distances by ca. 0.2 Å. Consequently, the MLCT potential energy surfaces undergo crossings with those of the 1T1,2, 3T1,2, and 5T2 electronic states. TRXAS spectroscopy by Bressler et al. revealed a red-shift of the Fe K-edge within 150 fs after photoexcitation, which was interpreted as a signature of the formation of the 5T2 state.47 The X-ray absorption spectrum observed after 500 fs remained essentially unchanged even after 100 ps. Although there is a surface crossing between the MLCT and 5T2 states, the lowest order spin-orbit interaction term does not couple these two states directly. Therefore, if the intersystem crossing to 5T2 is mediated by 3T1,2, they must be created within the first 150 fs. Recently, Zhang et al. claimed to have observed the transient 3T state using time-resolved Kβ fluorescence spectroscopy.46
Our experimental data on the ultrafast dynamics of [Fe(III)(C2O4)3]3− complex are phenomenologically similar to those of the Fe(II) tris bipyridine complex in that the red-shift of the K-edge occurs within ca. 140 fs, and spectral change essentially ceases after 3 ps. However, the photo-induced dynamics of [Fe(III)(C2O4)3]3− are different from the spin crossover dynamics of Fe(II) complexes. Most distinctively, the ground state of [Fe(III)(C2O4)3]3− is the HS state and its photochemistry is known as a reduction reaction in which a ligand is released, leading to an overall reduction reaction quantum yield that exceeds unity.
Our experimental results are summarized as follows. The 268 nm photoexcitation of [Fe(III)(C2O4)3]3− induces an ultrafast red-shift of the Fe K-edge that occurs within 140 fs and has a magnitude of greater than 3 eV. The magnitude of the red-shift diminishes within 3 ps, although the K-edge remains red-shifted by more than 3 eV from the K-edge of the parent. The spectrum subsequently remains unchanged up to 100 ps, the longest delay time we have examined. The photoabsorption spectrum extracted for the product at 7 ps exhibits diminished EXAFS oscillation amplitude, suggesting that it has a smaller number of ligands. These features are consistent with ultrafast formation of [Fe(II)(C2O4)2]2− due to the photodissociation of Fe-O bonds. Although a red-shift of the K-edge is also anticipated for the LS states of [Fe(III)(C2O4)3]3−, because it is expected to be small in magnitude and the oscillatory spectral features would not diminish as much as in the case of [Fe(II)(C2O4)2]2−, they are less likely to be products.
We have identified the product of the studied reaction to be in the Fe(II) oxidation state, which is a different conclusion than that reached by Chen et al.28 The discrepancy originates from the experimental data; we observed a red-shift of the Fe K-edge upon 268 nm photoexcitation, while they reported a blue-shift for 267 nm photoexcitation, although the reason for this significant difference is unclear. However, it is notable that in a separate study they have observed a red-shift of the Fe K-edge upon 400 nm photoexcitation of [Fe(III)(C2O4)3]3−, and the X-ray absorption spectrum of the parent molecule varied between their papers. In the pioneering experiments by Chen et al., the energy resolution of the experiment was 20 eV, which did not enable them to measure the K-edge shift accurately, and measurement of the transient X-ray absorption spectrum took more than 25 h.25 It is likely that the limited signal-to-noise ratio, in addition to interference from the L1 line of tungsten, has limited the accuracy of their measurements.
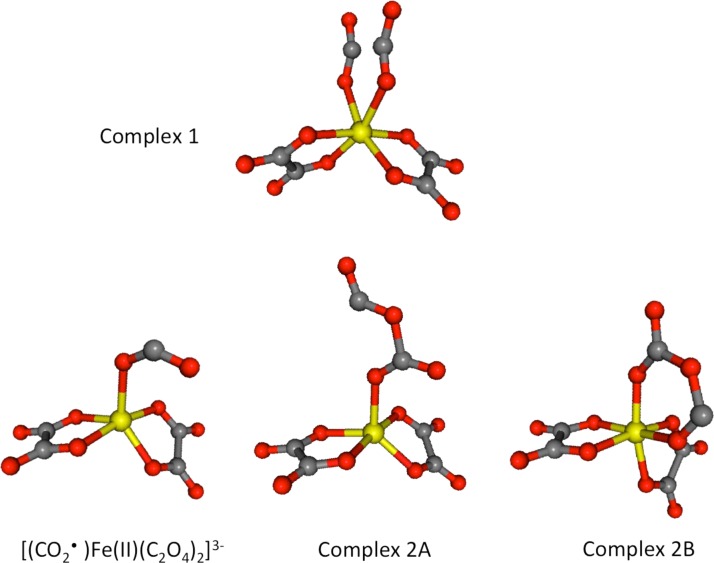
We now consider in more detail the dissociation mechanism of the metal-ligand bonds. For releasing one ligand from the complex, two Fe-O bonds must be dissociated either sequentially or simultaneously. Should the observed transient species be assigned to a four-coordinated or five-coordinated radical complex? To examine the dissociation mechanism, we performed TD-DFT optimization for the excited electronic state. The geometry optimization carried out on the LMCT state indicates that the C–C bond of the ligand weakens after the LMCT process; the C–C bond subsequently dissociates and the Fe(II)-O bond is elongated to arrive at surface crossing between the excited and the ground electronic states (complex 1 in Figure 10). If one Fe(II)-O bond is dissociated in addition to the C–C bond, neutral CO2 leaves the complex to form [(CO2•)Fe(II)(C2O4)2]3−. Otherwise, the ligand rearranges to form either [(C2O4•)Fe(II) (C2O4)2]3−, denoted as complex 2A, or complex 2B presented in Figure 10, which are energetically higher than the electronic ground state of the parent by 2.5 eV and 2.0 eV, respectively. Formation of these complexes requires rather complicated molecular rearrangement, which may not be completed within 140 fs. Furthermore, the K-edge shifts calculated for complexes 2A and 2B are −5.4 and +0.2 eV, respectively, allowing complex 2B to be rejected as a candidate due to its blue-shift of the K-edge. Thus, CO2 loss to form [(CO2•)Fe(II)(C2O4)2]3− is more feasible dynamically, and the expected K-edge shift of −5.7 eV agrees well with the observed K-edge shift within 3 ps. In the radical complex of [(CO2•)Fe(II)(C2O4)2]3−, the carbon dioxide radical anion CO2•− is bound to the Fe atom by less than 0.5 eV. Therefore, it is plausible that a vibrationally hot complex loses CO2− to create [Fe(II)(C2O4)2]2−. Thus, we propose a new reaction scenario in which photoexcitation of the LMCT band creates [Fe(II)(C2O4)3]3−*, which rapidly loses CO2 and CO2− sequentially to produce [Fe(II)(C2O4)2]2−. However, if the [(CO2•)Fe(II)(C2O4)2]3− complex is vibrationally cooled prior to the second dissociation, the complex will have a lifetime and cannot be distinguished spectroscopically from [Fe(II)(C2O4)2]2− due to similarities in their K-edge shifts and Fe(II)-O bond lengths.
FIG. 10.
Structures of possible transient geometries of [Fe(III)(C2O4)3]3− after 268 nm photoexcitation. Complex 1 represents an unstable geometry of [Fe(III)(C2O4)3]3− with an elongated C-C distance of the oxalate ligand, while complexes 2A and 2B are the isomerized forms. [(CO2•)Fe(II)(C2O4)2]3− is created when complex 1 loses a neutral CO2 molecule from the oxalate ligand. Further details are contained in the text.
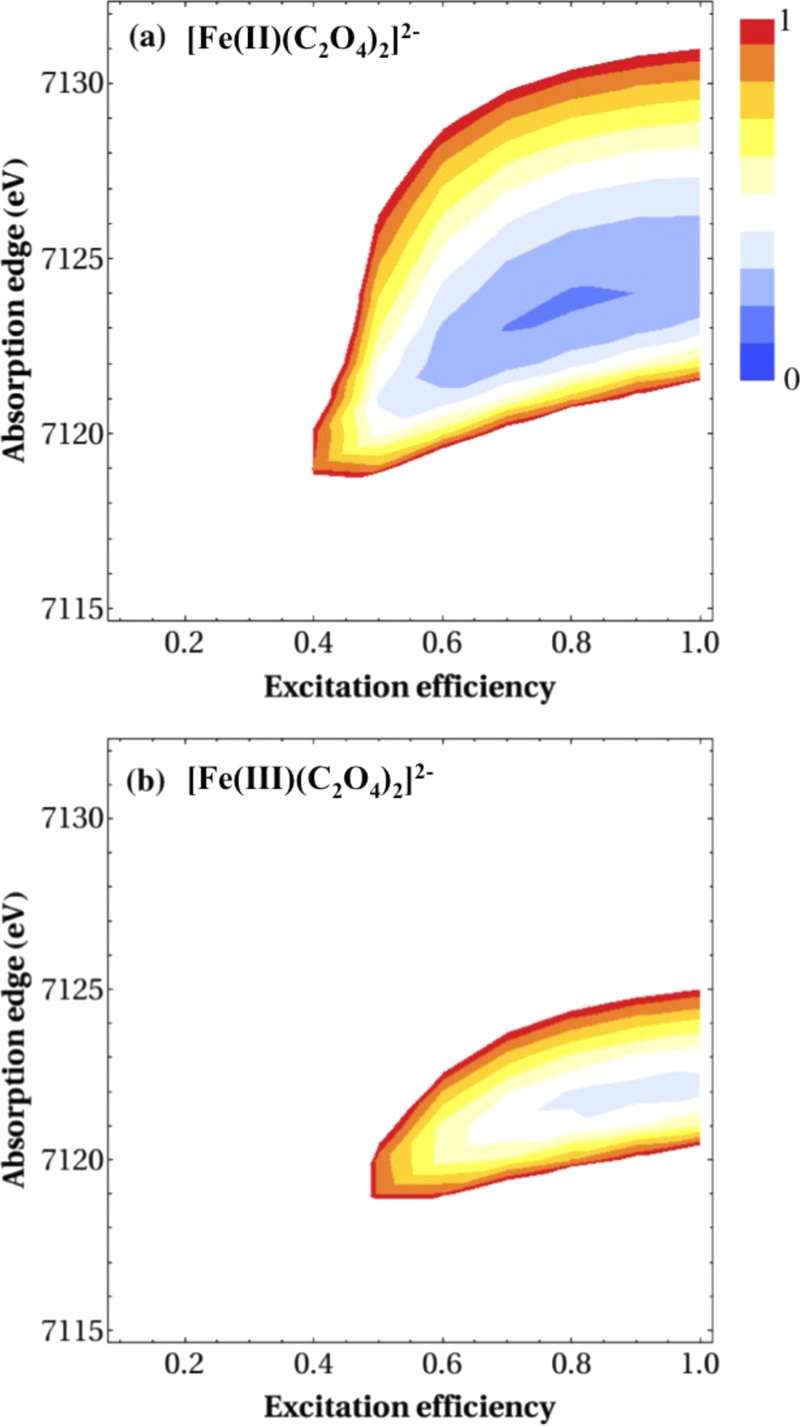
In our analysis of the X-ray absorption spectra described in an earlier section, we estimated the excitation efficiency as f = 0.5 and reconstructed the spectrum corresponding to transient species. Estimating the excitation efficiency is the most difficult part of the analysis, and our estimation possibly contains an error. Therefore, to examine the influence of such an error, we have performed non-linear least squares fitting of the spectrum observed at 7 ps (shown in Figure 4) with the excitation efficiency and the red-shift of the product spectrum as running parameters. For this purpose, we employed the experimental X-ray absorption spectrum of the parent and a simulated spectrum of the product, either [Fe(II)(C2O4)2]2− or [Fe(III)(C2O4)2]−, which was calculated using the FEFF6 program43 and the molecular geometry predicted by TDDFT. The results, presented as two-dimensional maps of the residues of the least squares fits, are shown in Figures 11(a) and 11(b) for [Fe(II)(C2O4)2]2− and [Fe(III)(C2O4)2]−, respectively. The residue is smaller for [Fe(II)(C2O4)2]2− than [Fe(III)(C2O4)2]−, and the parameter space providing a reasonable fit is much narrower for [Fe(III)(C2O4)2]−. To generate a reasonable fit, a red-shift must be assumed for the Fe K-edge in both cases, i.e., the experimental result cannot be reproduced by assuming a blue-shift of the K-edge for a photoproduct. Thus, the observed red-shift of the K-edge is the most crucial evidence to reject [Fe(III)(C2O4)2]− as a potential photoproduct. Furthermore, even if we neglect the problem of K-edge shift, [Fe(II)(C2O4)2]2− fits better to the observed spectrum, because the oscillatory feature is better explained by the Fe-O bond length of 0.204 nm. In general, when the K-edge energy is uncertain, measurements performed for a narrow energy window do not enable unambiguous determination of the bond length and assignment of the chemical species. It is plausible that the actual f value is greater than 0.5 in our experiment.
FIG. 11.
Residual sum of squares as a function of absorption edge energy and excitation efficiency using the same model described in Fig. 8. The geometries are calculated by TDDFT for (a) [Fe(II)(C2O4)2]2− and (b) [Fe(III)(C2O4)2]−. The Fe-O bond lengths in [Fe(II)(C2O4)2]2− and [Fe(III)(C2O4)2]− are 2.04 and 1.94 Å, respectively. The two figures were plotted using a common intensity scale and color map. The global minimum is located in the blue-colored region in (a) and the red-colored regions correspond to five times greater residual sums.
It is interesting to examine whether the observed spectrum is also consistent with [(CO2•)Fe(II)(C2O4)2]3−. Our least squares fit, similar to Figure 11(b), indicates that the quality of the fit assuming [(CO2•)Fe(II)(C2O4)2]3− is between those of [Fe(II)(C2O4)2]2− and [Fe(III)(C2O4)2]−. Therefore, [(CO2•)Fe(II)(C2O4)2]3− cannot be excluded from being the long-lived component observed in this study.
VI. CONCLUSION
We have performed time-resolved X-ray absorption spectroscopy of aqueous [Fe(III)(C2O4)2]3− solutions using a hard X-ray free electron laser and a total X-ray fluorescence yield method. [Fe(III)(C2O4)2]3− was photoexcited using a femtosecond 268 nm pulse, and transient X-ray absorption spectra were recorded at various pump-probe delay times with a time-resolution of 200 fs and spectral resolution of 1.3 eV. Upon 268 nm photoexcitation, the Fe K-edge exhibited a red-shift within 140 fs followed by a slight blue-shift within 3 ps. The spectral features subsequently remained unchanged for 100 ps, the longest pump-probe delay measured. Based on the experimental results and density functional theory calculations, we propose a new reaction mechanism in which photoexcitation of the LMCT band creates [Fe(II)(C2O4)3]3−*, which first loses CO2 within 140 fs and then CO2− within 3 ps to produce [Fe(II)(C2O4)2]2−. However, if the photoexcited complex is rapidly vibrationally cooled in the form of [(CO2•)Fe(II)(C2O4)2]3−, it may not dissociate CO2− immediately. Since this species cannot be distinguished from [Fe(II)(C2O4)2]2− owing to similarities in their K-edge shifts and Fe(II)-O bond lengths, the observed spectrum of long-lived components may contain some contribution from this radical complex. For the discrimination of these two possible transient species and confirmation of our proposed mechanism, dynamical simulations and the accurate determination of Fe(II)-O bond lengths achievable by extending measurements to the EXAFS region will be useful.
ACKNOWLEDGMENTS
We thank the operation and engineering staff of SACLA for their support in carrying out the experiment. The experiments were performed at BL3 of SACLA with the approval of the Japan Synchrotron Radiation Research Institute (JASRI) (Proposal No. 2013B8068). This work was supported by the “X-ray Free Electron Laser Priority Strategy Program” of the Ministry of Education, Culture, Sports, Science, and Technology of Japan (MEXT). P.S. thanks the Grant Agency of the Czech Republic (13-34168S).
References
- 1. Bressler C. and Chergui M., “ Ultrafast X-ray absorption spectroscopy,” Chem. Rev. 104, 1781–1812 (2004). 10.1021/cr0206667 [DOI] [PubMed] [Google Scholar]
- 2. Chen L. X., “ Probing transient molecular structures in photochemical processes using laser-initiated time-resolved X-ray absorption spectroscopy,” Annu. Rev. Phys. Chem. 56, 221–254 (2005). 10.1146/annurev.physchem.56.092503.141310 [DOI] [PubMed] [Google Scholar]
- 3. Penfold T. J., Milne C. J., and Chergui M., in Advances in Chemical Physics, edited by Rice S. A. and Dinner A. R. ( John Wiley ans Sons, 2013), Vol. 153, p. 1. [Google Scholar]
- 4. Ahr B., Chollet M., Adams B., Lunny E. M., Laperle C. M., and Rose-Petruck C., “ Picosecond X-ray absorption measurements of the ligand substitution dynamics of Fe(CO)(5) in ethanol,” Phys. Chem. Chem. Phys. 13, 5590–5599 (2011). 10.1039/c0cp01856b [DOI] [PubMed] [Google Scholar]
- 5. Van Kuiken B. E. and Khalil M., “ Simulating picosecond iron K-edge X-ray absorption spectra by ab initio methods to study photoinduced changes in the electronic structure of Fe(II) spin crossover complexes,” J. Phys. Chem. A 115, 10749–10761 (2011). 10.1021/jp2056333 [DOI] [PubMed] [Google Scholar]
- 6. Smolentsev G., Guda A., Zhang X. Y., Haldrup K., Andreiadis E. S., Chayarot-Kerlidou M., Canton S. E., Nachtegaal M., Artero V., and Sundstrom V., “ Pump-flow-probe X-ray absorption spectroscopy as a tool for studying intermediate states of photocatalytic systems,” J. Phys. Chem. C 117, 17367–17375 (2013). 10.1021/jp4010554 [DOI] [PMC free article] [PubMed] [Google Scholar]
- 7. Schoenlein R. W., Chattopadhyay S., Chong H. H. W., Glover T. E., Heimann P. A., Shank C. V., Zholents A. A., and Zolotorev M. S., “ Generation of femtosecond pulses of synchrotron radiation,” Science 287, 2237–2240 (2000). 10.1126/science.287.5461.2237 [DOI] [PubMed] [Google Scholar]
- 8. Khan S., Holldack K., Kachel T., Mitzner R., and Quast T., “ Femtosecond undulator radiation from sliced electron bunches,” Phys. Rev. Lett. 97, 074801 (2006). 10.1103/PhysRevLett.97.074801 [DOI] [PubMed] [Google Scholar]
- 9. Beaud P., Johnson S. L., Streun A., Abela R., Abramsohn D., Grolimund D., Krasniqi F., Schmidt T., Schlott V., and Ingold G., “ Spatiotemporal stability of a femtosecond hard-X-ray undulator source studied by control of coherent optical phonons,” Phys. Rev. Lett. 99, 174801 (2007). 10.1103/PhysRevLett.99.174801 [DOI] [PubMed] [Google Scholar]
- 10. Huse N., Cho H., Hong K., Jamula L., de Groot F. M. F., Kim T. K., McCusker J. K., and Schoenlein R. W., “ Femtosecond soft X-ray spectroscopy of solvated transition-metal complexes: Deciphering the interplay of electronic and structural dynamics,” J. Phys. Chem. Lett. 2, 880–884 (2011). 10.1021/jz200168m [DOI] [PubMed] [Google Scholar]
- 11. Raksi F., Wilson K. R., Jiang Z. M., Ikhlef A., Cote C. Y., and Kieffer J. C., “ Ultrafast x-ray absorption probing of a chemical reaction,” J. Chem. Phys. 104, 6066–6069 (1996). 10.1063/1.471305 [DOI] [Google Scholar]
- 12. Tomov I. V. and Rentzepis P. M., “ Ultrafast X-ray determination of transient structures in solids and liquids,” Chem. Phys. 299, 203–213 (2004). 10.1016/j.chemphys.2003.10.044 [DOI] [PubMed] [Google Scholar]
- 13. Emma P., Akre R., Arthur J., Bionta R., Bostedt C., Bozek J., Brachmann A., Bucksbaum P., Coffee R., Decker F. J., Ding Y., Dowell D., Edstrom S., Fisher A., Frisch J., Gilevich S., Hastings J., Hays G., Hering P., Huang Z., Iverson R., Loos H., Messerschmidt M., Miahnahri A., Moeller S., Nuhn H. D., Pile G., Ratner D., Rzepiela J., Schultz D., Smith T., Stefan P., Tompkins H., Turner J., Welch J., White W., Wu J., Yocky G., and Galayda J., “ First lasing and operation of an angstrom-wavelength free-electron laser,” Nat. Photonics 4, 641–647 (2010). 10.1038/nphoton.2010.176 [DOI] [Google Scholar]
- 14. Ishikawa T., Aoyagi H., Asaka T., Asano Y., Azumi N., Bizen T., Ego H., Fukami K., Fukui T., Furukawa Y., Goto S., Hanaki H., Hara T., Hasegawa T., Hatsui T., Higashiya A., Hirono T., Hosoda N., Ishii M., Inagaki T., Inubushi Y., Itoga T., Joti Y., Kago M., Kameshima T., Kimura H., Kirihara Y., Kiyomichi A., Kobayashi T., Kondo C., Kudo T., Maesaka H., Marechal X. M., Masuda T., Matsubara S., Matsumoto T., Matsushita T., Matsui S., Nagasono M., Nariyama N., Ohashi H., Ohata T., Ohshima T., Ono S., Otake Y., Saji C., Sakurai T., Sato T., Sawada K., Seike T., Shirasawa K., Sugimoto T., Suzuki S., Takahashi S., Takebe H., Takeshita K., Tamasaku K., Tanaka H., Tanaka R., Tanaka T., Togashi T., Togawa K., Tokuhisa A., Tomizawa H., Tono K., Wu S. K., Yabashi M., Yamaga M., Yamashita A., Yanagida K., Zhang C., Shintake T., Kitamura H., and Kumagai N., “ A compact X-ray free-electron laser emitting in the sub-angstrom region,” Nat. Photonics 6, 540–544 (2012). 10.1038/nphoton.2012.141 [DOI] [Google Scholar]
- 15. Ackermann W., Asova G., Ayvazyan V., Azima A., Baboi N., Bahr J., Balandin V., Beutner B., Brandt A., Bolzmann A., Brinkmann R., Brovko O. I., Castellano M., Castro P., Catani L., Chiadroni E., Choroba S., Cianchi A., Costello J. T., Cubaynes D., Dardis J., Decking W., Delsim-Hashemi H., Delserieys A., Di Pirro G., Dohlus M., Dusterer S., Eckhardt A., Edwards H. T., Faatz B., Feldhaus J., Flottmann K., Frisch J., Frohlich L., Garvey T., Gensch U., Gerth C., Gorler M., Golubeva N., Grabosch H. J., Grecki M., Grimm O., Hacker K., Hahn U., Han J. H., Honkavaara K., Hott T., Huning M., Ivanisenko Y., Jaeschke E., Jalmuzna W., Jezynski T., Kammering R., Katalev V., Kavanagh K., Kennedy E. T., Khodyachykh S., Klose K., Kocharyan V., Korfer M., Kollewe M., Koprek W., Korepanov S., Kostin D., Krassilnikov M., Kube G., Kuhlmann M., Lewis C. L. S., Lilje L., Limberg T., Lipka D., Lohl F., Luna H., Luong M., Martins M., Meyer M., Michelato P., Miltchev V., Moller W. D., Monaco L., Muller W. F. O., Napieralski A., Napoly O., Nicolosi P., Nolle D., Nunez T., Oppelt A., Pagani C., Paparella R., Pchalek N., Pedregosa-Gutierrez J., Petersen B., Petrosyan B., Petrosyan G., Petrosyan L., Pfluger J., Plonjes E., Poletto L., Pozniak K., Prat E., Proch D., Pucyk P., Radcliffe P., Redlin H., Rehlich K., Richter M., Roehrs M., Roensch J., Romaniuk R., Ross M., Rossbach J., Rybnikov V., Sachwitz M., Saldin E. L., Sandner W., Schlarb H., Schmidt B., Schmitz M., Schmuser P., Schneider J. R., Schneidmiller E. A., Schnepp S., Schreiber S., Seidel M., Sertore D., Shabunov A. V., Simon C., Simrock S., Sombrowski E., Sorokin A. A., Spanknebel P., Spesyvtsev R., Staykov L., Steffen B., Stephan F., Stulle F., Thom H., Tiedtke K., Tischer M., Toleikis S., Treusch R., Trines D., Tsakov I., Vogel E., Weiland T., Weise H., Wellhoffer M., Wendt M., Will I., Winter A., Wittenburg K., Wurth W., Yeates P., Yurkov M. V., Zagorodnov I., and Zapfe K., “ Operation of a free-electron laser from the extreme ultraviolet to the water window,” Nat. Photonics 1, 336–342 (2007). 10.1038/nphoton.2007.76 [DOI] [Google Scholar]
- 16. Shintake T., Tanaka H., Hara T., Tanaka T., Togawa K., Yabashi M., Otake Y., Asano Y., Bizen T., Fukui T., Goto S., Higashiya A., Hirono T., Hosoda N., Inagaki T., Inoue S., Ishii M., Kim Y., Kimura H., Kitamura M., Kobayashi T., Maesaka H., Masuda T., Matsui S., Matsushita T., Marechal X., Nagasono M., Ohashi H., Ohata T., Ohshima T., Onoe K., Shirasawa K., Takagi T., Takahashi S., Takeuchi M., Tamasaku K., Tanaka R., Tanaka Y., Tanikawa T., Togashi T., Wu S., Yamashita A., Yanagida K., Zhang C., Kitamura H., and Ishikawa T., “ A compact free-electron laser for generating coherent radiation in the extreme ultraviolet region,” Nat. Photonics 2, 555–559 (2008). 10.1038/nphoton.2008.134 [DOI] [Google Scholar]
- 17. Chen L. X. and Zhang X. Y., “ Photochemical processes revealed by X-ray transient absorption spectroscopy,” J. Phys. Chem. Lett. 4, 4000–4013 (2013). 10.1021/jz401750g [DOI] [Google Scholar]
- 18. Lemke H. T., Bressler C., Chen L. X., Fritz D. M., Gaffney K. J., Galler A., Gawelda W., Haldrup K., Hartsock R. W., Ihee H., Kim J., Kim K. H., Lee J. H., Nielsen M. M., Stickrath A. B., Zhang W. K., Zhu D. L., and Cammarata M., “ Femtosecond X-ray absorption spectroscopy at a hard X-ray free electron laser: Application to spin crossover dynamics,” J. Phys. Chem. A 117, 735–740 (2013). 10.1021/jp312559h [DOI] [PubMed] [Google Scholar]
- 19. Mitzner R., Rehanek J., Kern J., Gul S., Hattne J., Taguchi T., Alonso-Mori R., Tran R., Weniger C., Schroder H., Quevedo W., Laksmono H., Sierra R. G., Han G. Y., Lassalle-Kaiser B., Koroidov S., Kubicek K., Schreck S., Kunnus K., Brzhezinskaya M., Firsov A., Minitti M. P., Turner J. J., Moeller S., Sauter N. K., Bogan M. J., Nordlund D., Schlotter W. F., Messinger J., Borovik A., Techert S., de Groot F. M. F., Fohlisch A., Erko A., Bergmann U., Yachandra V. K., Wernet P., and Yano J., “ L-edge X-ray absorption spectroscopy of dilute systems relevant to metalloproteins using an X-ray free-electron laser,” J. Phys. Chem. Lett. 4, 3641–3647 (2013). 10.1021/jz401837f [DOI] [PMC free article] [PubMed] [Google Scholar]
- 20. Obara Y., Katayama T., Ogi Y., Suzuki T., Kurahashi N., Karashima S., Chiba Y., Isokawa Y., Togashi T., Inubushi Y., Yabashi M., Suzuki T., and Misawa K., “ Femtosecond time-resolved X-ray absorption spectroscopy of liquid using a hard X-ray free electron laser in a dual-beam dispersive detection method,” Opt. Express 22, 1105–1113 (2014). 10.1364/OE.22.001105 [DOI] [PubMed] [Google Scholar]
- 21. Katayama T., Inubushi Y., Obara Y., Sato T., Togashi T., Tono K., Hatsui T., Kameshima T., Bhattacharya A., Ogi Y., Kurahashi N., Misawa K., Suzuki T., and Yabashi M., “ Femtosecond x-ray absorption spectroscopy with hard x-ray free electron laser,” Appl. Phys. Lett. 103, 131105 (2013). 10.1063/1.4821108 [DOI] [Google Scholar]
- 22. Deguillaume L., Leriche M., Desboeufs K., Mailhot G., George C., and Chaumerliac N., “ Transition metals in atmospheric liquid phases: Sources, reactivity, and sensitive parameters,” Chem. Rev. 105, 3388–3431 (2005). 10.1021/cr040649c [DOI] [PubMed] [Google Scholar]
- 23. Hatchard C. G. and Parker C. A., “ A new sensitive chemical actinometer. II. Potassium ferrioxalate as a standard chemical actinometer,” Proc. R. Soc. London, Ser. A 235, 518–536 (1956). 10.1098/rspa.1956.0102 [DOI] [Google Scholar]
- 24. Parker C. A., “ A new sensitive chemical actinometer. 1. Some trials with potassium ferrioxalate,” Proc. R. Soc. London, Ser. A 220, 104–116 (1953). 10.1098/rspa.1953.0175 [DOI] [Google Scholar]
- 25. Goldstein S. and Rabani J., “ The ferrioxalate and iodide-iodate actinometers in the UV region,” J. Photochem. Photobiol., A 193, 50–55 (2008). 10.1016/j.jphotochem.2007.06.006 [DOI] [Google Scholar]
- 26. Weller C., Horn S., and Herrmann H., “ Effects of Fe(III)-concentration, speciation, excitation-wavelength and light intensity on the quantum yield of iron(III)-oxalato complex photolysis,” J. Photochem. Photobiol., A 255, 41–49 (2013). 10.1016/j.jphotochem.2013.01.014 [DOI] [Google Scholar]
- 27. Chen J., Zhang H., Tomov I. V., Wolfsherg M., Ding X. L., and Rentzepis P. M., “ Transient structures and kinetics of the ferrioxalate redox reaction studied by time-resolved EXAFS, optical spectroscopy, and DFT,” J. Phys. Chem. A 111, 9326–9335 (2007). 10.1021/jp0733466 [DOI] [PubMed] [Google Scholar]
- 28. Chen J., Zhang H., Tomov I. V., and Rentzepis P. M., “ Electron transfer mechanism and photochemistry of ferrioxalate induced by excitation in the charge transfer band,” Inorg. Chem. 47, 2024–2032 (2008). 10.1021/ic7016566 [DOI] [PubMed] [Google Scholar]
- 29. Pozdnyakov I. P., Kel O. V., Plyusnin V. F., Grivin V. P., and Bazhin N. M., “ New insight into photochemistry of ferrioxalate,” J. Phys. Chem. A 112, 8316–8322 (2008). 10.1021/jp8040583 [DOI] [PubMed] [Google Scholar]
- 30. Pozdnyakov I. P., Kel O. V., Plyusnin V. F., Grivin V. P., and Bazhin N. M., “ Reply to “Comment on 'New insight into photochemistry of ferrioxalate'”,” J. Phys. Chem. A 113, 8820–8822 (2009). 10.1021/jp810301g [DOI] [PubMed] [Google Scholar]
- 31. Chen J., Dvornikov A. S., and Rentzepis P. M., “ Comment on “New insight into photochemistry of ferrioxalate”,” J. Phys. Chem. A 113, 8818–8819 (2009). 10.1021/jp809535q [DOI] [PubMed] [Google Scholar]
- 32. Yumoto H., Mimura H., Koyama T., Matsuyama S., Tono K., Togashi T., Inubushi Y., Sato T., Tanaka T., Kimura T., Yokoyama H., Kim J., Sano Y., Hachisu Y., Yabashi M., Ohashi H., Ohmori H., Ishikawa T., and Yamauchi K., “ Focusing of X-ray free-electron laser pulses with reflective optics,” Nat. Photonics 7, 43–47 (2013). 10.1038/nphoton.2012.306 [DOI] [Google Scholar]
- 33. Kameshima T., Ono S., Kudo T., Ozaki K., Kirihara Y., Kobayashi K., Inubushi Y., Yabashi M., Horigome T., Holland A., Holland K., Burt D., Murao H., and Hatsui T., “ Development of an X-ray pixel detector with multi-port charge-coupled device for X-ray free-electron laser experiments,” Rev. Sci. Instrum. 85, 033110 (2014). 10.1063/1.4867668 [DOI] [PubMed] [Google Scholar]
- 34. Lima F. A., Bjornsson R., Weyhermuller T., Chandrasekaran P., Glatzel P., Neese F., and DeBeer S., “ High-resolution molybdenum K-edge X-ray absorption spectroscopy analyzed with time-dependent density functional theory,” Phys. Chem. Chem. Phys. 15, 20911–20920 (2013). 10.1039/c3cp53133c [DOI] [PubMed] [Google Scholar]
- 35. Dolg M., Wedig U., Stoll H., and Preuss H., “ Energy-adjusted abinitio pseudopotentials for the 1st-row transition-elements,” J. Chem. Phys. 86, 866–872 (1987). 10.1063/1.452288 [DOI] [Google Scholar]
- 36. Scalmani G. and Frisch M. J., “ Continuous surface charge polarizable continuum models of solvation. I. General formalism,” J. Chem. Phys. 132, 114110 (2010). 10.1063/1.3359469 [DOI] [PubMed] [Google Scholar]
- 37. Tomasi J., Mennucci B., and Cammi R., “ Quantum mechanical continuum solvation models,” Chem. Rev. 105, 2999–3093 (2005). 10.1021/cr9904009 [DOI] [PubMed] [Google Scholar]
- 38. Boese A. D. and Martin J. M. L., “ Development of density functionals for thermochemical kinetics,” J. Chem. Phys. 121, 3405–3416 (2004). 10.1063/1.1774975 [DOI] [PubMed] [Google Scholar]
- 39. Grimme S., in Reviews in Computational Chemistry, edited by Lipkowitz K. B., Larter R., Cundari T. R., and Boyd D. B. ( John Wiley and Sons, New York, 2004), Vol. 20, pp. 153–218. [Google Scholar]
- 40. Martin R. L., “ Natural transition orbitals,” J. Chem. Phys. 118, 4775–4777 (2003). 10.1063/1.1558471 [DOI] [Google Scholar]
- 41. Frisch M. J., Trucks G. W., Schlegel H. B., Scuseria G. E., Robb M. A., Cheeseman J. R., Scalmani G., Barone V., Mennucci B. et al. , ( Gaussian, Inc., Wallingford, CT, 2009). [Google Scholar]
- 42. Neese F., “ The ORCA program system,” Wiley Interdiscip. Rev.: Comput. Mol. Sci. 2, 73–78 (2012). 10.1002/wcms.81 [DOI] [Google Scholar]
- 43. Rehr J. J., Mustre de Leon J., Zabinsky S. I., and Albers R. C., “ Theoretical x-ray absorption fine structure standards,” J. Am. Chem. Soc. 113, 5135–5140 (1991). 10.1021/ja00014a001 [DOI] [Google Scholar]
- 44. Gutlich P., Garcia Y., and Goodwin H. A., “ Spin crossover phenomena in Fe(II) complexes,” Chem. Soc. Rev. 29, 419–427 (2000). 10.1039/b003504l [DOI] [Google Scholar]
- 45. Cannizzo A., Milne C. J., Consani C., Gawelda W., Bressler C., van Mourik F., and Chergui M., “ Light-induced spin crossover in Fe(II)-based complexes: The full photocycle unraveled by ultrafast optical and X-ray spectroscopies,” Coord. Chem. Rev. 254, 2677–2686 (2010). 10.1016/j.ccr.2009.12.007 [DOI] [Google Scholar]
- 46. Zhang W. K., Alonso-Mori R., Bergmann U., Bressler C., Chollet M., Galler A., Gawelda W., Hadt R. G., Hartsock R. W., Kroll T., Kjaer K. S., Kubicek K., Lemke H. T., Liang H. Y. W., Meyer D. A., Nielsen M. M., Purser C., Robinson J. S., Solomon E. I., Sun Z., Sokaras D., van Driel T. B., Vanko G., Weng T. C., Zhu D. L., and Gaffney K. J., “ Tracking excited-state charge and spin dynamics in iron coordination complexes,” Nature 509, 345–348 (2014). 10.1038/nature13252 [DOI] [PMC free article] [PubMed] [Google Scholar]
- 47. Bressler C., Milne C., Pham V. T., ElNahhas A., van der Veen R. M., Gawelda W., Johnson S., Beaud P., Grolimund D., Kaiser M., Borca C. N., Ingold G., Abela R., and Chergui M., “ Femtosecond XANES study of the light-induced spin crossover dynamics in an iron(II) complex,” Science 323, 489–492 (2009). 10.1126/science.1165733 [DOI] [PubMed] [Google Scholar]
- 48. Nozawa S., Sato T., Chollet M., Ichiyanagi K., Tomita A., Fujii H., Adachi S., and Koshihara S., “ Direct probing of spin state dynamics coupled with electronic and structural modifications by picosecond time-resolved XAFS,” J. Am. Chem. Soc. 132, 61–63 (2010). 10.1021/ja907460b [DOI] [PubMed] [Google Scholar]
- 49. Khalil M., Marcus M. A., Smeigh A. L., McCusker J. K., Chong H. H. W., and Schoenlein R. W., “ Picosecond X-ray absorption spectroscopy of a photoinduced iron(II) spin crossover reaction in solution,” J. Phys. Chem. A 110, 38–44 (2006). 10.1021/jp055002q [DOI] [PubMed] [Google Scholar]
- 50. Huse N., Kim T. K., Jamula L., McCusker J. K., de Groot F. M. F., and Schoenlein R. W., J. Am. Chem. Soc. 132, 6809–6816 (2010). 10.1021/ja101381a [DOI] [PubMed] [Google Scholar]


