Significance
In recent years, there has been a flurry of restoration projects aimed at mitigating the impact of coastal storms using salt marshes and vegetated surfaces (called “living shorelines”). Based on a large dataset of salt marsh erosion and wave measurements collected all around the world, we find that erosion rates of marsh boundaries and incident wave energy collapse into a unique linear relationship. Our result clearly shows that long-term salt marsh deterioration is dictated by average wave conditions, and it is, therefore, predictable. Violent storms and hurricanes contribute less than 1% to long-term salt marsh erosion rates. This result is of high value for coastal restoration projects and the use of living shorelines to mitigate storms effect.
Keywords: salt marsh, resilience, hurricanes, wind waves, erosion
Abstract
Salt marsh losses have been documented worldwide because of land use change, wave erosion, and sea-level rise. It is still unclear how resistant salt marshes are to extreme storms and whether they can survive multiple events without collapsing. Based on a large dataset of salt marsh lateral erosion rates collected around the world, here, we determine the general response of salt marsh boundaries to wave action under normal and extreme weather conditions. As wave energy increases, salt marsh response to wind waves remains linear, and there is not a critical threshold in wave energy above which salt marsh erosion drastically accelerates. We apply our general formulation for salt marsh erosion to historical wave climates at eight salt marsh locations affected by hurricanes in the United States. Based on the analysis of two decades of data, we find that violent storms and hurricanes contribute less than 1% to long-term salt marsh erosion rates. In contrast, moderate storms with a return period of 2.5 mo are those causing the most salt marsh deterioration. Therefore, salt marshes seem more susceptible to variations in mean wave energy rather than changes in the extremes. The intrinsic resistance of salt marshes to violent storms and their predictable erosion rates during moderate events should be taken into account by coastal managers in restoration projects and risk management plans.
The potential of salt marshes to serve as natural buffers against violent storms seems even more important in view of significant threats imposed by climate change, such as increased storminess and higher hurricane activity registered in the past decades (1–12). Recent research results show that salt marshes reduce wave energy during storms and possibly, mitigate storm surges (13–15). These results triggered a flurry of planned coastal restorations centered on the concept of “living shorelines” (14), which use vegetated surfaces to reduce the impact of hurricanes (13–16). However, little is known about the endurance of salt marshes against wave action and whether such ecosystems can survive extreme events.
Most marsh erosion occurs at its seaward boundary, where the effect of waves is concentrated (2, 3). Wave erosion constitutes one of the main contributions to salt marsh deterioration, and even very small waves can cause failure of large salt marsh blocks (2, 7, 17). Despite the complexity of the problem, some studies have identified a correlation between wave energy and lateral rates of marsh erosion (18, 19). Erosion of marsh edges by wave action is caused by many different mechanisms, such as the indentation of V-shaped notches into linear stretches of shoreline or cliff undercutting when lower sediment layers are eroded more rapidly than the overhanging root mats (2, 17, 19). Varying resistance to wave erosion can be caused by biotic and abiotic factors, such as geotechnical characteristics of the sediments (7, 20), vegetation characteristics (21), height of the marsh scarp, and presence of mussels or crab burrowing (22).
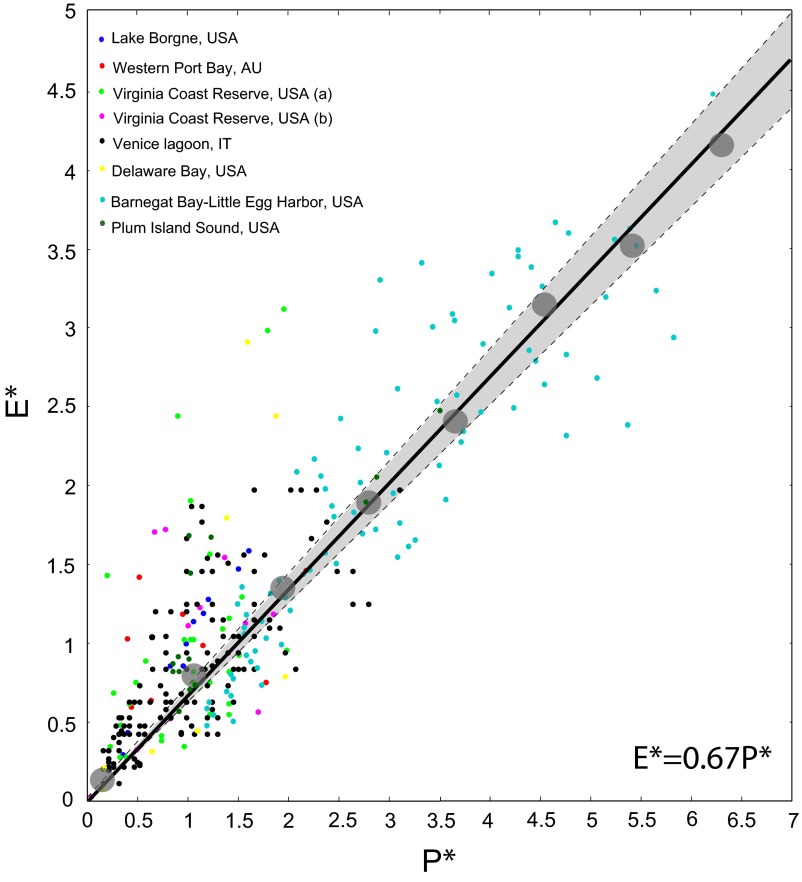
However, existing studies have mainly focused on individual marsh locations and do not provide a universal relationship applicable to multiple ecologically diverse systems. Herein, we combine wave energy and marsh erosion data from eight different locations in the United States, Australia, and Italy (18, 19, 23–26). We show that the data collapse into a unique linear relationship (Fig. 1):
| [1] |
where and are the dimensionless erosion rate and dimensionless wave power obtained by dividing field measurements of erosion rate E and wave power P by the averaged conditions at each site (Eavg and Pavg). Nondimensionalization allows for filtering out of the diverse resistance of marsh boundary at individual locations. Field measurements display a linear behavior (R2 = 0.62; p < 0.05), as shown by their average over subintervals (gray dots in Fig. 1). Some of the data also account for the occurrence of major storms. As an example, data for Barnegat Bay, New Jersey and Plum Island Sound, Massachusetts account for the passage of Hurricane Sandy, ranked as a 1/900-y event (27) (SI Appendix, Fig. S1 shows detailed salt marsh erosion measurements immediately before and immediately after Hurricane Sandy).
Fig. 1.
Relationship between dimensionless wave power () and dimensionless erosion rate () in salt marshes (R2 = 0.6; p < 0.05). Gray circles indicate values obtained by averaging data points over regular intervals to emphasize the overall linear trend. The gray area is the uncertainty of the prediction of over a range of coefficients with 95% bounds, which are equal to 0.64 and 0.7. The nondimensionalization has been carried out assuming that, if a linear relationship is valid for individual data points, then a linear relationship is valid for the averages as well, such that and . A general relationship, valid for all sites, is then obtained and reads , where , , and .
Two important observations are behind the linear nature of the relationship. The first observation is that salt marsh erosion continuously occurs, even under low wave energy conditions, suggesting the absence of a critical threshold in wave energy below which no erosion is expected. This result underlines the importance of relatively low wave energy conditions for salt marsh lateral retreat. The second observation is that, as wave energy increases, salt marshes do not respond with a catastrophic collapse (e.g., absence of exponential growth in erosion rates), highlighting the intrinsic endurance of salt marshes against extreme events. Scatter in the data arises from several sources of uncertainties, such as different methods used for the calculation of wave power and the estimation of erosion rates.
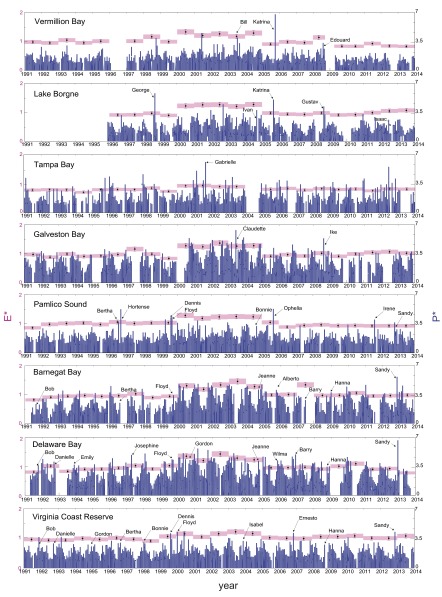
We use this general relationship to investigate long-term salt marsh behavior under realistic wave energy conditions. For this purpose, we collect meteorological data for a 23-y period (from 1991 to 2014) at eight different salt marsh locations in the United States and compute the corresponding wave energy time series (Methods, Fig. 2, and SI Appendix, Figs. S2 and S3). The areas taken into account were chosen to maximize the occurrence of major hurricanes (SI Appendix, Fig. S4). We use wave energy and Eq. 1 to estimate yearly salt marsh erosion rates (Fig. 2). The erosion rate maintains a similar value in different years and at different locations. Moreover, the years characterized by the occurrence of extreme events, such as hurricanes or tropical depressions, do not necessarily correspond to peaks in erosion rate.
Fig. 2.
Dimensionless wave power (blue) and dimensionless erosion rate (pink) for each study site. Wave power values, , are daily averages. Yearly erosion rate values and bounds (pink) were obtained using the regression coefficients calculated for the linear relationship between wave power and erosion rate. Major storms affecting the areas of interest are indicated (SI Appendix, Fig. S4 and Table S1 show storm category and date).
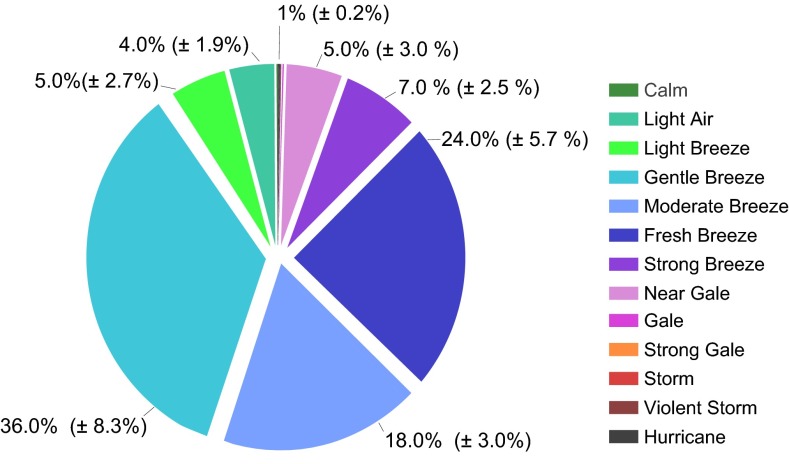
We further categorize wind data according to the Beaufort wind scale and assess the contribution of each wind category to the total erosion rate of the entire period of record (Fig. 3 and SI Appendix, Fig. S5). The highest contribution to marsh edge erosion comes from moderate but frequent weather conditions (wind speed ranging from 10 to 40 km/h), whereas violent storms and hurricanes (wind speed above 65 km/h) contribute less than 1% to the total marsh edge erosion. This result is because of the linear nature of the relationship between wave power and erosion rate and the short duration of extreme events. In fact, although the action of moderate weather conditions spans most of the study period, the erosion potential of extreme events is concentrated within a few days per year.
Fig. 3.
Average contribution of different wind categories to salt marsh erosion rates: calm, 0.1% ± 0.05%; light air, 4.0% ± 1.9%; light breeze, 5.0% ± 2.7%; gentle breeze, 36% ± 8.3%; moderate breeze, 18.0% ± 3%; fresh breeze, 24.0% ± 5.7%; strong breeze, 7.0% ± 2.5%; near gale, 5.0% ± 3%; gale, 0.2% ± 0.1%; strong gale, 0.2% ± 0.1%; storm, 0.2% ± 0.07%; violent storm, 0.2% ± 0.05%; and hurricane, 0.1% ± 0.05%. Plots refer to the entire period of record (SI Appendix, Fig. S5 shows the contribution of each wind category to a specific field site).
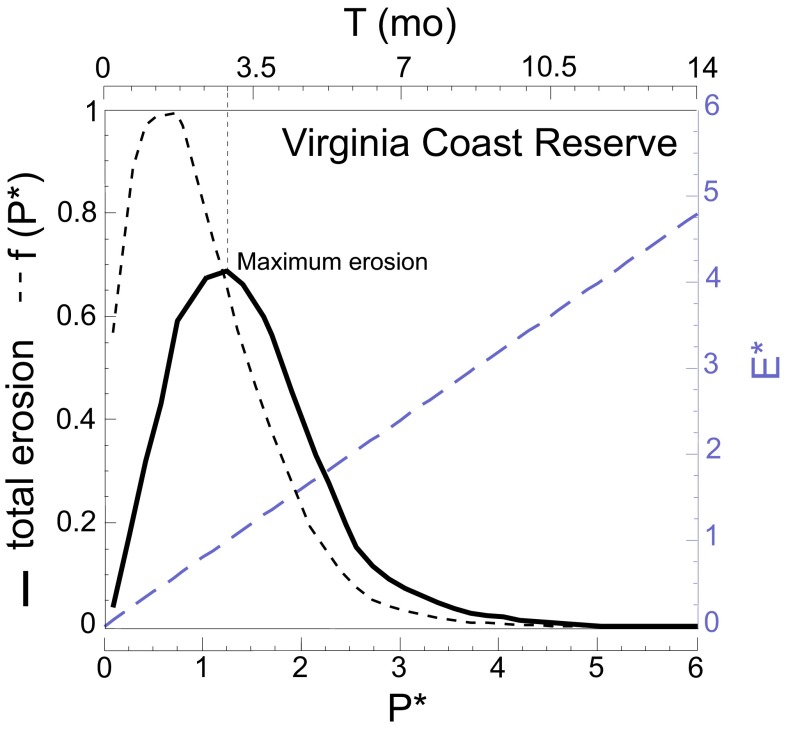
This behavior can be well-explained in terms of geomorphic work. Following a magnitude–frequency analysis (28), we can multiply the magnitude of marsh retreat for a given wind event by the event’s frequency to find the wind event that does the most geomorphic work. This product attains a maximum, indicating the frequency at which the largest portion of the work is accomplished (28). Our test cases show that the maximum erosion is attained for frequent and low-wave energy conditions, occurring with a return period of 2.5 ± 0.5 mo (Fig. 4 and SI Appendix, Fig. S6). Our results suggest that events occurring with a monthly frequency, such as, for instance, winter storms associated to cold front passages in the Gulf of Mexico in the United States, lead to more marsh erosion than hurricanes occurring at a decadal timescale.
Fig. 4.
For the Virginia Coast Reserve, frequency–magnitude distribution of dimensionless wave power (dashed black line), total erosion (black line), and dimensionless erosion rate (dashed blue line) as a function of and its return period, T, in months. For the Virginia Coast Reserve, the return period of wind waves causing maximum erosion is 3 mo. The average return period for all sites is 2.5 ± 0.5 mo (SI Appendix, Fig. S6 shows the plot of geomorphic work for individual bays).
Therefore, extreme storms are not the dominant threat to salt marsh stability, such as they are to other coastal environments. As an example, beach dunes generally dissipate wave energy during mild storms, whereas they can collapse during hurricanes (29). Moreover, although the response of sandy beaches to external drivers presents multiple stable states and the effect of storms is amplified or mitigated depending on environmental conditions (29, 30), the response of salt marshes is constant across different geographic regions and for different climatic conditions. Our analysis is only valid for salt marshes and might not be applicable to brackish or freshwater intertidal vegetation, which sometimes fail during hurricanes given their weaker root system (20). The linear relationship between wave energy and erosion and the fact that salt marsh erosion rates vary little from year to year enable the prediction of the long-term fate of these environments and the estimation of their lifecycle (3). Even if salt marshes are constantly deteriorating at a slow rate, their predictable response to a wide range of storms and the possibility of forecasting both their lifespan and mitigation effects make these landforms well-suitable for ecosystem-based coastal defense.
Methods
Erosion Rates.
We have conducted an extensive survey of available literature data of marsh erosion as a function of wave power (18, 19, 23–26). We further use salt marsh erosion measurements from Plum Island Sound, Massachusetts and Barnegat Bay–Little Egg Harbor system. Erosion measurements in Plum Island Sound were collected at three different sites from 2008 to 2013 (SI Appendix, Fig. S1). At one of the sites, field measurements were also collected immediately before and immediately after the occurrence of Hurricane Sandy (note from SI Appendix, Fig. S1 that limited erosion occurred during the event). Erosion measurements in Barnegat Bay were obtained by digitalizing more than 100 km of marsh shoreline using aerial images (1930, 2007, and 2013) from the digital orthophotography of New Jersey. These datasets consist of 0.3-m GSD pixel resolution natural color (2007 and 2013) and black and white (1930) orthoimages covering the state of New Jersey (SI Appendix, Fig. S9).
Meteorological Data.
Data used to compute wave power are available at the National Data Buoy Center (www.ndbc.noaa.gov/). Specifically, we use the following stations: VENF1: 27.072° N, 82.453° W for Tampa Bay; SRST2: 29.683° N, 94.033° W for Vermillion Bay; LLNR 293: 29.212° N, 88.207° W for Lake Borgne; LLNR 1205: 27.907° N, 95.353° W for Galveston Bay; CLKN7: 34.622° N, 76.525° W for Pamlico Sound; LLNR 830: 40.251° N, 73.164° W for Barnegat Bay; LLNR 168: 38.461° N, 74.703° W for Delaware Bay; and CHLV2: 36.905° N, 75.713° W for Virginia Coast Reserve (SI Appendix, Figs. S2–S4).
Wind Waves.
Average water depth and fetch measurements for each individual site are presented in SI Appendix, Figs. S2 and S3. To compute wave climate, we follow the equations by Young and Verhagen (31). Wave height, , is computed from the wave energy, , through the expression , whereas the wave power is , where is the group velocity.
The dimensionless wave energy, , and peak frequency, , are related to the nondimensional fetch and dimensionless water depth through the expression
| [2] |
where is the gravitational acceleration, is the reference wind velocity at an elevation of 10 m, is the wave frequency, is the fetch, is the water depth, , and . The dimensionless peak frequency is
| [3] |
where and .
For data points presented in Fig. 1 and relative to the Barnegat Bay–Little Egg Harbor system, we use the Coupled Ocean Atmosphere Wave Sediment Transport Modeling System (32) to reconstruct the long-term wave climate in the area. Water-level variations typical of a tidal cycle and wind speed and direction measurements collected from the National Data Buoy Center (see above) are used as model input. The numerical model is used to more conveniently obtain wave power values at the scale of the entire bay (SI Appendix, Figs. S9 and S10).
Return Period of Wave Events.
For the calculation of the return period of wave events, we use the maxima method, which consists of breaking up the initial sequence of data into monthly blocks, extracting the maximum observation for each block, and fitting an extreme value distribution. Assuming independence between different months, a well-established model for extreme wave heights is based on the Gumbel distribution (34) (SI Appendix, Fig. S7), which reads
| [4] |
with and being the distribution parameters. If is the maximum value during the month and is the variable Gumbel distribution function, the year return period, , is
| [5] |
For the Gumbel distribution, it follows that the return value for the monthly maximum is
| [6] |
Supplementary Material
Acknowledgments
We acknowledge the NJ Office of Information Technology, Office of Geographic Information Systems as the source of aerial images. This research was supported by NSF Awards OCE-1354251, DEB-0621014 (VCR-LTER Program), and OCE-1238212 (PIE-LTER Program) and DOI-USGS Award G14AC00045.
Footnotes
The authors declare no conflict of interest.
This article is a PNAS Direct Submission.
This article contains supporting information online at www.pnas.org/lookup/suppl/doi:10.1073/pnas.1510095112/-/DCSupplemental.
References
- 1.Kirwan ML, Megonigal JP. Tidal wetland stability in the face of human impacts and sea-level rise. Nature. 2013;504(7478):53–60. doi: 10.1038/nature12856. [DOI] [PubMed] [Google Scholar]
- 2.Leonardi N, Fagherazzi S. How waves shape salt marshes. Geology. 2014;42(10):887–890. [Google Scholar]
- 3.Fagherazzi S. The ephemeral life of a salt marsh. Geology. 2013;41(8):943–944. [Google Scholar]
- 4.Priestas AM, Mariotti G, Leonardi N, Fagherazzi S. Coupled Wave Energy and Erosion Dynamics along a Salt Marsh Boundary, Hog Island Bay, Virginia, USA. Journal of Marine Science and Engineering. 2015;3(3):1041–1065. [Google Scholar]
- 5.Prime T, Brown JM, Plater AJ. Physical and economic impacts of sea-level rise and low probability flooding events on coastal communities. PLoS One. 2015;10(2):e0117030. doi: 10.1371/journal.pone.0117030. [DOI] [PMC free article] [PubMed] [Google Scholar]
- 6.Van Wijnen HJ, Bakker JP. Long-term surface elevation change in salt marshes: A prediction of marsh response to future sea-level rise. Estuar Coast Shelf Sci. 2001;52(3):381–390. [Google Scholar]
- 7.Leonardi N, Fagherazzi S. Effect of local variability in erosional resistance on large-scale morphodynamic response of salt marshes to wind waves and extreme events. Geophys Res Lett. 2015;42(14):5872–5879. [Google Scholar]
- 8.Smith CG, Adams CS, Osterman LE. Examining long-term response of estuarine marsh environments in southwest Louisiana to sea-level and storm impacts. Geological Society of America Abstracts with Programs. 2015;47(2):15. [Google Scholar]
- 9.Goldenberg SB, Landsea CW, Mestas-Nunez AM, Gray WM. The recent increase in Atlantic hurricane activity: Causes and implications. Science. 2001;293(5529):474–479. doi: 10.1126/science.1060040. [DOI] [PubMed] [Google Scholar]
- 10.Saunders MA, Lea AS. Seasonal prediction of hurricane activity reaching the coast of the United States. Nature. 2005;434(7036):1005–1008. doi: 10.1038/nature03454. [DOI] [PubMed] [Google Scholar]
- 11.Nyberg J, et al. Low Atlantic hurricane activity in the 1970s and 1980s compared to the past 270 years. Nature. 2007;447(7145):698–701. doi: 10.1038/nature05895. [DOI] [PubMed] [Google Scholar]
- 12.Webster PJ, Holland GJ, Curry JA, Chang H-R. Changes in tropical cyclone number, duration, and intensity in a warming environment. Science. 2005;309(5742):1844–1846. doi: 10.1126/science.1116448. [DOI] [PubMed] [Google Scholar]
- 13.Fagherazzi S. Coastal processes: Storm-proofing with marshes. Nat Geosci. 2014;7(10):701–702. [Google Scholar]
- 14.Currin CA, Chappell WS, Deaton A. 2010. Developing alternative shoreline armoring strategies: The living shoreline approach in North Carolina. Puget Sound Shorelines and the Impacts of Armoring, Proceedings of a State of the Science Workshop, May 2009, eds Shipman H, Dethier MN, Gelfenbaum G, Fresh KL, Dinicola RS (US Geological Survey, Reston, VA), pp 91–102.
- 15.Moller I, et al. Wave attenuation over coastal salt marshes under storm surge conditions. Nat Geosci. 2014;7(10):727–731. [Google Scholar]
- 16.Temmerman S, et al. Ecosystem-based coastal defence in the face of global change. Nature. 2013;504(7478):79–83. doi: 10.1038/nature12859. [DOI] [PubMed] [Google Scholar]
- 17.Francalanci S, Bendoni M, Rinaldi M, Solari L. Ecomorphodynamic evolution of salt marshes: Experimental observations of bank retreat processes. Geomorphology (Amst) 2013;195:53–65. [Google Scholar]
- 18.Marani M, D’Alpaos A, Lanzoni S, Santalucia M. Understanding and predicting wave erosion of marsh edges. Geophys Res Lett. 2011;38(21):L21401. [Google Scholar]
- 19.Schwimmer RA. Rates and processes of marsh shoreline erosion in Rehoboth Bay, Delaware, USA. J Coast Res. 2001;17(3):672–683. [Google Scholar]
- 20.Howes NC, et al. Hurricane-induced failure of low salinity wetlands. Proc Natl Acad Sci USA. 2010;107(32):14014–14019. doi: 10.1073/pnas.0914582107. [DOI] [PMC free article] [PubMed] [Google Scholar]
- 21.Feagin RA, et al. Does vegetation prevent wave erosion of salt marsh edges? Proc Natl Acad Sci USA. 2009;106(25):10109–10113. doi: 10.1073/pnas.0901297106. [DOI] [PMC free article] [PubMed] [Google Scholar]
- 22.Hughes ZJ, et al. Rapid headward erosion of marsh creeks in response to relative sea level rise. Geophys Res Lett. 2009;36(3):L03602. [Google Scholar]
- 23.McLoughlin S, Wiberg P, Safak I, McGlathery K. Rates and forcing of marsh edge erosion in a shallow coastal bay. Estuaries Coasts. 2014;38(2):620–638. [Google Scholar]
- 24.Trosclair KJ. 2013. Wave transformation at a saltmarsh edge and resulting marsh edge erosion: Observations and modeling. PhD thesis (University of New Orleans, New Orleans)
- 25.Tomkins K, McLachlan G, Coleman R. 2014. Quantification of coastal bank erosion rates in Western Port (CSIRO Water for a Healthy Country Flagship, Australia). Water for a Healthy Country Flagship Report Series ISSN: 1835-095X.
- 26.Priestas AA. 2014. The role of wind waves on salt marsh morphodynamics. PhD dissertation (Boston University, Boston)
- 27.Brandon CM, Woodruff JD, Donnelly JP, Sullivan RM. How unique was Hurricane Sandy? Sedimentary reconstructions of extreme flooding from New York Harbor. Sci Rep. 2014;4(2014):7366. doi: 10.1038/srep07366. [DOI] [PMC free article] [PubMed] [Google Scholar]
- 28.Wolman MG, Miller JP. Magnitude and frequency of forces in geomorphic processes. J Geol. 1960;68:54–74. [Google Scholar]
- 29.Durán Vinent O, Moore LJ. Barrier island bistability induced by biophysical interactions. Nat Clim Chang. 2015;5(2):158–162. [Google Scholar]
- 30.Ratliff KM, Murray AB. Modes and emergent time scales of embayed beach dynamics. Geophys Res Lett. 2014;41(20):7270–7275. [Google Scholar]
- 31.Young IR, Verhagen LA. The growth of fetch limited waves in water of finite depth. Part 1. Total energy and peak frequency. Coast Eng. 1996;29(1):47–78. [Google Scholar]
- 32.Warner JC, Armstrong B, He R, Zambon JB. Development of a Coupled Ocean–Atmosphere–Wave–Sediment Transport (COAWST) modeling system. Ocean Model. 2010;35(3):230–244. [Google Scholar]
- 33.Defne Z, Ganju NK. Quantifying the residence time and flushing characteristics of a shallow, back-barrier estuary: Application of hydrodynamic and particle tracking models. Estuaries Coasts. 2014;38(5):1719–1734. [Google Scholar]
- 34.Muir LR, El-Shaarawi AH. On the calculation of extreme wave heights: A review. Ocean Eng. 1986;13(1):93–118. [Google Scholar]
Associated Data
This section collects any data citations, data availability statements, or supplementary materials included in this article.


