Significance
The textbook view of how transcription is quantitatively regulated is through changes in transcription initiation. However, the arrangement of DNA in chromatin in eukaryotes and the frequent occurrence of noncoding transcripts add to the complexity of transcriptional regulation. Here, we explore the quantitative transcriptional regulation of FLC, a gene important for developmental timing in Arabidopsis. FLC expression correlates with altered antisense transcript processing and different chromatin states. Through experiments and mathematical modeling, we discover that transcription initiation and elongation are tightly coordinated and both are influenced by the chromatin state at the locus. Modulation of the chromatin environment by noncoding transcripts to coordinately influence transcription initiation and elongation could be a general mechanism to regulate quantitative transcriptional output.
Keywords: chromatin, COOLAIR, autonomous pathway, FCA, alternative polyadenylation
Abstract
The basis of quantitative regulation of gene expression is still poorly understood. In Arabidopsis thaliana, quantitative variation in expression of FLOWERING LOCUS C (FLC) influences the timing of flowering. In ambient temperatures, FLC expression is quantitatively modulated by a chromatin silencing mechanism involving alternative polyadenylation of antisense transcripts. Investigation of this mechanism unexpectedly showed that RNA polymerase II (Pol II) occupancy changes at FLC did not reflect RNA fold changes. Mathematical modeling of these transcriptional dynamics predicted a tight coordination of transcriptional initiation and elongation. This prediction was validated by detailed measurements of total and chromatin-bound FLC intronic RNA, a methodology appropriate for analyzing elongation rate changes in a range of organisms. Transcription initiation was found to vary ∼25-fold with elongation rate varying ∼8- to 12-fold. Premature sense transcript termination contributed very little to expression differences. This quantitative variation in transcription was coincident with variation in H3K36me3 and H3K4me2 over the FLC gene body. We propose different chromatin states coordinately influence transcriptional initiation and elongation rates and that this coordination is likely to be a general feature of quantitative gene regulation in a chromatin context.
The influence of chromatin on transcription and cotranscriptional processing is of central importance in the regulation of gene expression (1, 2). An intensively studied example where the local chromatin state is considered to influence transcription in Arabidopsis is FLOWERING LOCUS C (FLC). FLC encodes a MADS-box transcription factor and acts as a floral repressor (3, 4). FLC expression is tuned by different genetic pathways: FRIGIDA activates FLC expression through a mechanism requiring Trithorax homologs, Paf1C, and SET DOMAIN GROUP 8 (SDG8), an H3K36 methyltransferase (5). FLC expression is repressed by the autonomous pathway and vernalization (5). Both these repressive pathways involve a group of antisense long noncoding transcripts collectively termed COOLAIR, which initiate immediately downstream of the poly(A) site at the 3′ end of FLC. These antisense transcripts terminate at either proximal sites internal to the FLC gene, or distal sites within the FLC promoter (6, 7). Mutation of autonomous pathway components, including the RNA binding proteins FCA and FPA and the conserved components of the 3′ processing complex FY, Cstf64 and Cstf77, leads to relative reduction in use of the proximal polyadenylation sites and increased FLC sense expression (reviewed in ref. 8). FCA localizes to FLC chromatin near the proximal poly(A) sites (9), and this together with the fact that PRP8 and CDKC;2 (P-TEFb component), identified in FCA suppressor screens (10, 11), both require COOLAIR to repress FLC, supports the idea that promotion of proximal polyadenylation of COOLAIR is directly linked to reduced FLC expression. FLOWERING LOCUS D (FLD), an H3K4me2 demethylase, also functions in this mechanism and fld is the most effective suppressor of FCA function at FLC (9). FLD modulates H3K4me2 levels in the gene body of FLC; however, how FCA functions with FLD to achieve FLC repression remains to be fully elucidated.
Here, we investigate how FCA and FLD transcriptionally repress FLC through analysis of Pol II occupancy. We use these data together with RNA measurements to parameterize an analytic mathematical model of FLC transcription. Model predictions are then tested through detailed measurements of intronic total and chromatin-bound RNA levels. This methodology is very appropriate for evaluating elongation rate changes in whole organisms where pulse-chase experiments are technically unfeasible. At FLC, we find that both FCA- and FLD-mediated repression occurs not only through reduced transcription initiation, but also through a coordinately reduced Pol II elongation rate. We propose that chromatin modifications at FLC induced by FCA and FLD, influenced by the antisense transcript processing, coordinately change initiation and elongation to quantitatively regulate the transcriptional output of the locus.
Results
RNA Fold Changes Do Not Reflect Pol II Occupancy Changes.
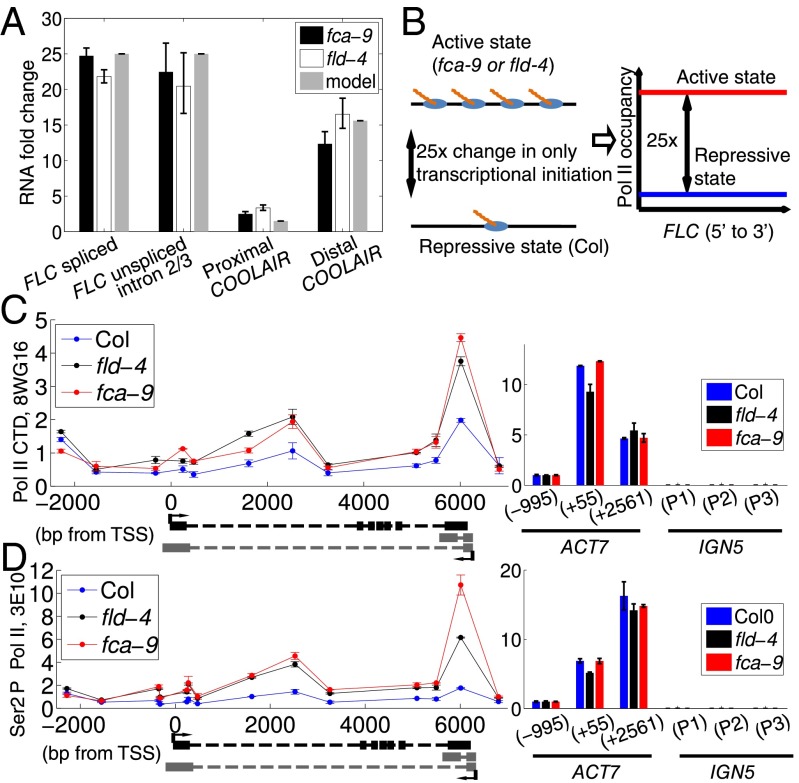
Measurement of steady-state spliced FLC and unspliced FLC RNA showed an increase in expression of ∼20- to 25-fold between Col and fca-9 and fld-4 (Fig. 1A). We reasoned that, if this was caused by a 25× change in transcription initiation, a 25× increase in Pol II levels would be found at FLC, assuming transcript half-lives, splicing/3′ processing efficiency, Pol II processivity, and elongation rates are unaffected in fca-9 and fld-4 (Fig. 1B). However, both total Pol II and productively elongating Pol II (Ser2-P) showed relatively small changes (2–3×) across FLC in the different genotypes (Fig. 1 C and D, and Fig. S1 A and B). We ruled out a number of technical issues with Pol II ChIP that could have led to an underestimation of Pol II occupancy. First, measurements on a highly expressed gene (ACT7) and a Pol IV/V transcribed region (IGN5) showed that a wide dynamic range (>1,000× by comparing levels at ACT7 to IGN5) could be detected in the Pol II ChIP assay (Fig. 1 C and D). Pol II levels at FLC were well above background at IGN5 (Fig. 1 C and D, and Fig. S1). Second, specific dilutions of FLC chromatin, without changing the overall amount of chromatin, showed rough linearity between the Pol II ChIP signal and the Pol II concentration at FLC (Fig. S2). Third, cell-specific FLC expression variation is also highly unlikely to underlie this difference in RNA and Pol II up-regulation, as both assays use whole plant seedlings and thus reflect population averages. Based on these observations, we conclude that FCA/FLD-mediated changes in FLC transcription are unlikely to occur solely through changes in transcription initiation.
Fig. 1.
Large increases in RNA are associated with small changes in Pol II occupancy. (A) RNA fold up-regulation in fca-9 and fld-4 mutants compared with Col: spliced and unspliced FLC (∼25×), proximal (∼2×) and distal COOLAIR (∼13×). The model values are the fits to the experimental data. Experimental values are mean ± SEM from three to six independent samples. (B) Schematic illustration of a scenario where transcription initiation is the only difference between Col and fca-9, so that a 25× fold change in Pol II occupancy should be observed as illustrated on the Right. (C and D) ChIP experiments assaying Pol II occupancy across FLC using the antibodies anti CTD 8WG16 (C) and anti Ser2 P CTD 3E10 (D). The bar charts at the Bottom indicate Pol II levels at various control genes. Three overlapping primer pairs are used to measure IGN5 expression (P1–P3). Values are mean ± SEM from two independent samples, with data presented as the ratio of Pol II at FLC/input at FLC to Pol II at ACT7 (−995)/input at ACT7 (−995).
Fig. S1.
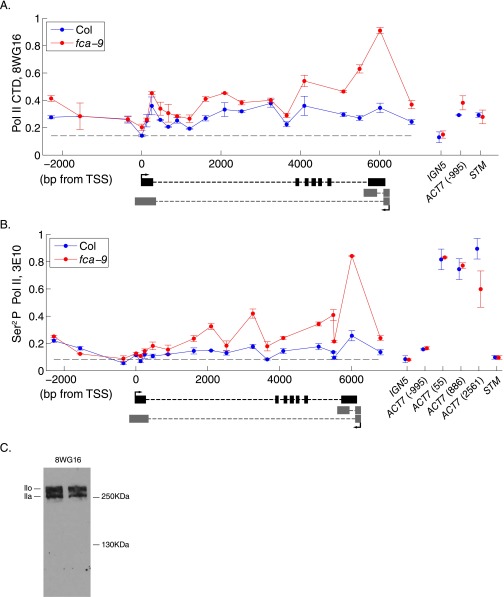
Pol II levels at FLC are increased only approximately twofold in fca-9 and fld-4 compared with Col (related to Fig. 1). (A) ChIP experiments assaying Pol II (using anti-CTD 8WG16) across FLC and at internal controls. (B) ChIP experiments assaying Pol II (using anti-Ser2P CTD 3E10) across FLC and at internal controls. (C) Western blot detection of Pol II by using 8WG16 antibody in Arabidopsis. 8WG16 recognizes both hypophosphorylated (lla) and hyperphosphorylated (llo) CTD of NRPB1. Nuclear extract was separated on 6% SDS/PAGE gel. (A and B) These two assays were done by adopting less stringent washing steps after immunoprecipitation compared with the data shown in Fig. 1. The dashed line indicates an upper limit on the background level in this ChIP experiment, equalling the level at IGN5. Values are mean ± SEM from two independent samples, with data normalized to 1% of input.
Fig. S2.
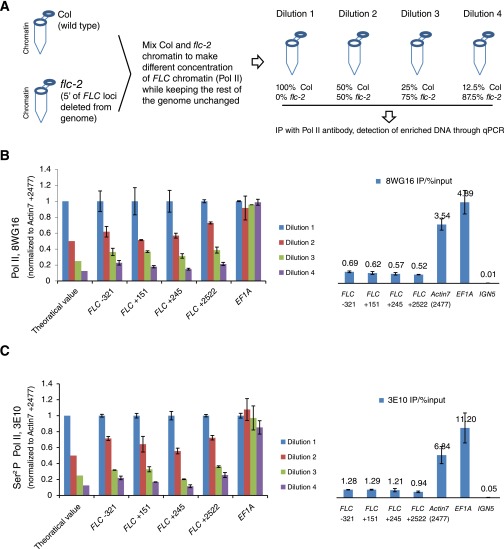
Linearity of Pol II ChIP assay (related to Fig. 1). (A) Schematic illustration of the experimental procedure testing how the Pol II ChIP signal reflects the change of Pol II concentration locally at FLC. (B) 8WG16 Pol II ChIP signal from different FLC chromatin dilutions at 5′ region of FLC. (C) 3E10 Pol II ChIP signal from different FLC chromatin dilutions at 5′ region of FLC. (B and C) Theoretical values indicate the expected Pol II ChIP signal if the Pol II ChIP signal scales linearly with the local concentration of Pol II. The bar chart on the Right shows the ChIP signal at FLC and control genes from dilution 1. The signals are well above background (at IGN5). Values are mean ± SEM from two independent samples, with data normalized to Actin7 (Left) or %input (Right).
FLC Transcriptional Dynamics Can Be Explained by Coordination of Initiation and Elongation.
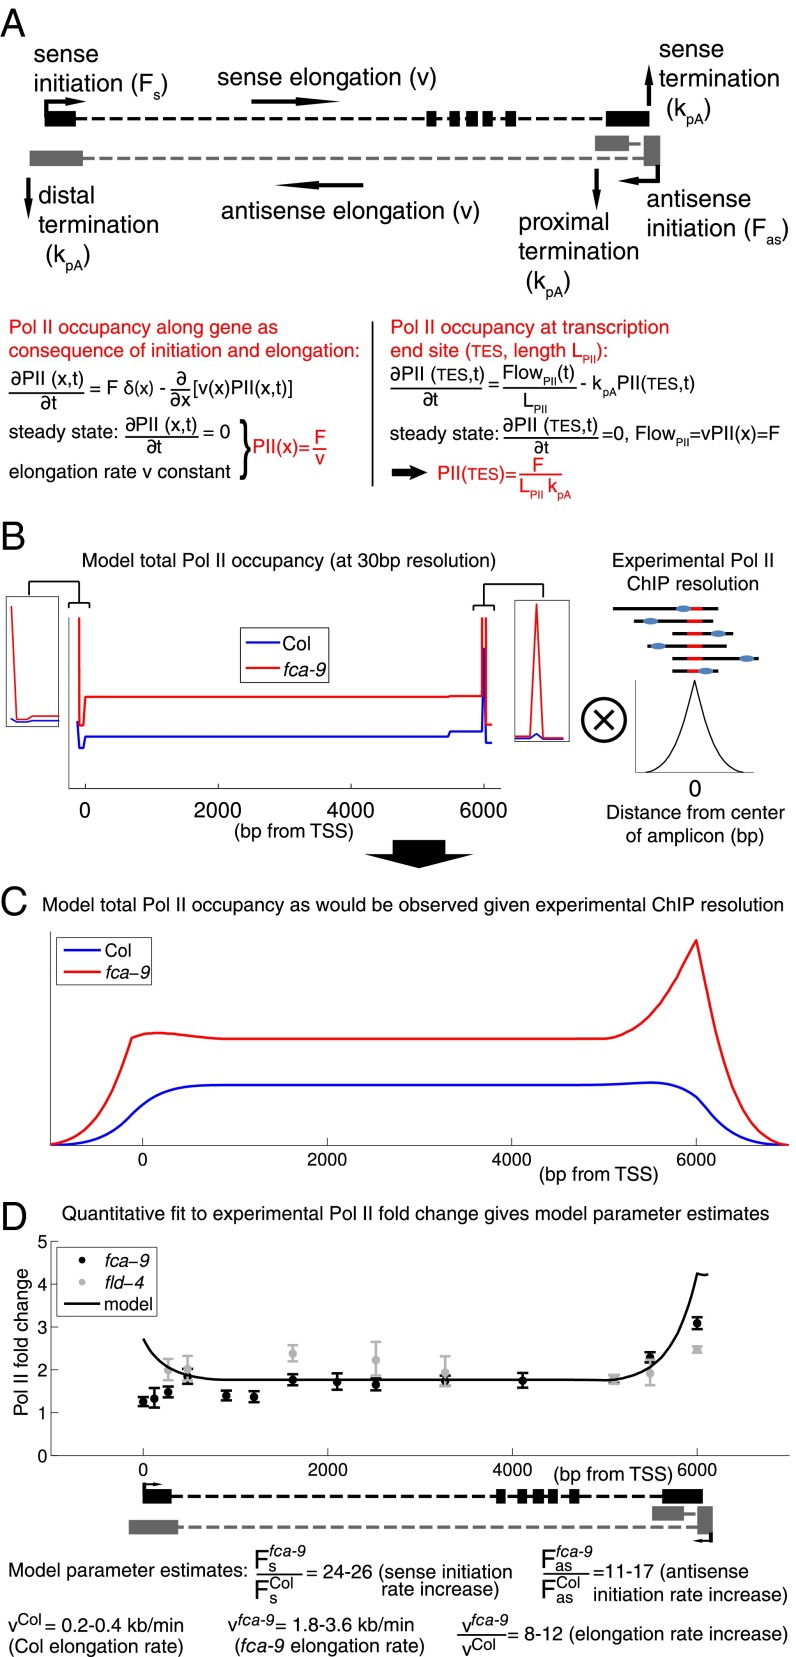
To further understand how FCA- and FLD-mediated FLC repression occurs at a transcriptional level, we developed an analytical mathematical model of the transcriptional dynamics at FLC by incorporating sense FLC and COOLAIR initiation, elongation, and termination (Fig. 2A; see Supporting Information for complete description). The experimental data described above were used as model inputs. This strategy enabled us to assign parameter values for key processes during transcription (e.g., initiation and elongation). Pol II levels reflect a density that can be described mathematically as a ratio of the initiation rate (F) over the elongation rate (v) (12). Because our ChIP signal is not strand specific, we summed the sense and antisense model Pol II levels to generate a model total Pol II profile along FLC (Fig. 2B). The small increase of Pol II ChIP signal in the transcriptionally active fca-9 and fld-4 mutants (Fig. 1 C and D, and Fig. S1) is explained by the model through a coordinated increase in initiation and elongation rates (Fig. 2 B and C). The model also reproduced the FLC spliced, unspliced, and COOLAIR fold up-regulation in fca-9 and fld-4 (Fig. 1A), where a 25× fold increase in sense Pol II initiation required an 8–12× fold faster rate of elongation to quantitatively fit the Pol II occupancy increase (Fig. 2D). Elevated Pol II levels at the 3′ of FLC resulted from sense termination and proximal antisense transcription (Fig. 2 A–D). Our model does not take into account transcriptional interference (TI) between sense FLC and COOLAIR (Discussion). Using an experimentally determined value for the termination rate 1/50 s−1 (13), absolute elongation rates could be inferred from the model, yielding 0.2–0.4 kb/min (Col) and 1.8–3.6 kb/min (fca-9 and fld-4). These correspond well to values found in other organisms (14–17). The excellent fit of the experimental data strongly supports a model where FLC transcriptional dynamics are governed by coordinated changes in initiation and elongation.
Fig. 2.
Small changes in Pol II occupancy can be explained by coordinated changes in transcription initiation and elongation. (A) Schematic of FLC locus and outline of the mathematical model for FLC transcription (details in Supporting Information). Black boxes indicate sense exons; gray boxes indicate proximal (Upper) and distal (Lower) antisense exons. (B) Total (sum of sense and antisense) model Pol II levels in Col and fca-9 across FLC. The fld-4 mutant model results are identical to fca-9. Shown on the Right is a schematic of the convolution process with experimental Pol II ChIP fragment size distribution (shown in Fig. S3). (C) Total Pol II levels in Col and fca-9 across FLC from the model convolved with experimental Pol II ChIP fragment size distribution. (D) Experimental and model Pol II fold up-regulation. Experimental values are mean ± SEM from two to five independent samples, including data shown in Fig. 1 C and D, and Fig. S1. Model fold changes are ratio of profiles shown in C.
Cotranscriptional Splicing, Combined with Coordinated Initiation and Elongation, Generate Distinctive Patterns of RNA Up-Regulation Along FLC Intron1.
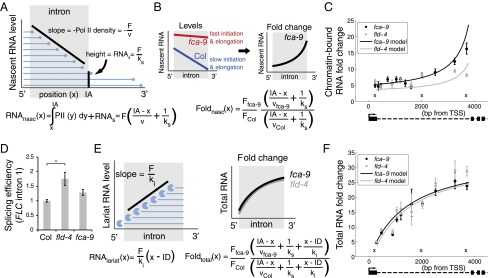
We next tested the predicted coordinate increase in initiation and elongation rates experimentally. Measurement of elongation rates on a subset of highly expressed, long mammalian genes (>50 kb) has been achieved using GRO-seq (14). This technique involves inhibition of elongation and then release and relies on rapid removal of an inhibitor that is difficult in whole organisms (15, 16). We tried an alternative approach via generation of an FLC-MS2 fusion (13), but this was not expressed at a sufficiently high level to be useful. To overcome these limitations, we used our theoretical model to make specific predictions with regards to intronic FLC RNA production, which we then tested experimentally. If introns are spliced cotranscriptionally once Pol II has reached the 3′ end of the intron, then nascent RNA from the 5′ end of the intron resides on the chromatin longer than that from the 3′ end. This generates a nascent RNA profile along an intron with declining levels from the 5′ to 3′ end (17, 18). An analytic mathematical analysis (Fig. 3A and Supporting Information) predicts that the ratio of Pol II initiation (F) over the elongation rate (v) determines the slope of the nascent intronic RNA levels between the 5′ to 3′ ends, whereas the initiation rate over the splicing rate (ks) determines the levels of completely transcribed, unspliced introns (Fig. 3A). This analysis indicates that nascent RNA levels close to the intron 3′ end will be mostly determined by the ratio of the initiation rate to the splicing rate, and independent of the elongation rate. Away from the 3′ end of the intron, transcripts emerging from Pol II still transcribing the intron will also contribute to nascent RNA levels, and hence the ratio of the initiation rate to the elongation rate will also be important (Fig. 3A). Taking into account both increased initiation and elongation rates in the fca-9 mutant compared with Col (Fig. 3B), this analysis enabled us to predict a spatially varying fold up-regulation of nascent RNA along FLC intron1 (Fig. 3B).
Fig. 3.
Combination of increased initiation and elongation, with cotranscriptional splicing and lariat degradation, leads to distinct RNA profiles along FLC intron1. (A) Schematic indicating intronic nascent RNA, RNAnasc (blue lines), arising from Pol II (blue circles) elongating through the intron and from unspliced RNAs with full-length intron. Once Pol II has passed the intron acceptor site (IA), splicing can occur. Initiation, elongation, and splicing rates are F, v, and ks, respectively. Analytic expression for RNAnasc is shown below. (B) Schematic (Left) indicating model profiles of nascent RNA along FLC intron1 in fca-9 and Col. Between fca-9 and Col, F and v are coordinately increased, but with the same ks. This generates a characteristic pattern of intronic nascent RNA fold changes between fca-9 and Col (Right) with analytic expression shown. (C) Modeled and experimentally measured chromatin-bound RNA fold changes along FLC intron1. The lower increase toward the 3′ end in fld-4 is due to increased splicing rate as shown experimentally in D. Crosses indicate positions where data are from three different, overlapping primer sets that each show similar results (Fig. S4). (D) Estimate of FLC intron1 splicing efficiency (intron cleavage rate) in fld-4 and fca-9, normalized to the level in Col. Values are mean ± SEM from three independent samples. Asterisks indicate statistical significance: for all of the figures in this study, *P < 0.05, **P < 0.01, ***P < 0.001, two-sided unpaired t test, unless specified otherwise. (E) Schematic showing effect of 5′ to 3′ intronic RNA degradation on lariat RNA levels (RNAlariat). Full-length lariat RNA results from splicing and is degraded with rate ki; ID: intron donor site. These degradation intermediates, together with the nascent RNA described in A, make up total intronic RNA. Fold up-regulation then generates the characteristic profiles shown. Analytic expressions for RNAlariat and total intronic RNA fold changes are shown. (F) Modeled and experimentally measured total RNA fold changes along FLC intron1. (C and F) Experimental values are mean ± SEM from at least three independent samples. Absolute levels are shown in Fig. S4.
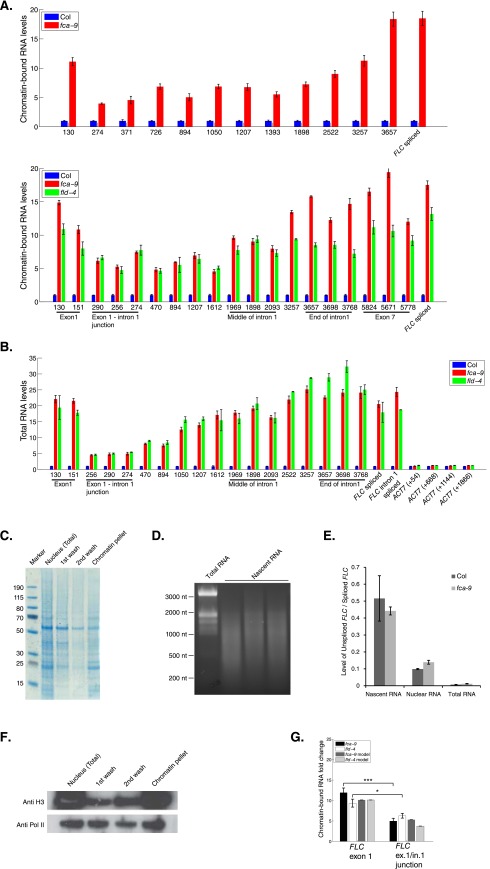
We tested this key model prediction by measuring the chromatin-bound RNA profile at FLC (Fig. 3C and Fig. S4). Comparing fca-9 to Col, the chromatin-bound fold up-regulation inside exon1 was much larger than at the exon1–intron1 junction (Fig. S4 A and G), suggesting that splicing of intron1 does occur mostly cotranscriptionally. In the first kilobase of intron1, as predicted by the model, there was only a small fold increase in fca-9 compared with Col (Fig. 3C and Fig. S4A). This is due to the dependence on the ratios of the initiation and elongation rates and their coordinated increases in fca-9 (Fig. 3B). By contrast, the fold up-regulation was much larger close to the intron acceptor site in fca-9. This is in agreement with the model, where we used the experimentally determined splicing rate of 1/100 s−1 (17) for both Col and fca-9, with other parameters determined from our prior fitting to the Pol II ChIP data (Supporting Information). Importantly, the chromatin-bound RNA profile along intron1 is not flat, which is what would be predicted without changes to the elongation rates between fca-9 and Col.
Fig. S4.
Intronic RNA levels increase gradually along FLC intron1 (related to Fig. 3). (A) Chromatin-bound RNA levels in fca-9, fld-4, and Col, along FLC intron1. (B) Total RNA levels in fca-9, fld-4, and Col along FLC intron1. Primers along Actin7 were checked as a control. (A and B) Experimental values are mean ± SEM from three independent samples. (C) Proteins in different fractions obtained during chromatin-bound RNA preparation. Same volume from each fraction was loaded and separated in 4–20% gradient NuPAGE gel and stained with Coomassie blue. (D) The size distribution of chromatin-bound RNA. No obvious band of ribosomal RNA was detected. (E) Enrichment of unspliced FLC (intron2 and intron3 unspliced) over spliced FLC (intron4, intron5, and intron6 spliced) in total, nuclear, and chromatin-bound RNA fractions. Values are mean ± SD from three independent samples. (F) Majority of Pol II (8WG16) and H3 was preserved in the chromatin fraction. Different fractions obtained during chromatin-bound RNA preparation were gel separated (as in C), followed by Western blot detection of Pol II and H3. (G) Model and experimentally measured chromatin-bound RNA fold up-regulation in fca-9 and fld-4 compared with Col at FLC exon1 and exon1–intron1 junctions. The related mathematical analysis can be found in Computational Modeling.
We also fitted the model to the chromatin-bound RNA data directly using nonlinear regression (R2 = 0.89, F statistic: P = 3 × 10⁻¹⁴). This procedure also led to the conclusion that significant elongation rate changes [fold = 9.8 ± 3.8 (mean ± SEM), P = 0.03] are required to explain the profile (Supporting Information). Importantly, this method does not rely on the specific values of splicing and elongation rates and is independent of Pol II ChIP data, and thus provides additional evidence for the elongation rate changes.
Interestingly, we observed less increase in fold up-regulation toward the 3′ end of intron1 in fld-4 compared with fca-9 (Fig. 3C and Fig. S4A). Given the fold change close to an intron acceptor site is more sensitive to splicing rather than elongation rate changes (Fig. 3B), we examined whether a splicing rate change specific to fld-4 could explain its differential fold up-regulation pattern from fca-9 (Materials and Methods and Supporting Information). Indeed, we found that we could fit the fld-4 profile in our model by incorporating a twofold faster splicing rate (1/50 s−1) in fld-4 (Fig. 3C), while keeping all other parameters unchanged. We further verified this model prediction of an increased splicing rate in fld-4 by measuring the splicing efficiency of FLC intron1. As predicted, the efficiency was increased 1.8-fold in fld-4 (Fig. 3D), but not significantly altered in fca-9 (P = 0.1, two-sided unpaired t test). A simple alternative model with unchanged splicing and elongation rates between Col and fld-4 would produce a constant chromatin-bound RNA fold change across intron1. That would be consistent with the chromatin-bound RNA dataset in isolation (Fig. 3C) but implies a change in the initiation rates of approximately sevenfold (Supporting Information), which is inconsistent with our earlier spliced and unspliced FLC RNA fold changes (Fig. 1A).
To further support these conclusions, we investigated the total intronic RNA profile (Fig. 3 E and F, and Fig. S4). Such measurements include intron lariat degradation intermediates, which are present in the total but not chromatin-bound RNA fraction (Fig. 3E) (17). Assuming that lariat degradation occurs from 5′ to 3′, lariat RNA at the 3′ generally exists for longer than that at the 5′. This generates a lariat RNA profile with increasing levels from the 5′ to 3′ end (Fig. 3E). Importantly, incorporating this lariat population into the total intronic RNA fold up-regulation between fca-9 and Col, without altering the model parameterization that explained the Pol II and chromatin-bound RNA, produced a predicted profile that is qualitatively different to that found for the chromatin-bound RNA (Fig. 3 B and E). This prediction was also validated experimentally (Fig. 3F). Compared with the chromatin-bound RNA profile, there was a significantly larger fold increase in the first 2 kb of the total intronic RNA profile (P = 8 × 10⁻⁷ and 4 × 10⁻⁷ for fca-9 and fld-4, respectively; two-sided Welch’s t test) (Fig. 3 C and F, and Fig. S4 A and B). In the model, we could generate such a profile, by solely incorporating 5′ to 3′ intron lariat degradation with a rate of 1.5 bp/s (19), in line with experimentally determined intron half-lives (17). Potential additional presence of 3′ to 5′ degradation (19) with a rate up to 1 bp/s did not alter our conclusions (Supporting Information). The profiles for total intronic RNA look very similar between fca-9 and fld-4 (Fig. 3F), in contrast to the chromatin-bound data (Fig. 3C). This similarity is because the lariat RNA effectively extends the half-life of intronic RNA and therefore reduces the effect of the differential splicing rates between fca-9 and fld-4 (Fig. 3F). Taken together, our total and chromatin-bound intronic RNA profiles provide strong evidence that repression of FLC involves a coordinated change of both the initiation and elongation rates. Moreover, the methods we developed here can be used to infer elongation rate changes in whole organisms where pulse-chase experiments are not feasible.
Sense Premature Termination Contributes Little to FLC Repression.
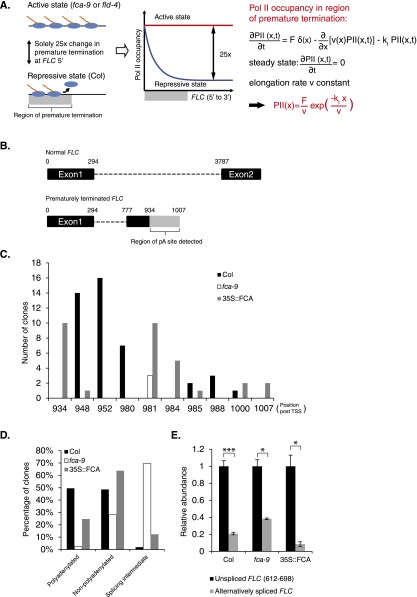
Previous reports have linked the elongation rate to either Pol II processivity (20) or early termination (21). In these scenarios, Pol II would terminate prematurely as a result of slow elongation. Our previous analysis did not require any such premature termination. Moreover, at an intuitive level, premature termination should lead to declining levels of Pol II from 5′ to 3′ in the repressed case (Col) (Fig. S5A and Supporting Information). However, we found no evidence for this in our Pol II ChIP assay (Fig. 1 C and D, and Fig. S1) and no short transcripts had been detected by Northern blot using an FLC intron1 probe (22). These findings suggest that premature termination contributes little to FLC repression. To further confirm this conclusion, we undertook 3′-RACE to map transcripts ending within the promoter-proximal region of FLC. We could detect polyadenylated transcripts that terminated within FLC intron1. These transcripts all contained FLC exon1 and were mostly alternatively spliced with the same donor site but with a different acceptor site, compared with the conventional FLC intron1 (Fig. S5B). By monitoring the alternatively spliced intron associated with premature termination, we found these transcripts are of lower abundance than unspliced intron1 in Col, fca-9, and 35S::FCA (Fig. S5E). Therefore, sense premature termination occurs only occasionally at FLC and is not a major contributor to FLC repression.
Fig. S5.
Detection of prematurely terminated FLC transcripts. (A) Schematic illustration of premature termination and mathematical analysis of its influence on the Pol II occupancy across FLC. (B) Schematic illustration of prematurely terminated transcripts detected from 3′-RACE. The upper panel indicates the major FLC transcript with regions omitted after exon2. The lower panel indicates the splicing pattern of prematurely terminated FLC transcripts. Exons and introns are indicated by black boxes and dashed lines, respectively. The gray box indicates a region containing polyadenylation sites detected in 3′-RACE. Numbers above the schematic indicate positions of intron or exon boundaries (in base pairs post-TSS). (C) Number of clones mapped at each pA site detected by 3′-RACE in Col, fca-9, and 35S::FCA. All clones have a small intron spliced as shown in B. Position of pA site (in base pairs post-TSS) is marked below. (D) Percentage of polyadenylated, nonpolyadenylated, and splicing intermediate RNAs mapped in Col, fca-9, and 35S::FCA. Apart from clones with poly(A) tail, we also mapped many transcripts without a poly(A) tail. Some of these are likely splicing intermediates, as their 3′ ends correspond to the 3′ of an exon with the previous introns removed and exons ligated. Other unpolyadenylated transcripts are likely to be Pol II-bound as their 3′ ends mapped to the middle of an exon or intron. At least 100 clones were sequenced for each genotype. (E) Abundance of transcripts with the alternatively spliced intron (B) in different genotypes. Levels were measured using a primer set with one primer spanning exon–exon junction. Values are mean ± SEM from three independent samples; data are shown as abundance relative to intronic FLC level (612–698 bp post-TSS) in each genotype.
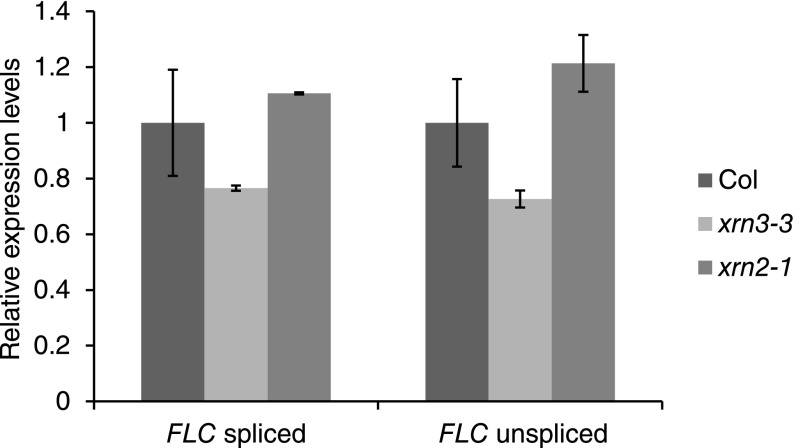
Cotranscriptional decay of nascent transcripts by 5′ to 3′ exonucleases has also been proposed to influence transcriptional output (23, 24). In such a scenario, the degradation of RNA should also lead Pol II to terminate prematurely, and therefore to declining levels of Pol II from 5′ to 3′ in the repressed state (Col), which is again inconsistent with our Pol II ChIP data. In addition, we analyzed FLC expression in mutants defective for these functions (xrn2-1, xrn3-3) (25) in Arabidopsis and found no increase in FLC nascent or fully spliced FLC RNA levels (Fig. S6). Therefore, such a decay pathway is unlikely to play a major role in determining the overall transcriptional dynamics at FLC.
Fig. S6.
Relative RNA expression level of FLC spliced and unspliced in Col, xrn3-3, and xrn2-1. Level in Col was set as 1. Values are mean ± SD from three independent samples.
FLD Alters the Local Chromatin State to Influence Transcriptional Output via Coordinated Changes in Initiation and Elongation.
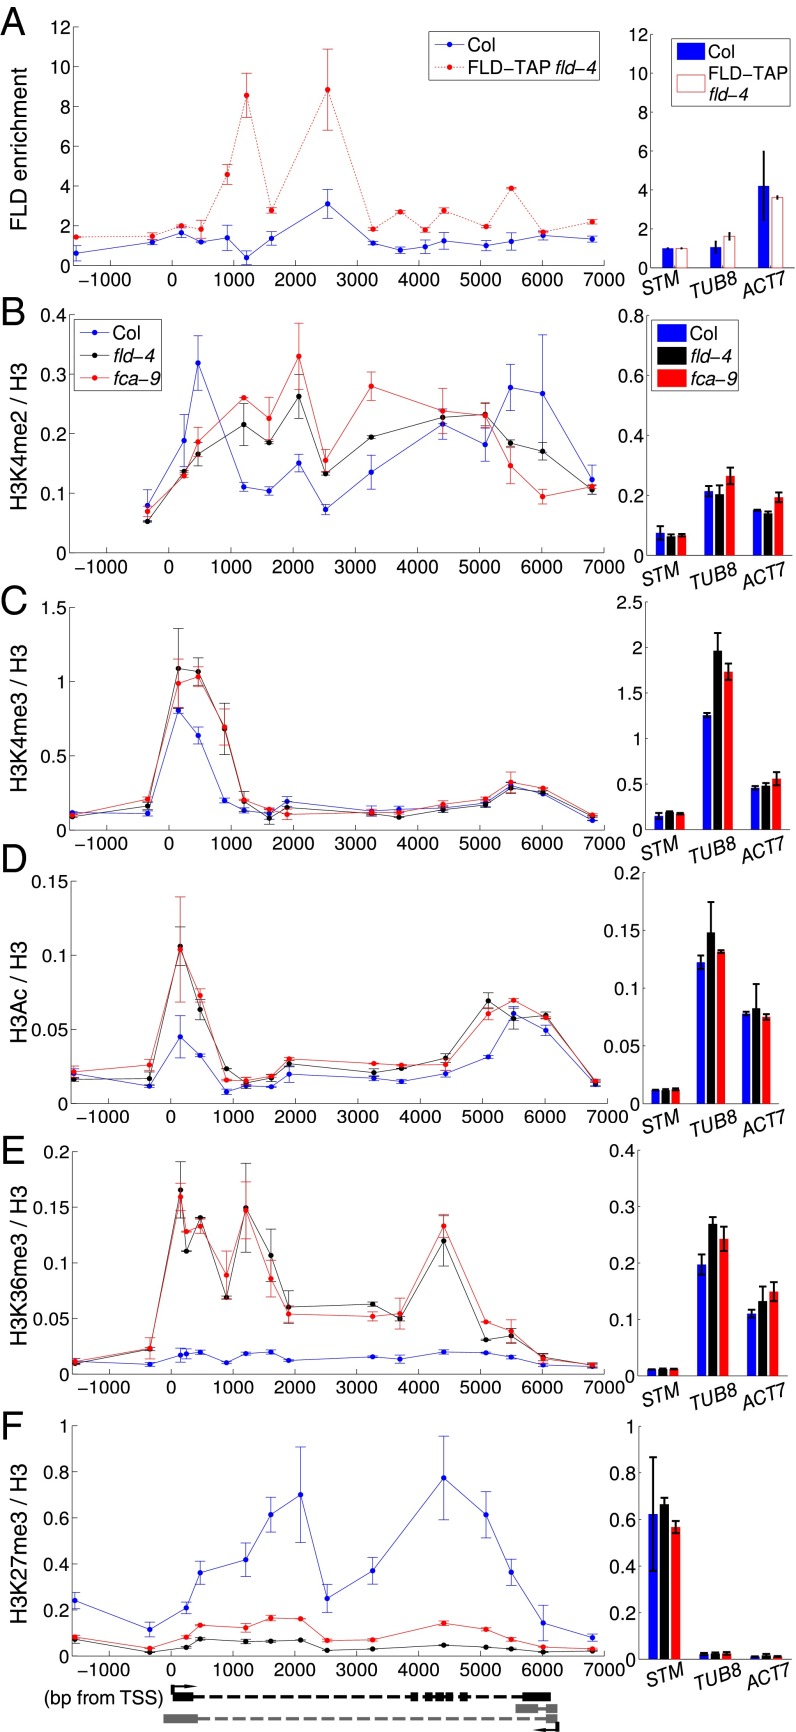
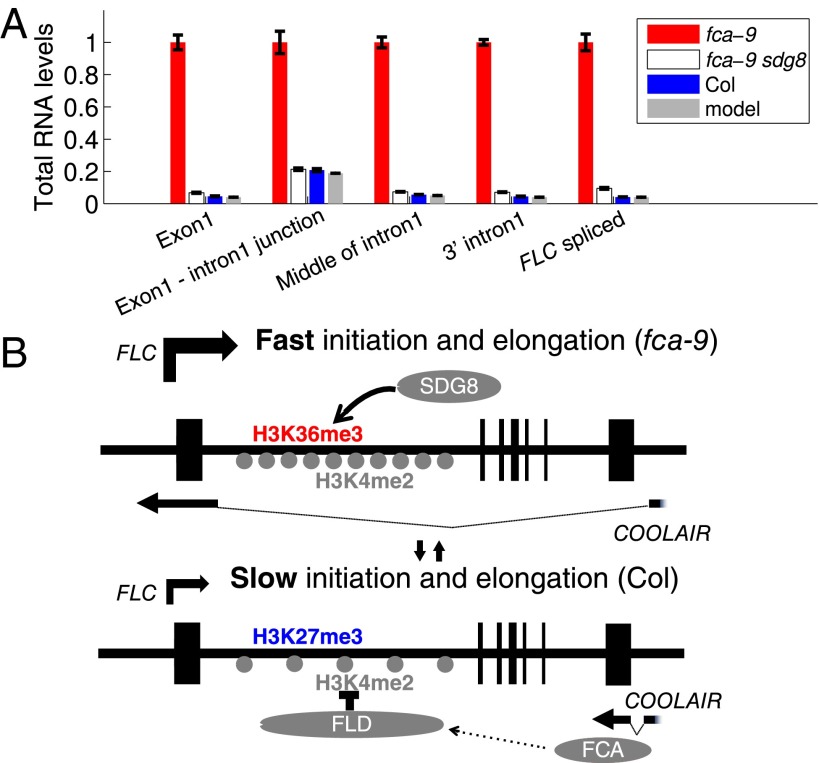
We therefore continued with our investigation of coordinated initiation and elongation rates by FCA/FLD-mediated changes in chromatin modifications. We analyzed the localization of the histone demethylase FLD at FLC using a complementing FLD-TAP fusion expressed from its endogenous regulatory sequences (Fig. S7 A–C). FLD shows the highest enrichment at FLC ∼1–3 kb downstream of the transcription start site (TSS) (Fig. 4A). This localization is consistent with the increased H3K4me2 in the FLC gene body (1–4 kb beyond the TSS) in the fld-4 mutant (Fig. 4B). Loss of FLD, and indeed similarly FCA, resulted in changes in a number of other chromatin modifications (Fig. 4 C–F). H3K4me3 and H3Ac increased around the FLC sense TSS (Fig. 4 C and D), coincident with lower H3K4me2 in this region. The relatively small changes in H3K4me2 were correlated with much larger changes in H3K36me3 and the mirror modification H3K27me3 (Fig. 4 E and F) along the whole gene. Loss of the H3K36me3 methyltransferase in sdg8 confers early flowering and low FLC expression (26–28). Combination of fca with sdg8 results in an FLC level and profile of total RNA across intron1 similar to that in Col (Fig. 5A and Fig. S8). Therefore, loss of SDG8-directed H3K36me3 is also likely to coordinately reduce Pol II initiation and elongation rates at FLC. Taken together, our data suggest that activities downstream of antisense processing act antagonistically to SDG8 function, leading to coordinated changes in initiation and elongation at FLC (Fig. 5B).
Fig. S7.
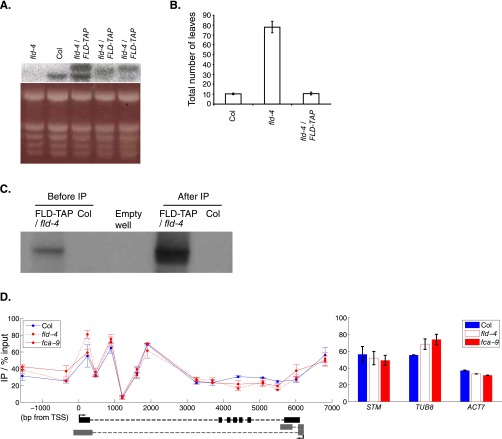
The FLD-TAP transgene is functional, and H3 levels at FLC are not affected in fld-4 and fca-9 mutants (related to Fig. 4). (A) Expression level of the FLD-TAP transgene compared with endogenous FLD. (Top) Northern blot probed with an FLD cDNA. (Bottom) Ethidium bromide staining of the gel showing equal loading. Genotypes are labeled at Top of images. (B) FLD-TAP transgene fully complemented the fld-4 mutation. Total leaf number of plants grown under long day conditions is shown. Genotypes are labeled on the x axis. Data shown are means ± SDs of 20 plants of each genotype. (C) Western blot detection of FLD-TAP before and after immunoprecipitation. FLD-TAP can be detected as a single band at around 100 kDa in the nucleus, and it was enriched after immunoprecipitation following the same procedure as in the ChIP. (D) Histone H3 levels do not differ significantly among Col, fld-4, and fca-9 at FLC. Values at control genes, STM, ACT7, and TUB8 are shown on Right. Values are mean ± SEM from two independent samples, with data normalized to %input.
Fig. 4.
FLD enrichment at the FLC locus is associated with changed histone modifications. (A) FLD-TAP ChIP enrichment across FLC in Col and FLD-TAP/fld-4. Values are mean ± SEM from two independent samples, with data presented as enrichment at FLC relative to enrichment at STM. (B–F) ChIP across FLC in Col, fca-9 and fld-4 measuring H3K4me2 (B), H3K4me3 (C), H3Ac (D), H3K36me3 (E), and H3K27me3 (F). Values are mean ± SEM from two independent samples, with data normalized to H3. Values at the control genes STM, ACT7, and TUB8 are shown on the Right. H3/input values can be found in Fig. S7.
Fig. 5.
Coordination of initiation and elongation at FLC in the H3K36 methyltransferase-deficient sdg8 mutant. (A) Total RNA levels along FLC intron1. Model is as described in Fig. 2. All values are relative to fca-9. Experimental values are mean ± SEM from three independent samples and are averaged from overlapping primer sets (Fig. S8). (B) Working model of how FLC expression is quantitatively regulated through coordination of transcription initiation and elongation. In the absence of FCA/FLD, H3K36me3 is increased at FLC through SDG8 function, and this promotes fast transcription initiation and elongation. In the presence of FCA/FLD, antisense processing triggers a reduction of H3K4me2, loss of H3K36me3, and an increase in H3K27me3, which reduces transcription initiation and slows elongation.
Fig. S8.
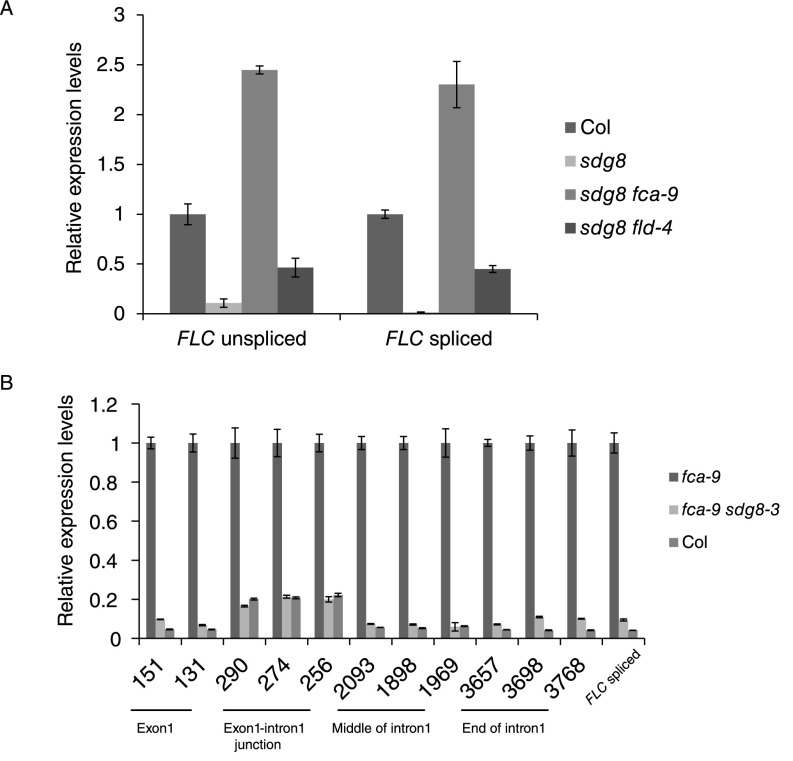
(A) Relative RNA expression level of FLC spliced and unspliced in Col, sdg8, sdg8 fca-9, and sdg8 fld-4. Level in Col was set as 1. Values are mean ± SD from three independent samples. (B) Total RNA levels in fca-9, sdg8 fca-9, and Col along FLC intron1. Level in Col was set as 1. Values are mean ± SEM from three independent samples.
Discussion
Understanding how flowering time in plants is regulated has led into a detailed mechanistic dissection of the regulation of the Arabidopsis thaliana floral repressor FLC. Genetic screens have identified RNA processing factors that target antisense transcripts of FLC and histone modifiers as important components quantitatively repressing FLC expression. Here, using a combination of mathematical modeling and experiments, we show FLC regulation involves coordination of transcription initiation with elongation. This may be a general feature of gene regulation as evidenced by genome-wide correlations between gene expression, gene body Pol II levels, and Pol II elongation rates found in yeast and mammalian cells (14, 29).
How Pol II initiation and elongation are coordinated is still unclear. In Escherichia coli, newly initiated RNA polymerases can facilitate elongation of the leading polymerase (30). Such a mechanism is unlikely to be the case at FLC, because FLC is not highly expressed even in its active state (compared with Actin). Elongation is likely influenced by Pol II CTD modifications and the chromatin state (31, 32), both directly through nucleosome turnover dynamics and indirectly via differential recruitment of elongation factors. In Arabidopsis, elongation factor TFIIS is required for elongation of many genes but a tfIIs mutant does not show changed FLC expression (10, 33, 34). However, FLC expression is particularly sensitive to reduced amounts of the histone chaperone FACT (35), so it will be interesting to test whether FACT is required for the fast elongation observed in fca-9 and the coordination mechanism. We have found here that FLD recruitment, changed H3K4me2, and the resulting changes in H3K36me3 at FLC are likely important for this coordination. Our analysis of SDG8 suggests that H3K36me3 is essential to maintain both a fast initiation and elongation rate at FLC (Fig. 5B). We therefore propose that changed histone modifications actively influence FLC regulation and are not just a reflection of transcription.
Our results raise the question whether there is a general need to coordinate transcription initiation and elongation. Control of gene expression may necessitate such coordination as, for instance, a slow elongation rate relative to initiation would cause an accumulation of Pol II at the promoter that would limit the number of additional Pol II molecules that can initiate through occlusion (36). Such a limit might become even more stringent due to bursty initiation or Pol II pausing/backtracking during elongation (37). Furthermore, antisense transcription might induce a limit on initiation rates to prevent the occurrence of TI (38). However, 5′ pausing of Pol II is not a feature at FLC (as shown by the absence of a 5′ peak in Pol II ChIP), arguing against occlusion effects. The expression of sense and antisense is positively correlated at FLC, arguing against a major role for TI. Instead, we suggest that altered elongation rates reinforce selection of different antisense isoforms, which can then recruit different chromatin regulators to the gene, thereby modulating coordinated transcription initiation and elongation (Fig. 5B). An important question now is to understand how far the lessons from FLC reflect regulation mechanisms both genome- and organism-wide. Coordination between initiation and elongation could generally enhance transcription efficiency, potentially to minimize transcription-associated genome instability (39). Modulation of the deposition of different histone modifiers by noncoding transcripts may be a general mechanism to coordinately affect Pol II initiation and elongation and thus quantitatively modulate transcriptional output.
Materials and Methods
Experimental procedures and mathematical modeling can be found in Supporting Information.
Experimental Procedures
Chromatin Immunoprecipitation Assays.
Seedlings were grown on germination medium plates at 22 °C (16 h light/8 h dark) for 2 wk before collecting. Two grams of plant tissue were cross-linked with 1% formaldehyde in 1× PBS for 15 min by vacuum infiltration, followed by addition of glycine to 125 mM with another 5 min of vacuum infiltration. Chromatin immunoprecipitation (ChIP) was performed as described in ref. 11 with minor modifications. After being ground into a fine powder, the material was suspended in 30 mL of Honda buffer [20 mM Hepes, 0.44 M sucrose, 1.25% (wt/vol) Ficoll, 2.5% (wt/vol) Dextran T40, 10 mM MgCl2, 0.5% Triton X-100, 5 mM DTT, 1× protease inhibitor mixture (Roche)], filtered through two layers of Miracloth, and centrifuged at 3,500 × g for 5 min. For histone ChIP, nuclear pellets were resuspended in 4 vol of Nuclei Lysis Buffer (50 mM Tris⋅HCl, pH 8.0, 10 mM EDTA, 1% SDS, 1× protease inhibitor mixture) and sonicated with 15 30-s-long pulses (30-s intervals) using a Diagenode Bioruptor (low setting). Immunoprecipitation was performed by incubating 30 μL of Dynabeads protein A (Invitrogen), 5 μg of antibody, and 1 mL of diluted chromatin (containing 100 μL of sonicated chromatin) at 4 °C overnight. Immunoprecipitated DNA was eluted after reverse cross-linking by boiling at 95 °C for 10 min in the presence of 10% (wt/vol) chelex resin, followed by treatment with 40 μg of proteinase K for 1 h at 55 °C. Samples were treated with StrataClean resin (Agilent Technologies). Five micrograms of anti-Histone H3 antibody (Abcam; ab1791), H3K4me2 antibody (Millipore; 07-030), H3K36me3 antibody (Abcam; ab9050), H3Ac antibody (Millipore; 06-599), and H3K27me3 antibody (Millipore; 07-449) were used for each IP reaction. Values are means ± SEM from two independent samples; data were normalized to H3. STM, Actin7, and Tubulin8 were used as controls.
Pol II ChIP was performed according to ref. 11. The nuclear pellet from 2-g seedlings was resuspended in 1 mL of TAP buffer [100 mM NaCl, 20 mM Tris, pH 7.5, 2.5 mM EDTA, 10% (vol/vol) glycerol, 1% Triton X-100, 1× protease inhibitor mixture] and given 20 strokes in a Dounce homogenizer. The resulting solution was sonicated 40 times (15 s on/45 s off, low setting; Diagenode Bioruptor). A volume of 250 μL of the supernatant was used for each IP together with 50 μL of Dynabeads protein G and 10 μg of anti-Ser2P CTD (Active Motif; 3E10) or anti-CTD (Abcam; 8WG16, ab817, which recognize both the phosphorylated and unphosphorylated CTD in Arabidopsis) (Fig. S1C). The IP reaction was performed with rotation for 4 h at 4 °C. Beads were washed for 2 × 15 min with low-salt wash buffer (150 mM NaCl, 20 mM Tris, pH 7.5, 2.5 mM EDTA, 0.05% Na-deoxycholate, 1% Triton X-100, 1× protease inhibitor), for 2 × 15 min with high-salt wash buffer (500 mM Nacl, 20 mM Tris, pH 7.5, 2.5 mM EDTA, 0.05% Na-deoxycholate, 1% Triton X-100, 1× protease inhibitor), for 1 × 15 min with LiCl Wash Buffer (250 mM LiCl, 20 mM Tris, pH 7.5, 2.5 mM EDTA, 0.5% Na-deoxycholate, 0.5% Nonidet P-40, 1× protease inhibitor) (for 8WG16 only) and for 1 × 15 min with TE buffer (10 mM Tris, pH 7.5, 1 mM EDTA). The resulting DNA was recovered in the same way as for histone ChIP. Values are means ± SEM from two independent samples; data are presented as a ratio of (Pol II FLC/input FLC) to (Pol II at internal control/input at internal control) to correct for tube-to-tube variation (the Pol II level at position −995 in Actin7 was used for normalization). For Fig. S1, data are presented as %input because tube-to-tube variation is negligible (judged by the value at internal controls). Three overlapping primer pairs at IGN5 (reported as a non-Pol II target) were used to obtain a reliable measurement of the background level. Levels at Actin7, IGN5/6, and STM were checked to demonstrate the dynamic range of the ChIP assay. All of the primers used are listed in Table S1.
To determine whether the Pol II ChIP signal accurately reflects the concentration of Pol II at FLC (as a population average), we mixed different amounts of Col and flc-2 chromatin as shown in Fig. S2A. In this way, we created a series of concentrations of FLC chromatin in the solution without changing the overall amount of chromatin. We then tested how this different concentration of FLC chromatin is reflected by the Pol II ChIP signals at FLC. The results showed that, at FLC, the Pol II ChIP signal corresponds roughly linearly to the concentration of Pol II at FLC chromatin (Fig. S2 B and C).
FLD-TAP ChIP was performed similar as described for Pol II ChIP with following modifications. The 0.1% SDS was added into the TAP buffer during sonication. Immunoprecipitation was done by using anti-FLAG M2 antibody (Sigma; F1804) with Dynabeads protein G. After immunoprecipitation, the beads were washed for 4 × 15 min with low-salt wash buffer, for 2 × 15 min with medium-salt wash buffer (250 mM NaCl), and for 1 × 15 min with TE buffer, followed by reverse cross-linking and elution. Values are mean ± SEM from three independent samples and normalized as IP/%input at FLC divided by IP/%input at STM. All of the primers used are listed in Table S1.
Determining the Pol II ChIP Fragment Size Distribution.
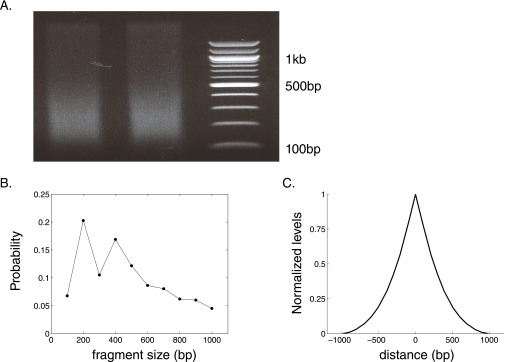
Using ImageJ (plot profile), we quantified the DNA fragment intensity and the location of fragment length markers along an agarose gel (Fig. S3A). Combined together, these data reveal the DNA fragment intensity as a function of fragment length. Because the obtained intensity is proportional to the fragment size, we divided the intensity by the fragment length, resulting in an estimate for the relative abundance of fragments, for fragments ranging from 100 bp up to 1 kb. We then normalized this function to obtain the fragment length distribution (Fig. S3B).
Fig. S3.
Pol II levels obtained in ChIP are affected by the fragment size (related to Fig. 2). (A) Fragment size intensity in Pol II ChIP assay. The DNA was recovered from sonicated chromatin and was resolved on a gel with DNA size markers running in parallel. (B) Fragment size distribution of lengths ranging between 100 bp and 1 kb, as extracted from A. See Determining the Pol II ChIP Fragment Size Distribution for details. (C) Normalized Pol II occupancy resulting from the experimental fragment distribution shown in B, in presence of a single Pol II located at the origin.
Expression Analysis Using Real-Time RT-PCR.
Seedlings grown for 2 wk postgermination in long days (16/8-h photoperiod) were harvested, and total RNA was extracted using the hot phenol method. A total of 2.5 μg of RNA (as measured by OD260) or 500 ng of chromatin-bound RNA (see below) was treated twice with TURBO DNase (Life Technologies) and used for cDNA synthesis (Superscript III; Life Technologies) in a 10-μL system (52 °C, 1 h). The resulting cDNA was diluted 50 times and used for quantitative PCR using a Roche LightCycler 480 and SYBR Green Master Mix. For each experiment, the PCR efficiency of each primer pair was calculated on the same plate of experimental samples using a series dilution of the cDNA mix generated from the same experiment. For data normalization, the data were first normalized to the reference gene UBC21 or EF1A (for the chromatin-bound assay only). The values from three independent samples were normalized to the mean Col level. Final values are ±SEM from three independent samples. Minus RT controls were set up to make sure the values reflect the level of RNA and not DNA contamination. Primers used for cDNA synthesis and quantitative PCR can be found in Table S1.
Measurement of Fold Increases in fca-9 over Col Along FLC Intron1 in Total RNA and Chromatin-Bound RNA.
After DNase treatment, 2.5 μg of total RNA or 500 ng of chromatin-bound RNA was used in the RT reaction. A mixture of the reverse primer (1 pmol each, Table S1) that anneals to different locations at FLC, together with the R primer of UBC21 and EF1A were included in the RT reaction. Data were first normalized to the reference gene UBC21 (total RNA) or EF1A (chromatin-bound RNA). Values from each independent sample were normalized to the mean Col level. Final values are ±SEM from three independent samples. Values reflect the level of RNA but not DNA contamination as no amplification occurred in the minus RT control.
Preparation of Chromatin-Bound RNA.
Chromatin-bound RNA was prepared according to a protocol published previously with modifications (40). Nuclei from 2-g seedlings (2 wk postgermination) were prepared with Honda buffer in the presence of 50 ng/μL tRNA, 20 U/mL RNase inhibitor (SUPERase•In; Life Technologies), and 1× cOmplete Protease inhibitor (Roche), as described in Chromatin Immunoprecipitation Assays. The nuclei pellet was resuspended in an equal volume of resuspension buffer [50% (vol/vol) glycerol, 0.5 mM EDTA, 1 mM DTT, 25 mM Tris⋅HCl, pH 7.5, 100 mM NaCl]. The nucleus was washed twice with UREA wash buffer (25 mM Tris⋅HCl, pH 7.5, 300 mM NaCl, 1 M urea, 0.5 mM EDTA, 1 mM DTT, and 1% Tween 20). Two volumes of wash buffer were added to the resuspended nuclei and vortexed for 1 s. The chromatin was spun down, and protein was removed by phenol/chloroform. RNA from the supernatant was precipitated with isopropanol, dissolved, DNase treated, and then used as a template for reverse transcription with gene-specific primers. As shown in Fig. S4 C and F, the majority of H3 and Pol II remained in the pellet, although significant amounts were washed away in both washes. This result indicated that the washing was stringent enough to ensure RNA in the pellet was mostly chromatin bound. Indeed, the ratio of unspliced FLC (intron2 and 3 unspliced) to spliced FLC (intron456 spliced) was mostly enriched in the chromatin-bound fraction compared with the level in nuclear RNA or total RNA (Fig. S4E).
Measurement of Splicing Efficiency of FLC Intron1.
To evaluate the splicing efficiency of FLC intron1, 2.5 μg of DNase-treated total RNA was reverse transcribed into cDNA by a primer annealing to FLC exon2. A primer pair where one primer crossed the exon1–exon2 junction was used to detect the level of spliced RNA (Table S1). A primer pair annealing to the end of intron1 was used to detect the level of unspliced RNA. This approach does not amplify the intron lariat as the reverse transcription was performed using the primer at exon2. The splicing efficiency was calculated as the ratio of spliced FLC over unspliced FLC. The PCR efficiency was calculated in the same experiment from cDNA dilutions and taken into account during calculations. The values from three independent samples were normalized to the mean Col level. Final values are ±SEM from three independent samples.
RNA Ligation-Mediated 3′-RACE.
3′-RACE was performed as described previously with modifications (9). Briefly, RNA was ligated to the 5′ end of the RNA/DNA adaptor (5′-Phos/rUrUrUAACCGCATCCTTCTCTCTACCTACCATTGACCTGTT/3′-ddC) using NEB T4 RNA ligase (37 °C, 1 h). The ligated RNA was purified and used for reverse transcription with the primer RACE-R1-R (which anneals to the adaptor). One microliter of resulting cDNA was used as a template in a PCR with primers RACE-R1-F and RACE-R1-R (25 cycles). The PCR product was purified, and 1 μL was used as a template for a second round of PCR with primers RACE-R2-F and RACE-R2-R (25 cycles). The PCR product from the second round was purified, and 1 μL was used as a template for a third round of PCR with primers RACE-R3-F and RACE-R3-R (30 cycles). The specific bands from the third round of PCR were gel purified, mixed, ligated into the pGEM-T-easy vector (Promega), and sequenced (with RACE-R3-F as a primer). No amplification arose from the minus RT reaction. For each round of PCR, a control reaction with just one primer was set up to judge the specificity of the different bands observed. The band corresponding to FLC mRNA was observed in the first round of PCR; other specific bands only started to appear from the second round of PCR.
Generation of FLD-TAP/fld-4.
For FLD-FLAG-cTAP-cloning, three fragments were amplified separately using pCambia 1300/FLD as a template and primers shown in Table S1. Fragment A containing the 3′ end of FLD followed by a FLAG sequence was amplified by primers FLDflagTAP-1 and FLDflagTAP-2; fragment B containing FLAG and cTAP sequences was amplified by FLDflagTAP-3 and FLDflagTAP-4; and fragment C containing the 3′ end of the TAP sequence, the FLD 3′ UTR, and the vector sequence of pCambia1300 was amplified by FLDflagTAP-5 and FLDflagTAP-6. These three fragments were fused by overlapping PCR using FLDflagTAP-1 and FLDflagTAP-6. All above PCRs were performed using PfuUltra DNA polymerase (Agilent). The resulting PCR product was digested by AflII and SbfI and replaced by the AflII/SbfI fragment in pCambia1300/FLD to make pCambia1300/FLD-FLAG-cTAP. The construct with the correct sequence was transformed into Agrobacterium tumefaciens GV3101 and further transformed into the fld-4 background using the floral dip method. Expression of the fusion was determined in each transgenic line. One representative line was selected and made homozygous; this line expressed the transgene at a similar level to the endogenous FLD and fully complemented the fld-4 phenotype (Fig. S7 A and B).
Computational Modeling
Analytical Treatment of Initiation, Elongation, and Early Termination on Pol II Levels.
Recently, Ehrensberger et al. (12) analyzed mathematically the Pol II levels measured in ChIP experiments. Here, we extend this analysis and include the effects of termination on Pol II levels across a gene. For simplicity, we first develop our theory for sense transcription, before generalizing to include both sense and antisense in Analytical Model Parameter Estimation.
We define the initiation rate (F) as the number of Pol II per unit time that successfully bind to the transcription start site (TSS) and become competent to elongate, with velocity v. Processes such as unsuccessful Pol II initiation, formation of a transcription elongation complex, promoter proximal pausing, arrest or slow elongation near the TSS (thereby inhibiting new initiation) also affect the magnitude of the initiation rate (12). Nevertheless, our analysis here is general enough to account for these situations. The intrinsic Pol II processivity is generally believed to be high (12); therefore, we first analyze a situation where Pol II continues to elongate until it is terminated by some active mechanism. Usually termination occurs after Pol II reaches a polyadenylation (pA) site, as a consequence of cleavage/polyadenylation of the nascent RNA transcript and subsequent eviction by a “torpedo” mechanism, mediated by the 5′-3′ exonuclease XRN (17). Even though this involves multiple steps, we assume in our minimal modeling approach that Pol II termination and RNA 3′ processing occur in one step with a probability per unit time of kpA.
If there is a single termination site, the density PII(x,t) of (elongating) Pol II at a distance x from the TSS, upstream of the termination site, is specified by the following equation (Fig. 2A):
At steady state, this equation is solved by the following:
| [S1] |
as shown in Fig. 2A, and as given by ref. 12. Intuitively, a higher initiation rate will increase the Pol II density, whereas a faster elongation rate will reduce it, consistent with Eq. S1. Pol II acceleration during early elongation (14), promoter proximal pausing (31), transcriptional pausing, backtracking, and arrest (37) can all be viewed as instances of a spatially varying elongation rate v(x).
It is a priori possible that functional RNA production is regulated by the location of Pol II termination. Indeed, a high density of promoter-proximal pA-site signals reinforce early termination to limit pervasive transcription in the divergent antisense direction of coding genes (41). Alternatively, regulation could occur through an effect on Pol II processivity. Several factors are known to influence Pol II processivity in vivo in yeast (20). To maintain generality, we again do not specify exactly what mechanism(s) constitute early termination. Instead, we assume that, inside a region R immediately downstream of the TSS, Pol II can elongate with velocity v(x) but also terminate early with a rate kt. If Pol II elongates beyond the end of region R, we assume it continues to elongate to a definite termination site further downstream, producing a functional RNA. Below, we show that such a model generates a Pol II density that is exponentially decreasing with distance x within the region R.
For the above system, we can write down an appropriate equation for the Pol II density at time t and distance x from the TSS (within region R):
We next assume that the system is in steady state: . Rearranging, we arrive at a differential equation for the steady-state Pol II density :
This equation can be solved analytically, giving the following:
Because termination does not affect the Pol II density at the TSS, we can replace with the previously obtained expression for the steady-state Pol II density: . This leads to the desired Pol II density in the presence of early termination:
| [S2] |
In the case of a relatively high termination rate kt, this results in a sharp promoter-proximal Pol II peak that is potentially indistinguishable in ChIP assays from promoter-proximal pausing (12). Our analysis also predicts that quicker elongation reduces the early termination probability, as found with Sen1-mediated early termination in yeast (21). We also considered a model where nascent RNA is cotranscriptionally targeted for degradation from 5′ to 3′ by, for instance, XRN exonucleases. When nascent RNA was completely degraded, the Pol II would drop off as in the Torpedo mechanism (17). This model still predicted that the vast majority of Pol II would terminate prematurely as a consequence of XRN targeting and thereby cause Pol II levels to drop. Interestingly, however, we did not experimentally observe spatially varying levels of Pol II over the gene body, in either the Col, fca-9, or fld-4 cases (Fig. 1 C and D, and Fig. S1 A and B). As such variation would occur with regulation via early termination (Eq. S2), we conclude that premature termination or promoter-proximal pausing are unlikely to be major mechanisms of FLC regulation by the FCA pathway. We therefore proceed with our analysis, setting kt = 0.
Next, we consider the situation where Pol II terminates while pausing near a pA site (17) (Fig. 2A). In steady state, the number of Pol II, NPII (not density in this case) at the termination site is determined by the ratio of the initiation rate over the termination rate, with the latter determined by the rate kpA of RNA 3′ processing:
Hence, the density of Pol II at that position is given by the following:
where LPII is the length of the termination site. If Pol II termination is sufficiently slow, this analysis can explain why 3′ Pol II levels can be higher than those in the gene body (Figs. 1 and 2 and Fig. S1).
Analytical Treatment of Initiation and Elongation Rate Effects on RNA Expression.
We next investigated theoretically how RNA expression depends on the processes introduced in the previous sections. In our analysis of RNA, we need only to consider sense transcription, as our experimental measurements are sense strand specific. Although the analysis can be generalized to include early termination, we focus on the effects of initiation and spatially independent elongation rate changes, because they are most relevant to FLC regulation (see above). Steady-state levels of mature (spliced and polyadenylated) RNAs are often modeled as the ratio of the transcriptional production rate over the degradation rate d (42). In the absence of early termination, the initiation rate can be interpreted as the mature RNA production rate. Notably, quicker elongation rates (with a constant initiation rate) do not lead to higher mature RNA levels (12). Thus, the RNA fold up-regulation , the ratio of mature (spliced, polyadenylated and exported) sense RNA levels in an fca-9 (or fld-4) mutant to that in Col, equals the ratio of initiation rates:
Because we calculate fold changes, the value of the degradation rate is irrelevant for our analysis, as long as the processes that contribute to RNA degradation downstream of transcription are not changed between Col and the fca-9 or fld-4 mutants. This assumption is justified, because all current experimental evidence (Figs. 2–4 and refs. 6, 9, and 10) indicates regulation at the transcriptional level only.
Elongation rates influence how quickly Pol II reaches a pA or intron acceptor site and thereby affect how quickly RNA export or splicing, and subsequent lariat degradation, can occur after the initiation of transcription. As a result, Pol II elongation rates can thus affect the lifetime of nascent RNA (in contrast to mature RNA). To formalize this reasoning, let v be the (spatially independent) elongation rate, ks = 1/Ts be the splicing rate (intron cleavage rate) given that the intron has been fully transcribed, and kex = 1/Tex be the RNA export rate, given that the full-length RNA has been transcribed. Furthermore, we assume that, after splicing, linearized lariat RNA is degraded from 5′ to 3′, from intron donor site (ID) to intron acceptor site (IA), with degradation rate ki (in units of base pairs per second) (19). Here, x is again the distance from the TSS.
First, we analyze total intronic RNA levels, RNAtotal(x), which are generally made up of three fractions: first, Pol II-bound RNA arising from Pol II that has elongated beyond x but has not yet reached the IA [RNAi(x)]; second, RNA with the complete intron transcribed that is competent to be spliced out (RNAs); and third, intronic degradation products in the process of being degraded RNAlariat(x). This decomposition leads to RNAtotal(x) = RNAi(x) + RNAs + RNAlariat(x). For RNAi(x), all Pol II present along the intron that has elongated beyond x will contribute. Hence, we have the following:
Overall, we therefore find the following:
where the expression for RNAlariat(x) follows similar reasoning as for RNAi(x) above. We assume here that degradation begins as soon as splicing has occurred. However, if there is a delay, this can be straightforwardly absorbed into the timescale Ts. Modeling the donor and acceptor site cleavage steps separately (43) is not essential for purely intronic sequences: the timescale Ts represents the time after which cleavage of both has occurred. RNA levels across the exon/intron junction at the donor site can be modeled by taking x = ID and replacing Ts with a timescale for donor site cleavage: . We also considered the potential presence of 3′ to 5′ lariat RNA degradation, with rate ki_35 (in units of base pairs per second), in addition to 5′ to 3′ degradation (21). In this case, we can replace the expression for with .
Note that we expect only F and v to alter between Col and the fca-9 mutant, as we concluded in the previous section. Total intronic RNA fold changes can be experimentally measured in total RNA assays:
| [S3] |
Furthermore, we see that, in the presence of elongation rate changes, the intronic RNA fold change profile as a function of position will be qualitatively different in the absence of intronic degradation products ():
| [S4] |
where we assume that the splicing time TS is much shorter than the combined timescale to elongate across the locus and then be exported. The fraction, thought to be nucleoplasmic but not chromatin bound (40), is likely to be largely washed away in a chromatin-bound RNA assay. A similar analysis can also be made comparing fld-4 with Col, where we use the same parameters for fld-4 as with fca-9, except now the splicing time TS is allowed to differ.
Last, the model predicts that exonic, chromatin-bound RNA levels, RNAexon(x), are also dependent on elongation rates, and are determined by two populations: first, RNA bound to Pol II, where the Pol II has elongated beyond x but not yet reached the FLC 3′ end, and second, RNA that is full length and residing at the locus before export ():
| [S5] |
Convolution of the Pol II Density for Comparison with Experiments.
We need to quantitatively compare the Pol II density from the above analysis with the experimental Pol II ChIP levels. To facilitate this comparison, we developed a method that in essence generates a predicted Pol II ChIP profile arising from a combination of the underlying analytic Pol II density calculated above and the resolution-limiting effects inherent to the experimental ChIP fragment size distribution. This procedure is mathematically defined as a convolution and is often used in image processing. Let x be the position along a gene (in sites of size Nbp = 30 bp). The convoluted profile is proportional to the predicted density of Pol II at position x, given the uncertainty in fragment length. Intuitively, is a sum of all of the ChIP fragments that overlap with x weighted by the number of Pol II bound somewhere along their length. We next define I(y) as the probability that a ChIP fragment, pulled down with a certain Pol II antibody, is of length y (in sites). We determined the distribution I as described in Experimental Procedures, Determining the Pol II ChIP Fragment Size Distribution. Let ymin (ymax) be the minimum (maximum) fragment size length. Furthermore, let be the Pol II density at position x arising from our theory. This can be used to determine the convolved Pol II density profile:
Here, G indicates the length of the region from which fragments could arise, in our case on the order of the whole genome. Thus, because ymax ≪ G, the term is effectively a small constant:
Using a custom-written script in MATLAB, we implemented this formula for both Col and the fca-9 mutant Pol II occupancy. Fig. 2 illustrates the effects of the convolution. The shape of the convoluted profiles are (qualitatively) in line with the experimental Pol II ChIP profiles along the gene (Fig. 1 C and D). The predicted fold up-regulation of Pol II is the ratio (same for fld-4) and can be compared quantitatively with the experimental fold change (Fig. 2D).
Analytical Model Parameter Estimation.
We now detail our procedures for fitting the analytical model to the Pol II ChIP (Fig. 2D) and prior RNA data (Fig. 1A), where we now also include antisense transcription in our analytical model fits to the Pol II data. Below the subscript “s” refers to sense, and subscript “as” to antisense. In our minimal modeling approach, we did not implement more detailed Pol II transcription initiation dynamics, e.g., transcriptional bursting and/or pausing, backtracking, or arrest (37). Incorporating these processes in more detail would not alter our conclusions because our observations and model fits are population averages. We also do not include interference between sense and antisense transcription. Such an assumption is reasonable as transcriptional interference is incompatible with the observed positive correlation between sense and antisense RNA transcripts.
The analytical model has the following (a priori unknown) parameters: four initiation rates, Fs,Col, Fs,fca-9, Fas,Col, and Fas,fca-9; two elongation rates (not strand specific), vCol, vfca-9; the sense termination rate, kpA,s; the proximal antisense termination rate, kpA,prox; and the distal antisense termination rate, kpA,dist. The FLC locus is discretized with a grid size dx specified by the Pol II footprint LPII = 30 bp, with site number 0–208. In general, total Pol II levels at position x, PII(x), are a sum of sense and antisense transcribing Pol II levels. Below, we mostly drop the Col and fca-9 subscripts for brevity, although the initiation and elongation rates are genotype specific. Here, we also use our earlier theory for premature termination, but now applied to antisense proximal termination in a “window of opportunity” of 1 site (x = 186).
Straightforwardly generalizing from before, we find that at the antisense distal termination site, x = 0, the Pol II density is as follows:
Between the antisense distal termination site and the sense TSS, x = 1–3, we have the following:
At and between the sense TSS and the antisense proximal termination site, x = 4–186, we have the following:
Between the antisense proximal termination site and the sense termination site, x = 187–203, we have the following:
At the sense termination site, x = 204, we have the following:
Finally, beyond the sense termination site, x = 205–208, we have the following:
To allow direct comparison with our experimental data, we now perform the convolution procedure, as described previously, for both Col and fca-9. The shape of the convoluted Pol II profile across the gene can be compared with the experimental Pol II data in Fig. 1, whereas the ratio of convoluted Pol II levels can be directly compared with the experimental Pol II fold up-regulation (Fig. 2D).
As explained previously, spliced sense FLC mRNA up-regulation is determined by the ratio Fs,fca-9/Fs,Col. Hence, this ratio is used in the fit in Fig. 1A. To fit unspliced sense FLC, we note that the forward and reverse primers lie in intron2 and intron3, respectively. Thus, signal can only be picked up when intron2 and the majority of intron3 have already been transcribed. Due to the small sizes involved, we can take as a simple proxy for this species the transcripts that contain intron2. Hence, this approach effectively gives rise to unspliced sense FLC levels of F/ks. The fold up-regulation of unspliced RNA will then be (Fs,fca-9/ks)/(Fs,Col/ks) = Fs,fca-9/Fs,Col. For the distal antisense RNA, levels will be proportional to both the antisense initiation rate and to the fraction of antisense RNA for which the proximal pA site is not used, but will be inversely proportional to the distal antisense degradation rate. Assuming that the transcript lifetime does not change between genotypes, we find for the fold change:
Performing a similar analysis for the proximal antisense, we find the following:
From the literature (13), we fix the value of kpA,s = kpA,prox = 1/50 s−1. We then allowed kpA,distal to deviate at most fivefold from kpA,s.
Because Pol II levels are measured in our experiments as %input and are thus relative, absolute initiation rates cannot be directly inferred from Pol II ChIP using our analytical model. In our parameter-fitting methodology, we handled this issue as follows: we first set Fs,Col to 0.1 min−1 and determined other parameters relative to this arbitrary value. We then performed a parameter sweep for the following variables to see which values were able to fit the data: Fs,fca-9/Fs,Col, Fas,Col/Fs,Col, Fas,fca-9/Fas,Col, vCol, vfca-9/vCol, and kpA,distal/kpA,s. We also verified that our choice of Fs,Col = 0.1 min−1 was indeed arbitrary and that other choices led to the same results. The following criteria all needed to be met for a set of parameters to be considered as being able to fit the data:
log (Fs,fca-9/Fs,Col) within mean ± SEM of experimental log-fold change of spliced FLC levels;
log (Fold(proximal)) ≥ log (1.4) and log (Fold(proximal)) ≤ mean + SEM of experimental log-fold change of proximal antisense levels;
log (Fold(distal)) ≤ log (19) and log (Fold(distal)) ≥ mean – SEM of experimental log-fold change of distal antisense levels;
No 5′ Pol II peak observable in fca-9 despite frequent distal antisense termination: convoluted PIIfca-9 (x = 0)/PIIfca- 9 (x = 100) ≤ 1.1;
For comparison of gene body Pol II up-regulation, convoluted log (PIIfca-9 (x = 113)/PIICol (x = 113)) within mean ± SEM of experimental log-fold change of Pol II levels at corresponding primer (x = 113 × 30 = 3,390 bp from TSS) in Fig. 2D;
-
Limited 3′ Pol II fold change, where, using convoluted Pol II levels:
log (PIIfca-9 (x = 204)/PIICol (x = 204)) ≤ log (4.5);
log (PIIfca-9 (x = 204)/PIICol (x = 204)) ≥ mean – SEM of experimental log-fold up-regulation at corresponding primer.
Using this procedure, we found that parameters values within the following ranges could fit our data: Fs,fca-9/Fs,Col between 24 and 26, Fas,Col/Fs,Col between 2 and 5, Fas,fca-9/Fas,Col between 11 and 17, vCol between 0.2 and 0.4 kb⋅min−1, vfca-9/vCol between 8 and 12, and kpA,distal/kpA,s between 2 and 5.
Accordingly, using this methodology, after fixing kpA,s, the absolute elongation rate is determined (between 0.2 and 0.4 kb⋅min−1 for Col), as well as the fold change between fca-9 and Col (8- to 12-fold). However, we verified that coordination between the initiation and elongation rates is required to fit our data, irrespective of our choice of absolute rate values. Notably, this method also suggests that in Col the antisense initiates more frequently than the sense. The values used for the fits in the figures are as follows: Fs,fca-9/Fs,Col: 25, Fas,Col/Fs,Col: 4, Fas,fca-9/Fas,Col: 14, vCol: 0.3 kb/min, vfca-9/vCol: 10, kpA,distal/kpA,s: 5; resulting in Fold(proximal) = 1.5 and Fold(distal) = 15.6.
Using the above parameters, we then also predicted the intronic RNA profiles using only the additional experimentally constrained parameters: splicing rate ks = 1/Ts = 0.01 s−1 (Col, fca-9) or 0.02 s−1 (fld-4), and the lariat degradation rate ki = 1.5 bp/s. More details can be found in the main text. We also successfully tested in experiments the model prediction that the chromatin-bound RNA fold change at exon1 for fca-9 and fld-4 is significantly larger than the fold change at the exon1/intron1 junction (Fig. S4G), where we used the experimentally constrained RNA export rate kex = 1/Tex = 1.7 × 10⁻³ s−1 (13).
Last, we investigated what elongation rate changes between Col and fca-9 are consistent with the chromatin-bound RNA data independently of any prior knowledge of splicing and elongation rate values. First, note that Eq. S4 can be written as follows:
| [S6] |
Here we have replaced the elongation and splicing rates by two different variables: and . Note that , but not , is the variable that contains information about elongation rate fold changes between Col and fca-9. As the ratio Ffca-9/FCol is fixed by the spliced sense FLC mRNA up-regulation (see above), and are the only a priori unknowns in Eq. S6. We were therefore able to perform a nonlinear curve-fitting procedure to obtain estimates for these unknown parameters directly from the chromatin-bound RNA fold changes in fca-9 compared with Col. We log-transformed both the data and Eq. S6 so that the experimental SEM [value: SEM(x)] on the log-fold change could be used to assign the appropriate weight to each data point: weight(x) = 1/SEM2(x). With this weight function, our method is essentially a χ2 goodness-of-fit method that is commonly used to estimate parameters from data. Indeed, Eq. S6 can fit well (R2 = 0.89; F statistic: P ) to our experimental chromatin-bound RNA fold changes, with estimates for bp (mean ± SEM, P = ) and (P = ). This analysis shows independently of the Pol II data and any potential uncertainty in splicing rates, that to explain the chromatin-bound RNA up-regulation in fca-9, elongation rate changes of 6–14× are required. The procedure also gives an estimate for , where using ks = 0.01 s−1, we find vCol = 0.3 ± 0.1 kb/min. This result gives further confidence in our earlier estimate for .
Supplementary Material
Acknowledgments
We thank Hervé Vaucheret for providing xrn seeds and Robert Sablowski for comments on the manuscript. We thank C.D. and M.H. group members for discussions. This work was supported by BBSRC Grant BB/K007203/1 (to M.H. and C.D.); BBSRC Institute Strategic Program GRO (BB/J004588/1); and BBSRC studentship, VSBfonds Scholarship, and Prins Bernhard Cultuurfonds Scholarship (to R.I.).
Footnotes
The authors declare no conflict of interest.
This article contains supporting information online at www.pnas.org/lookup/suppl/doi:10.1073/pnas.1518369112/-/DCSupplemental.
References
- 1.Smolle M, Workman JL. Transcription-associated histone modifications and cryptic transcription. Biochim Biophys Acta. 2013;1829(1):84–97. doi: 10.1016/j.bbagrm.2012.08.008. [DOI] [PMC free article] [PubMed] [Google Scholar]
- 2.Selth LA, Sigurdsson S, Svejstrup JQ. Transcript elongation by RNA polymerase II. Annu Rev Biochem. 2010;79:271–293. doi: 10.1146/annurev.biochem.78.062807.091425. [DOI] [PubMed] [Google Scholar]
- 3.Sheldon CC, et al. The FLF MADS box gene: A repressor of flowering in Arabidopsis regulated by vernalization and methylation. Plant Cell. 1999;11(3):445–458. doi: 10.1105/tpc.11.3.445. [DOI] [PMC free article] [PubMed] [Google Scholar]
- 4.Michaels SD, Amasino RM. FLOWERING LOCUS C encodes a novel MADS domain protein that acts as a repressor of flowering. Plant Cell. 1999;11(5):949–956. doi: 10.1105/tpc.11.5.949. [DOI] [PMC free article] [PubMed] [Google Scholar]
- 5.Crevillén P, Dean C. Regulation of the floral repressor gene FLC: The complexity of transcription in a chromatin context. Curr Opin Plant Biol. 2011;14(1):38–44. doi: 10.1016/j.pbi.2010.08.015. [DOI] [PubMed] [Google Scholar]
- 6.Liu F, Marquardt S, Lister C, Swiezewski S, Dean C. Targeted 3′ processing of antisense transcripts triggers Arabidopsis FLC chromatin silencing. Science. 2010;327(5961):94–97. doi: 10.1126/science.1180278. [DOI] [PubMed] [Google Scholar]
- 7.Hornyik C, Terzi LC, Simpson GG. The spen family protein FPA controls alternative cleavage and polyadenylation of RNA. Dev Cell. 2010;18(2):203–213. doi: 10.1016/j.devcel.2009.12.009. [DOI] [PubMed] [Google Scholar]
- 8.Ietswaart R, Wu Z, Dean C. Flowering time control: Another window to the connection between antisense RNA and chromatin. Trends Genet. 2012;28(9):445–453. doi: 10.1016/j.tig.2012.06.002. [DOI] [PubMed] [Google Scholar]
- 9.Liu F, et al. The Arabidopsis RNA-binding protein FCA requires a lysine-specific demethylase 1 homolog to downregulate FLC. Mol Cell. 2007;28(3):398–407. doi: 10.1016/j.molcel.2007.10.018. [DOI] [PubMed] [Google Scholar]
- 10.Marquardt S, et al. Functional consequences of splicing of the antisense transcript COOLAIR on FLC transcription. Mol Cell. 2014;54(1):156–165. doi: 10.1016/j.molcel.2014.03.026. [DOI] [PMC free article] [PubMed] [Google Scholar]
- 11.Wang ZW, Wu Z, Raitskin O, Sun Q, Dean C. Antisense-mediated FLC transcriptional repression requires the P-TEFb transcription elongation factor. Proc Natl Acad Sci USA. 2014;111(20):7468–7473. doi: 10.1073/pnas.1406635111. [DOI] [PMC free article] [PubMed] [Google Scholar]
- 12.Ehrensberger AH, Kelly GP, Svejstrup JQ. Mechanistic interpretation of promoter-proximal peaks and RNAPII density maps. Cell. 2013;154(4):713–715. doi: 10.1016/j.cell.2013.07.032. [DOI] [PubMed] [Google Scholar]
- 13.Brody Y, et al. The in vivo kinetics of RNA polymerase II elongation during co-transcriptional splicing. PLoS Biol. 2011;9(1):e1000573. doi: 10.1371/journal.pbio.1000573. [DOI] [PMC free article] [PubMed] [Google Scholar]
- 14.Danko CG, et al. Signaling pathways differentially affect RNA polymerase II initiation, pausing, and elongation rate in cells. Mol Cell. 2013;50(2):212–222. doi: 10.1016/j.molcel.2013.02.015. [DOI] [PMC free article] [PubMed] [Google Scholar]
- 15.Fuchs G, et al. 4sUDRB-seq: Measuring genomewide transcriptional elongation rates and initiation frequencies within cells. Genome Biol. 2014;15(5):R69. doi: 10.1186/gb-2014-15-5-r69. [DOI] [PMC free article] [PubMed] [Google Scholar]
- 16.Singh J, Padgett RA. Rates of in situ transcription and splicing in large human genes. Nat Struct Mol Biol. 2009;16(11):1128–1133. doi: 10.1038/nsmb.1666. [DOI] [PMC free article] [PubMed] [Google Scholar]
- 17.Bentley DL. Coupling mRNA processing with transcription in time and space. Nat Rev Genet. 2014;15(3):163–175. doi: 10.1038/nrg3662. [DOI] [PMC free article] [PubMed] [Google Scholar]
- 18.Ameur A, et al. Total RNA sequencing reveals nascent transcription and widespread co-transcriptional splicing in the human brain. Nat Struct Mol Biol. 2011;18(12):1435–1440. doi: 10.1038/nsmb.2143. [DOI] [PubMed] [Google Scholar]
- 19.Hesselberth JR. Lives that introns lead after splicing. Wiley Interdiscip Rev RNA. 2013;4(6):677–691. doi: 10.1002/wrna.1187. [DOI] [PubMed] [Google Scholar]
- 20.Mason PB, Struhl K. Distinction and relationship between elongation rate and processivity of RNA polymerase II in vivo. Mol Cell. 2005;17(6):831–840. doi: 10.1016/j.molcel.2005.02.017. [DOI] [PubMed] [Google Scholar]
- 21.Hazelbaker DZ, Marquardt S, Wlotzka W, Buratowski S. Kinetic competition between RNA polymerase II and Sen1-dependent transcription termination. Mol Cell. 2013;49(1):55–66. doi: 10.1016/j.molcel.2012.10.014. [DOI] [PMC free article] [PubMed] [Google Scholar]
- 22.Cheng Y, Kato N, Wang W, Li J, Chen X. Two RNA binding proteins, HEN4 and HUA1, act in the processing of AGAMOUS pre-mRNA in Arabidopsis thaliana. Dev Cell. 2003;4(1):53–66. doi: 10.1016/s1534-5807(02)00399-4. [DOI] [PMC free article] [PubMed] [Google Scholar]
- 23.Brannan K, et al. mRNA decapping factors and the exonuclease Xrn2 function in widespread premature termination of RNA polymerase II transcription. Mol Cell. 2012;46(3):311–324. doi: 10.1016/j.molcel.2012.03.006. [DOI] [PMC free article] [PubMed] [Google Scholar]
- 24.Jimeno-González S, Haaning LL, Malagon F, Jensen TH. The yeast 5′-3′ exonuclease Rat1p functions during transcription elongation by RNA polymerase II. Mol Cell. 2010;37(4):580–587. doi: 10.1016/j.molcel.2010.01.019. [DOI] [PubMed] [Google Scholar]
- 25.Gy I, et al. Arabidopsis FIERY1, XRN2, and XRN3 are endogenous RNA silencing suppressors. Plant Cell. 2007;19(11):3451–3461. doi: 10.1105/tpc.107.055319. [DOI] [PMC free article] [PubMed] [Google Scholar]
- 26.Ko JH, et al. Growth habit determination by the balance of histone methylation activities in Arabidopsis. EMBO J. 2010;29(18):3208–3215. doi: 10.1038/emboj.2010.198. [DOI] [PMC free article] [PubMed] [Google Scholar]
- 27.Kim SY, et al. Establishment of the vernalization-responsive, winter-annual habit in Arabidopsis requires a putative histone H3 methyl transferase. Plant Cell. 2005;17(12):3301–3310. doi: 10.1105/tpc.105.034645. [DOI] [PMC free article] [PubMed] [Google Scholar]
- 28.Yang H, Howard M, Dean C. Antagonistic roles for H3K36me3 and H3K27me3 in the cold-induced epigenetic switch at Arabidopsis FLC. Curr Biol. 2014;24(15):1793–1797. doi: 10.1016/j.cub.2014.06.047. [DOI] [PMC free article] [PubMed] [Google Scholar]
- 29.Mayer A, et al. Uniform transitions of the general RNA polymerase II transcription complex. Nat Struct Mol Biol. 2010;17(10):1272–1278. doi: 10.1038/nsmb.1903. [DOI] [PubMed] [Google Scholar]
- 30.Epshtein V, Nudler E. Cooperation between RNA polymerase molecules in transcription elongation. Science. 2003;300(5620):801–805. doi: 10.1126/science.1083219. [DOI] [PubMed] [Google Scholar]
- 31.Jonkers I, Kwak H, Lis JT. Genome-wide dynamics of Pol II elongation and its interplay with promoter proximal pausing, chromatin, and exons. eLife. 2014;3:e02407. doi: 10.7554/eLife.02407. [DOI] [PMC free article] [PubMed] [Google Scholar]
- 32.Weber CM, Ramachandran S, Henikoff S. Nucleosomes are context-specific, H2A.Z-modulated barriers to RNA polymerase. Mol Cell. 2014;53(5):819–830. doi: 10.1016/j.molcel.2014.02.014. [DOI] [PubMed] [Google Scholar]
- 33.Van Lijsebettens M, Grasser KD. Transcript elongation factors: Shaping transcriptomes after transcript initiation. Trends Plant Sci. 2014;19(11):717–726. doi: 10.1016/j.tplants.2014.07.002. [DOI] [PubMed] [Google Scholar]
- 34.Dolata J, et al. NTR1 is required for transcription elongation checkpoints at alternative exons in Arabidopsis. EMBO J. 2015;34(4):544–558. doi: 10.15252/embj.201489478. [DOI] [PMC free article] [PubMed] [Google Scholar]
- 35.Lolas IB, et al. The transcript elongation factor FACT affects Arabidopsis vegetative and reproductive development and genetically interacts with HUB1/2. Plant J. 2010;61(4):686–697. doi: 10.1111/j.1365-313X.2009.04096.x. [DOI] [PubMed] [Google Scholar]
- 36.Core LJ, et al. Defining the status of RNA polymerase at promoters. Cell Reports. 2012;2(4):1025–1035. doi: 10.1016/j.celrep.2012.08.034. [DOI] [PMC free article] [PubMed] [Google Scholar]
- 37.Churchman LS, Weissman JS. Nascent transcript sequencing visualizes transcription at nucleotide resolution. Nature. 2011;469(7330):368–373. doi: 10.1038/nature09652. [DOI] [PMC free article] [PubMed] [Google Scholar]
- 38.Hobson DJ, Wei W, Steinmetz LM, Svejstrup JQ. RNA polymerase II collision interrupts convergent transcription. Mol Cell. 2012;48(3):365–374. doi: 10.1016/j.molcel.2012.08.027. [DOI] [PMC free article] [PubMed] [Google Scholar]
- 39.Saponaro M, et al. RECQL5 controls transcript elongation and suppresses genome instability associated with transcription stress. Cell. 2014;157(5):1037–1049. doi: 10.1016/j.cell.2014.03.048. [DOI] [PMC free article] [PubMed] [Google Scholar]
- 40.Wuarin J, Schibler U. Physical isolation of nascent RNA chains transcribed by RNA polymerase II: Evidence for cotranscriptional splicing. Mol Cell Biol. 1994;14(11):7219–7225. doi: 10.1128/mcb.14.11.7219. [DOI] [PMC free article] [PubMed] [Google Scholar]
- 41.Almada AE, Wu X, Kriz AJ, Burge CB, Sharp PA. Promoter directionality is controlled by U1 snRNP and polyadenylation signals. Nature. 2013;499(7458):360–363. doi: 10.1038/nature12349. [DOI] [PMC free article] [PubMed] [Google Scholar]
- 42.Tippmann SC, et al. Chromatin measurements reveal contributions of synthesis and decay to steady-state mRNA levels. Mol Syst Biol. 2012;8:593. doi: 10.1038/msb.2012.23. [DOI] [PMC free article] [PubMed] [Google Scholar]
- 43.Gray JM, et al. SnapShot-Seq: A method for extracting genome-wide, in vivo mRNA dynamics from a single total RNA sample. PLoS One. 2014;9(2):e89673. doi: 10.1371/journal.pone.0089673. [DOI] [PMC free article] [PubMed] [Google Scholar]
Associated Data
This section collects any data citations, data availability statements, or supplementary materials included in this article.


