Significance
The sporadic acquisition of somatic DNA mutation confers a hereditary label that can be used to trace the fate behavior of cells in normal and diseased states. Applied to human tumor samples, DNA deep sequencing methods have revealed the landscape of somatic mutations and have identified a repertoire of genes implicated in cancer. By adapting statistical methods used to analyze lineage tracing data in transgenic animal models, we use the example of epidermis to show how deep sequencing data can provide quantitative insight into the self-renewal properties of normal human tissues and can serve as a platform to define rare nonneutral field transformations.
Keywords: stem cells, DNA sequencing, epidermis, cancer
Abstract
Using deep sequencing technology, methods based on the sporadic acquisition of somatic DNA mutations in human tissues have been used to trace the clonal evolution of progenitor cells in diseased states. However, the potential of these approaches to explore cell fate behavior of normal tissues and the initiation of preneoplasia remain underexploited. Focusing on the results of a recent deep sequencing study of eyelid epidermis, we show that the quantitative analysis of mutant clone size provides a general method to resolve the pattern of normal stem cell fate and to detect and characterize the mutational signature of rare field transformations in human tissues, with implications for the early detection of preneoplasia.
Advances in genetic lineage tracing in transgenic animal models have provided important insights into the proliferative potential and fate behavior of stem and progenitor cell populations in normal tissues (1, 2). As well as providing constraints on the mechanisms that regulate stem cell self-renewal, these approaches have established a quantitative framework to address tumor initiation and progression (3–6). However, studies based on the clonal activation of oncogenes in animal models can fail to recapitulate the natural processes that lead to neoplasia in human tissues. In recent years, there has been increasing emphasis on the characterization of cancer genomes in human tissues and their potential to elucidate the pathways involved in tumor progression (7–14). Although these studies have revealed a range of cancer genes (15), the heterogeneity and evolutionary diversity of the tumor environment make the separation of driver and passenger mutations challenging.
Against the trend to focus on human tumor samples, a recent study has used ultradeep exome sequencing to determine the mutational profile of normal human eyelid epidermis (16). In the course of DNA replication, all dividing cells are subject to random SNPs. If the mutation rate is sufficiently low that their acquisition at a given locus in a cell subpopulation is typically associated with a single event, they confer a potentially unique hereditary label on cells, allowing the fate of their progeny to be traced over time. By resolving the mutant allele fraction in a biopsy using deep sequencing, the relative size of mutant clones can be inferred. A similar approach based on the spontaneous acquisition of mitochondrial DNA mutation has been used to address progenitor cell fate in human airways and intestinal epithelia (17, 18). To assess the selective growth advantage of different mutations in normal epidermis, Martincorena et al. (16) compared the dN/dS ratio and average size of clones derived from mutations in genes associated with cancer drivers with those associated with synonymous mutations in nondriver genes. Their analysis showed a significant increase in the abundance and average size of clones that bear mutations in NOTCH1 and tumor protein p53 (TP53) compared with the ensemble of apparently neutral mutations, whereas mutations in other drivers such as FAT1, NOTCH2, and NOTCH3 were not significantly increased. Based on these findings, the study reached the striking conclusion that cancer genes are under strong positive selection, even in physiologically normal skin. However, paradoxically, despite the apparent survival advantage, average clone sizes even in TP53 mutant clones were only a modest factor of two larger that the ensemble average, suggesting that the degree of clonal dominance may be limited.
At first sight, one might expect that the relative abundance of gene-specific point mutations could reveal whether they confer a selective survival advantage. However, although variations in the observed frequency of SNPs will arise from the positive/negative selection of somatic mutations, they may also be intrinsic (germ-line-derived), making their functional significance at different sites difficult to assess (19, 20) (Fig. S1). Equally, the value of average mutant clone sizes is diminished by their sensitivity to tails of the size distribution, which can be compromised by the resolution limit of sequencing or statistical fluctuations due to rare events. Similar effects may compromise the dN/dS ratio, a measure of the relative abundance of nonsynonymous to synonymous mutations (21). However, by analyzing the full probability distribution of mutant clone sizes, and drawing upon knowledge of adult stem cell self-renewal strategies (1, 22), we show that quantitative insights can be gained into the dynamics and fate behavior of mutant clones, providing access to both the normal state properties of tissue-maintaining cells and their dynamics following premalignant transformation. In doing so, we offer a different perspective on the deep sequencing study of Martincorena et al. (16).
Fig. S1.
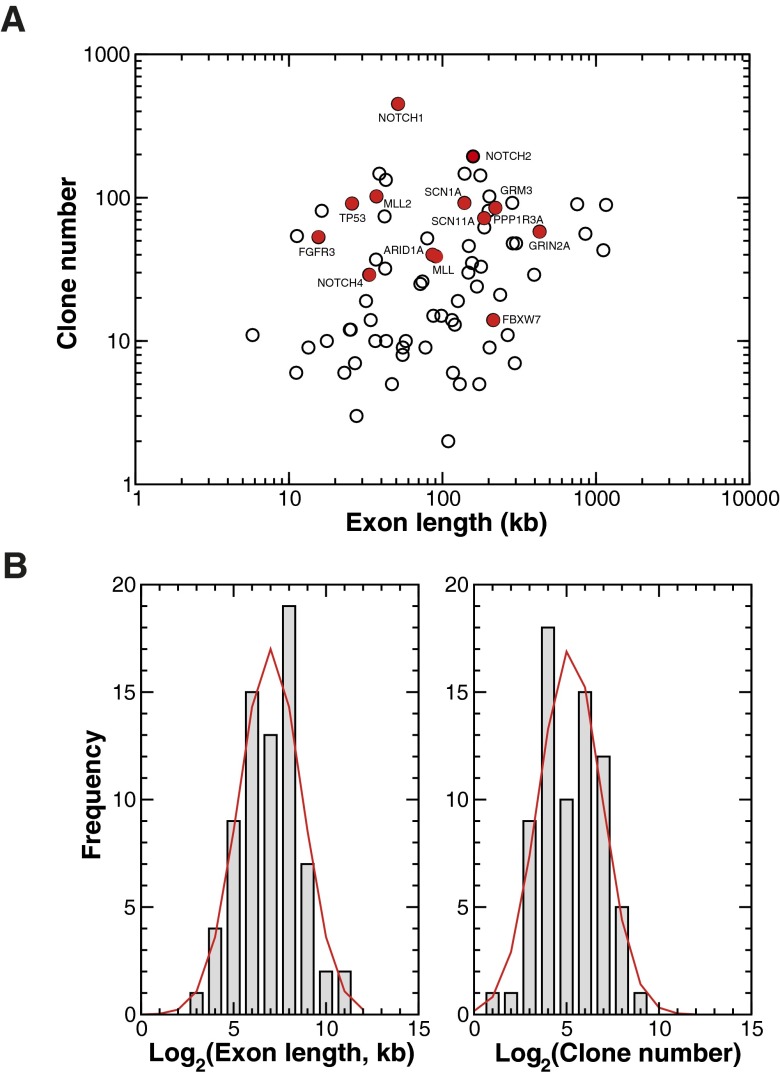
Abundance of gene-specific mutant clones. (A) Scatter plot of the exome length in the genome against the total number of mutant clones associated with that exome (coverage obtained from AceView, National Center for Biotechnology Information). The points show all genes considered in the deep sequencing study of Martincorena et al. (16). In particular, we have picked out the abundance of specific genes that emerge as outliers from the otherwise neutral size distribution of mutant clones, as discussed in the main text. The results reveal no obvious correlation of exome length with clone number, emphasizing the degree of intrinsic variation of the mutation rate along the genome. (B, Left) In common with previous studies of translated exons (40), the distribution of sequenced exon lengths (bars) is consistent with a log-normal distribution, centered on bp with a width (red line). (Right) Although there is no obvious correlation between exon length and mutant clone abundance, the corresponding distribution of mutant clone number for the chosen exons is also broadly consistent with a log-normal distribution centerd on bp with the same width, σ.
Deep Sequencing As a Clonal Marker in Human Epidermis
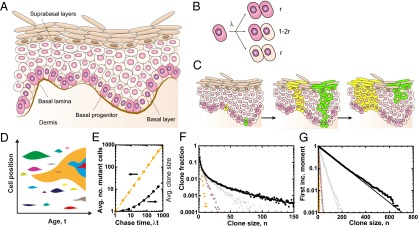
In mammals, skin is composed of a multilayered sheet of keratinocytes interspersed with hair follicles, sebaceous glands, and sweat glands (23). Lineage tracing studies using transgenic mouse models have revealed a surprising degree of compartmentalization, with the turnover of hair follicle, sebaceous gland, and interfollicular epidermis (IFE) maintained by independent stem-cell populations (24). In IFE, proliferation is confined to cells in the basal layer that adhere to an underlying basement membrane (Fig. 1A). On commitment to terminal differentiation, basal cells detach from the basement membrane and transfer into the suprabasal layers before reaching the epidermal surface from which they are shed. In homeostasis, the progenitors that maintain IFE must undergo asymmetric self-renewal so that, following division, on average one cell remains in the self-renewing compartment, whereas the other commits to differentiation either directly or via a transit compartment with strictly limited proliferative potential. Such asymmetry may be invariant, enforced at the level of each and every cell division, or it may be achieved only at the level of the progenitor population (SI Text).
Fig. 1.
Dynamics of clones in mammalian IFE. (A) Schematic depicting the cellular organization of human IFE. (B) In the paradigm of population asymmetry, IFE is maintained by basal progenitors that, following division, choose stochastically between symmetric and asymmetric fate with the probability of symmetric proliferation, , perfectly balanced by terminal division. (C) When lineage-labeled, the clonal progeny of marked progenitors may expand through the replacement of neighbors (yellow clone) or may become lost through differentiation (green clone). (D) Following the chance acquisition of somatic mutation, clones (with colors denoting different SNPs) compete for survival. Over time, some clones become lost through differentiation whereas others expand. Clones that bear one mutation may acquire further mutations. (E) According to the model depicted in B, the average size of mutant clones (orange line) is predicted to increase as , where ω denotes the mutation rate per progenitor at a given locus, N is the size of the progenitor pool, and t is the age of the patient. The average mutant clone size is predicted to increase as (black line). (F) The corresponding mutant clone size distribution, , and (G) first incomplete moment, , predicted by Eqs. 1 and 2, respectively (black lines). In E–G points show the results of stochastic simulation of the birth–death process depicted in B, where, in F and G, (orange), (brown), (gray), and (black) with and .
Beginning with the work of Mackenzie (25) and Potten et al. (26), early studies of IFE maintenance in mouse placed emphasis on a stem/transit-amplifying cell paradigm in which long-lived slow-cycling stem cells give rise to short-lived progenitors that undergo a limited series of symmetric division before terminal differentiation. Later, quantitative lineage tracing studies based on inducible genetic labeling revealed that murine epidermal maintenance relies instead upon the turnover of a basal progenitor pool that conforms to a process of “population asymmetry” in which their stochastic loss through terminal division is perfectly compensated by the duplication of neighbors (27–30) (Fig. 1B). Whether the repair of murine epidermis involves a transient adjustment in the fate behavior of the progenitor pool or is engineered by the activity of a second quiescent “reserve” stem cell population remains the subject of debate. In human, in vitro colony-forming assays, as well as transplantation and marker-based studies, point at engrained proliferative heterogeneity in the basal layer of IFE (31–34). However, in the absence of in vivo lineage tracing assays, the nature of stem cell self-renewal and tissue maintenance remains in question.
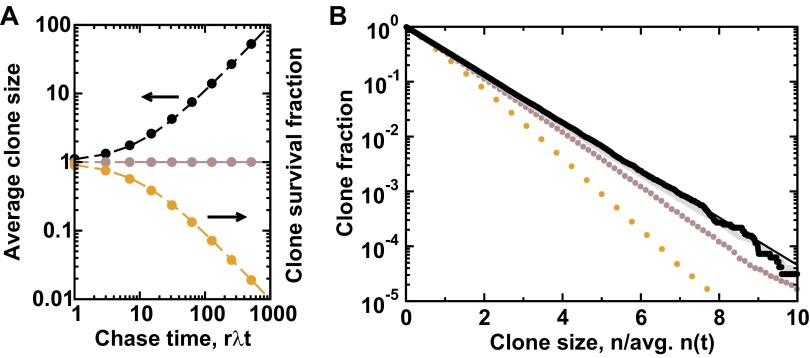
The resolution of cell fate behavior in mouse IFE relied upon the observation of “scaling” behavior of the clone size distribution following genetic pulse labeling (27–30, 35). According to their stochastic fate behavior (Fig. 1B), as progenitors compete neutrally for survival the density of clones (number per unit area) progressively diminishes, whereas the average size of surviving clones steadily increases (linearly with time) so that the overall number of marked cells remains constant over time (SI Text, Fig. 1C, and Fig. S2). However, despite their continual increase in size, the chance of finding a surviving clone larger than some multiple of the average remains constant and defined by an exponential distribution (Fig. S2). Combined with the overall conservation of labeled cell number, this phenomenon of scaling provides a robust, parameter-free signature of neutral cell competition and equipotency of the tissue-maintaining population (35). Although the exponential size dependence is particular to epithelial (and volumnar) tissues, the phenomenon of scaling applies generically to all cycling adult tissues supported by population asymmetry (SI Text). As a result, the same general approach has been used successfully to explore stem cell fate behavior in other tissues and organisms (1).
Fig. S2.
Neutral dynamics and scaling of the clone size distribution. (A) According to the paradigm of balanced stochastic fate choice (Fig. 1B), following pulse labeling, the average clone size (progenitor number) is predicted to increase as (black line, SI Text), while the clone survival probability falls as (orange line), so that the overall average number of labeled progenitors per clone (brown line) remains constant at unity. (B) The corresponding cumulative clone size distribution converges onto an exponential dependence, a manifestation of scaling behavior (black line, SI Text). Points in A and B represent the results of stochastic simulation of the corresponding critical birth-death process, with chase times in B of (orange), (brown), (gray), and with (black).
In contrast to genetic labeling approaches, where the induction frequency can be controlled through the dose dependence of the drug-inducing agent, clonal marking by somatic mutation involves a sequence of sporadic events masking the age of individual clones (Fig. 1D). Fortunately, under conditions of neutral competition, quantitative information on the fate behavior of the self-renewing population can still be recovered. In particular, if the pattern of stochastic progenitor cell fate observed in mouse IFE (Fig. 1B) were extrapolated to human, then, following the continual “induction” of clonally marked cells through the acquisition of somatic mutation, the probability of finding a mutant clone with progenitors in a biopsy of a patient of age t would be independent of the (presumed unchanging) mutation rate and given by (17):
| [1] |
where λ represents the division rate and denotes the loss/replacement rate of basal progenitors (Fig. 1 B, E, and F and SI Text). The “featureless” divergence of the distribution at small clone sizes is simply a manifestation of neutral dynamics that results in the largest fraction of surviving clones at any instant being ones that were “induced” in the recent past (Fig. 1D).
If rates of somatic mutation are sufficiently high, SNPs may arise independently at the same locus in different cells. Because estimates of mutant clone size using deep sequencing are based on measurements of the variable allele fraction (VAF), the multiplicity of induction events cannot be resolved. Fortunately, would such clone “merger” events occur, they would be signaled by a breakdown of the leading dependence, allowing their existence to be inferred indirectly (SI Text). However, while , where N denotes the number of progenitors in a given biopsy and ω is the mutation rate associated with the given locus, the frequency of mutant clones derived from multiple induction events can be safely neglected (SI Text). To proceed, we will assume that this condition is met and look for consistency of the data with theory.
Although Eq. 1 provides a strong prediction with which to address deep sequencing data, the nonlinear dependence of on clone size, n, makes comparison between experiment and theory cumbersome. Fortunately, a further straightforward manipulation of the size distribution provides a more convenient representation. Specifically, defining the average mutant clone size, , it follows that the “first incomplete moment” (36),
| [2] |
acquires a simple exponential dependence on clone size, n, with a decay constant , equivalent to the average size of a surviving clone induced at birth (i.e., at the time of the first exposure to mutation) (Fig. 1 E–G and SI Text). Moreover, by the nature of its definition, the first incomplete moment is conveniently insensitive to the smallest clones, where the resolution of the deep sequencing approach is likely to be compromised. In the context of epidermis, it therefore follows that the corresponding distribution of clone areas, A, is given by , with ρ the areal progenitor density.
Eq. 2 provides an objective, parameter-free prediction with which population asymmetry and neutrality of clone dynamics can be assessed. For a given array of biopsies, mutant clone sizes can be inferred from the corresponding VAFs associated with individual SNPs. Then the first incomplete moment, , can be constructed directly from the data. Departure of the inferred distribution from the predicted exponential size dependence would indicate functional heterogeneity of mutant clones and evidence of nonneutral dynamics. Convergence onto exponential would indicate that clone dynamics is likely governed by the neutral competition of an equipotent progenitor pool. A fit to the exponent, , then provides access to the progenitor loss/replacement rate. Crucially, the exponential size dependence of is sensitive only to the dynamics of the self-renewing (i.e., the active stem cell) population. As long as the dominant contribution to the measured mutant clone size distribution derives from clones associated with mutations that occurred on timescales in excess of the transit time through any differentiation hierarchy, the exponential size dependence would be conserved.
Neutral Competition Between Keratinocyte Progenitors
In the study of Martincorena et al. (16), eyelid epidermis was derived from more than 200 biopsies of sizes ranging from 0.79 to harvested from four patients aged 55–73 y of age. In each case, coding exons were sequenced across 74 genes implicated in skin and other cancers to an average effective coverage of (Dataset S1). (For technical details on the sample preparation and sequencing approach refer to ref. 16.) As detailed in the study, because few mutations involve change in copy number, the areal contribution of individual mutant clones can be inferred as twice the product of the VAF with the area of the biopsy. (Events involving the mutation of both alleles at a given locus are considered to occur at a negligible frequency.) For clones of a size much smaller than that of the biopsy, intersection of the clone with the boundary is statistically improbable. For larger clone sizes, the estimated clonal area in a given biopsy may represent only a fraction of the true size. However, the exponential character of the predicted first complete moment is robust to such statistical fluctuations as well as errors in the accuracy of the sequencing approach (SI Text).
To gain insight into the relative abundance of clones that “spill” outside individual biopsies, because the mutation rate is low (16) we can explore the coincidence of common point mutations found in different biopsies. Taking as an exemplar patient PD18003, for which the largest volume of data was obtained, we find that, from 1,557 specific point mutations across 92 biopsies, some 102 (6.6%) are present in more than one biopsy. Of these, 90 point mutations are restricted to two biopsies, 10 span three, 1 spans four, and 1 spans five. Similar frequencies of clone dispersion are found for the three other patients (Table 1), with one clone spanning no fewer than 12 biopsies.
Table 1.
Frequency of point mutations shared by multiple biopsies
| Patient ID | No. of biopsies* | |||||||
| 1 | 2 | 3 | 4 | 5 | 6 | 7 | 12 | |
| PD13634 | 647 | 63 | 7 | 4 | 3 | 1 | ||
| PD18003 | 1,338 | 90 | 10 | 1 | 1 | |||
| PD20399 | 724 | 64 | 10 | 1 | 3 | 1 | ||
| PD21910 | 181 | 14 | ||||||
Multiplicity of point mutations that span multiple biopsies. For example, in patient PD13634, 647 point mutations are found in only one biopsy, 63 are found in two biopsies, and so on.
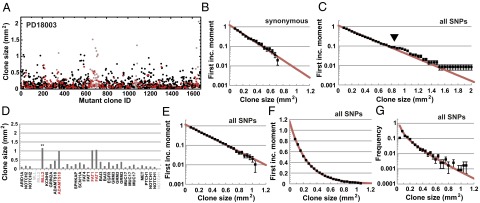
Because the total area of clones that occupy multiple biopsies cannot be reliably recovered, we first focused on the ensemble of clones that bear a point mutation contained within a single biopsy. Further, to assess the utility of the approach, we began by focusing on the subset of these clones that involve only synonymous mutation (Fig. 2A and Fig. S3). Because such mutations leave the associated protein sequence unchanged, it is expected that the dynamics of the corresponding clones remains neutral, providing a useful control to benchmark theory. Focusing on patient PD18003, for which there were a total of 257 synonymous point mutations restricted to a single biopsy, analysis of the first incomplete moment, , reveals a remarkably exponential size dependence (Fig. 2B), consistent with neutral competition of the constituent progenitors. As well as justifying the validity of the approach, this result establishes that, under conditions of normal homeostasis, the progenitors that maintain adult human IFE conform long-term to population asymmetric self-renewal.
Fig. 2.
Size distribution of mutant clones provides evidence of neutral dynamics. (A) Mutant clone sizes inferred from the analysis of the variable allele fractions of all (n = 1,557) point mutations for patient PD18003 (black points). Synonymous mutations are marked as red, and mutations belonging to the six biopsies considered outliers by size are shown in brown. (B) First incomplete moment, , associated with n = 257 synonymous mutations that belong to single biopsies (points) shows collapse onto the predicted exponential size dependence (Eq. 2, red line and Table 2). (C) First incomplete moment associated with all (n = 1,338) point mutations that belong to single biopsies. The departure of (arrowhead) from exponential (red line) reflects contributions from seven mutant clones contained within six biopsies. (D) Clone sizes of one biopsy showing one of the outliers associated with mutation in MLL2 (**). Note that three other point mutations have clone sizes comparable to this outlier, suggesting that they belong to the same subclone. Nonpoint mutations are indicated as gray. When the six biopsies are excluded from the statistical ensemble, the distribution (points) shown in E and F collapses onto the predicted exponential form (red line and Table 2). (G) The corresponding clone size distribution, , with points (black) showing data and the line (red) showing the theoretical prediction of Eq. 1. The departure of theory from experiment at clone sizes of and below indicates the resolution limit of the sequencing approach. With a basal cell density of 10,000 cells per mm2, this suggests that a resolution limit of around 500 basal cells. Error bars denote SEM.
Fig. S3.
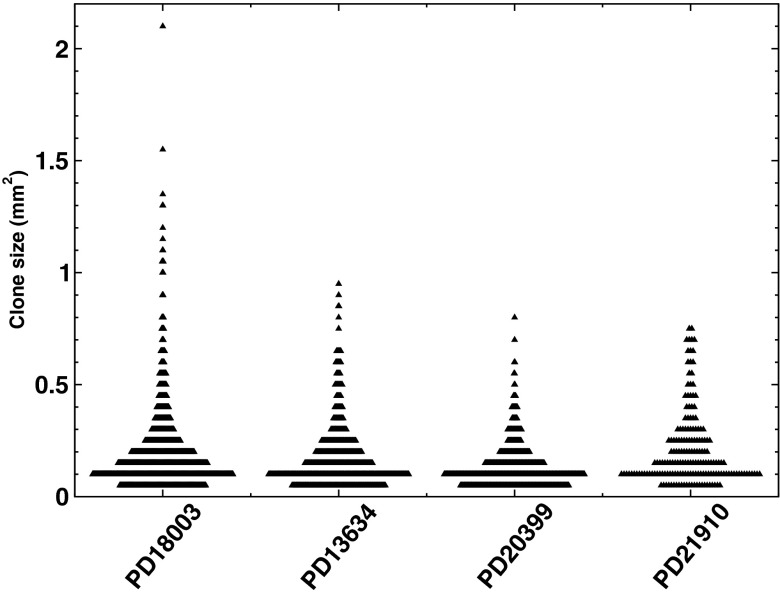
Distribution of mutant clone sizes. Sizes of the , 725, 803, and 195 clones associated with (synonymous and nonsynonymous) point mutations that are contained within single biopsies for, respectively, patients PD18003, PD13634, PD20399, and PD21910 before filtering.
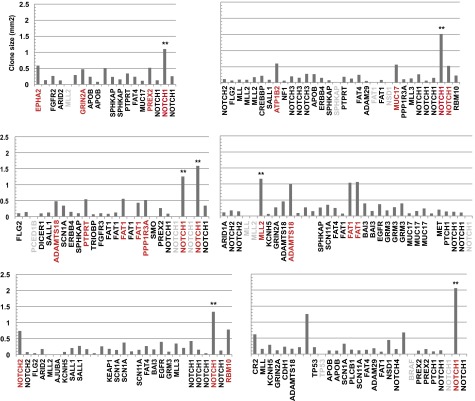
With the size distribution of clones associated with synonymous mutations defined, we then considered the wider class of mutant clones including both synonymous and nonsynonymous (missense and nonsense) mutations. Once again, taking the 1,338 clones associated with a single point mutation, the size distribution, , shows only a small departure from exponential with the divergence impacting at the largest clone sizes (Fig. 2C, arrowhead). By fitting the data to the exponential clone size dependence (red curve), we can then use the predicted cumulative frequency to estimate the point of departure of the statistical distribution. Given the size of the ensemble of clones, we find that the observation of the seven largest clones with a size in excess of , a significant fraction of the size of the associated biopsies, would be statistically improbable within the framework of neutral dynamics (i.e., these clones would be predicted to occur with a frequency much less than 1 in 1,000). Furthermore, inspection of the mutational profile of the six biopsies containing the seven clones (Fig. S4) shows that five biopsies are associated with different point mutations (missense or frameshift deletion) in NOTCH1, whereas the sixth involves a missense mutation in MLL2. For the latter, three other mutations appear with a very similar VAF to MLL2 (Fig. 2D), suggesting that all four mutations belong to the same clone. Significantly, when these six biopsies are filtered out of the statistical cohort of 92, the first incomplete moment collapses onto a strikingly exponential size dependence (Fig. 2 E and F). The coincidence of theory and experiment is further emphasized by comparison of the clone size distribution, , with the predicted size dependence (Fig. 2G).
Fig. S4.
Mutational profile of biopsies containing outlier clones in patient PD18003. Mutational profile of the seven mutant clones (denoted by **) in patient PD18003 considered as outliers by size and contained within six biopsies with the specific mutant genes marked in red. Large mutant clones with similar sizes (also marked in red) are likely to represent subclones of the outlier mutant clone. Nonpoint mutations are marked in gray.
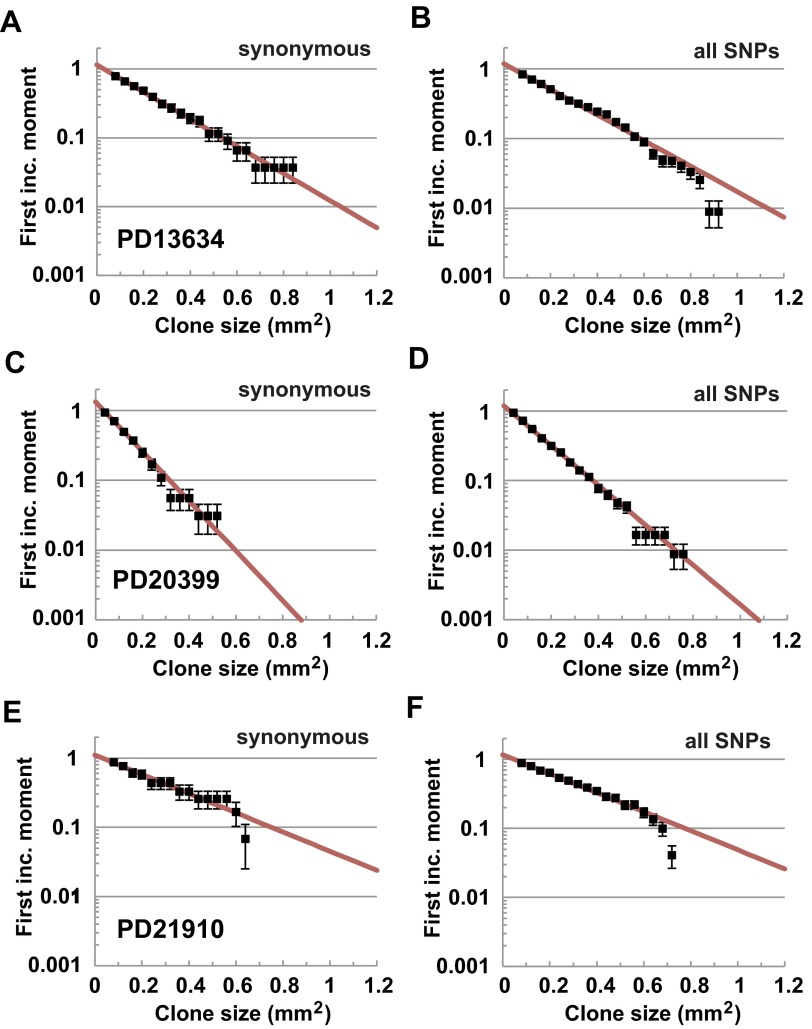
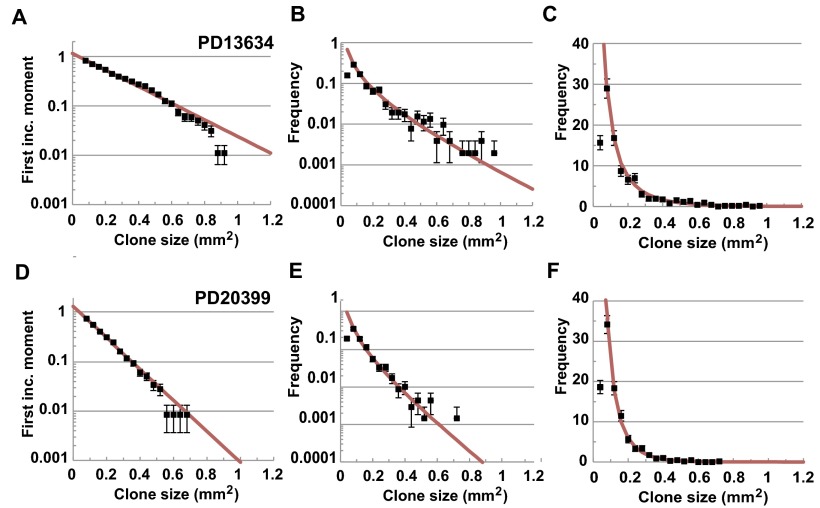
Turning to patient PD13634, of the 725 discrete point mutations, 657 (89%) belong to a single biopsy with 159 of these associated with synonymous point mutations. Once again, their size distribution shows collapse onto an exponential dependence, consistent with neutral dynamics (Fig. S5A). Then, when combined with nonsynonymous mutations, the size distribution of all 657 mutant clones continues to collapse onto exponential with no apparent outliers by size (Figs. S2 and S5B). For patient PD20399, of the 803 discrete point mutations, 724 (90%) belong to a single biopsy. In this case, the size distribution of all 724 point mutations as well as the 154 mutant clones that bear a synonymous mutation also collapse onto exponential with no outliers by size (Figs. S2 and S5 C and D). Finally, for patient PD21910, although the data are relatively sparse, of the 195 discrete mutations, 181 (93%) belong to a single biopsy. With just 35 of these mutant clones bearing a synonymous point mutation, the size distribution is noisy but consistent with exponential (Fig. S5E). Again, as expected, comparison of all 181 mutations also reveals a collapse onto exponential with no outliers (Figs. S2 and S5F).
Fig. S5.
Neutral progenitor cell dynamics is conserved across patients. First incomplete moment, , associated with , 154, and 25 synonymous mutations that belong to single biopsies (points) of, respectively, patients (A) PD13634, (C) PD20399, and (E) PD21910 show collapse onto the predicted exponential size dependence (Eq. 2, red line, and Table 2). First incomplete moment associated with all , 724, and 181 point mutations that belong to single biopsies (points) of, respectively, patients (B) PD13634, (D) PD20399, and (F) PD21910 also show collapse onto the predicted exponential size dependence (Eq. 2), red line, and Table 2). Error bars denote SEM.
Nonneutral Expansion of Rare Mutant Clones
Although these results suggest that the vast majority of point mutations leave neutral dynamics unperturbed, the statistical method also provides a quantitative scheme to identify mutant clones that lie outside the normal (exponential) size distribution. Our results suggest that very few are associated with nonneutral dynamics—in one patient (PD18003), just six outlier clones were identified by size, whereas none were found in the other patients (Fig. 2 and Fig. S5). However, so far, we have excluded from our analysis mutant clones that span multiple biopsies. Because these clones are likely to be large, one might expect that they harbor the majority of cells that have undergone nonneutral transformation. Therefore, to gain insight into the nature of these dispersive clones, we explored the mutational profile of clones that spanned more than three biopsies.
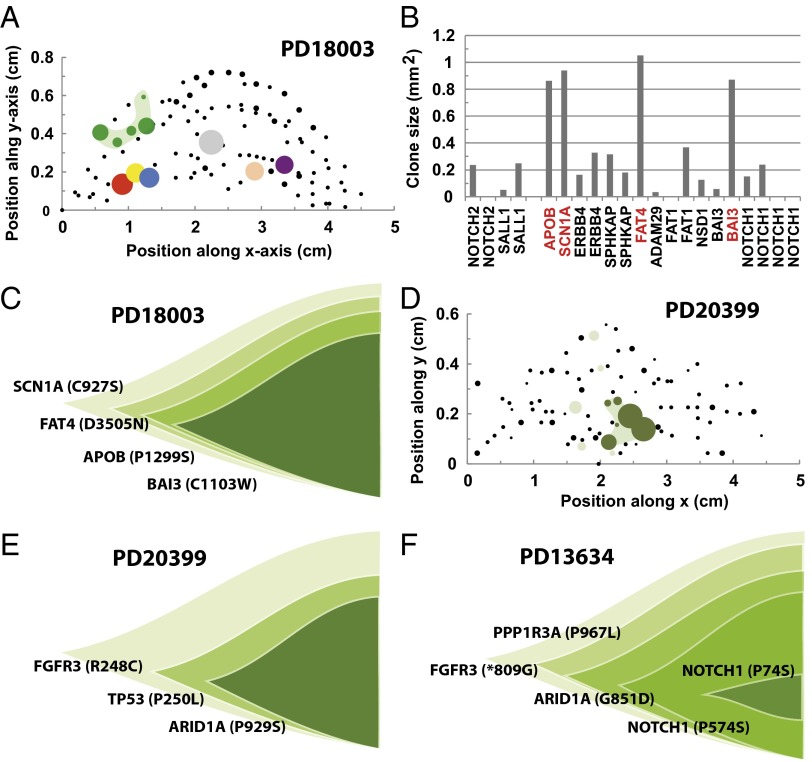
Starting with patient PD18003, only one mutant clone bearing a missense mutation in SCN1A (C927S) spans more than three biopsies (Table 1), having an aggregate size of , more than a factor of two larger than the cutoff used to filter single-biopsy clones. Whether this outlier represents the chance expansion of a clone governed by neutral dynamics or derives from the proliferative advantage of mutant cells over their wild-type neighbors—the process of “field cancerization” (37)—driven by mutation of SCN1A is impossible to determine unambiguously. However, noting that the vast majority of the clone is limited to just one biopsy in which the point mutation in SCN1A is expressed with a VAF similar to that of point mutations associated with three other genes (Fig. 3 A and B), it seems likely that expansion of this clone is driven by the chance acquisition of multiple point mutations. Indeed, by comparing the relative values of the VAFs, we can infer the likely order in which these point mutations were acquired (Fig. 3C).
Fig. 3.
Field transformation and nonneutral clone dynamics driven by multiple mutations. (A) Coordinates of biopsies of eyelid epidermis sampled for patient PD18003 with the size of points scaled by biopsy area. Colored points contained within single biopsies depict the six biopsies containing the seven mutant clones considered outliers by size. Green points mark five biopsies sharing the same point mutation in SCN1A. Size of colored dots scaled by the size of the outlier clones or the shared mutant clone. (B) Size of mutant clones belonging to one of the five biopsies with SCN1A mutation. Comparison of VAFs across all five biopsies suggest the clonal structure depicted in C. (D) Coordinates of biopsies from patient PD20399 with the size of dots scaled by the area of the biopsy. The 12 biopsies colored light or dark green share the same point mutation in FGFR3 and the six biopsies marked in dark green also share point mutations in TP53 and ARID1A. Green biopsies scaled by the size of the majority mutant clone. (E) Clonal organization implied by the mutational landscape of the clone depicted in D. (F) Analysis of mutational profile of mutant clones that span more than three biopsies in patient PD13634 reveal an oversized clone with the given clonal architecture.
Similarly, in patient PD20399, a clone bearing a missense point mutation in FGFR3 (R248C) spans no fewer than 12 biopsies covering an aggregate area of . However, as noted by Martincorena et al. (16), in 6 of the 12 biopsies, this mutation appears alongside two other missense point mutations, one in TP53 (P250L) and one in ARID1A (P929S), with all three bearing a very similar VAF (Fig. 3D). This coincidence suggests that it is the acquisition of these secondary mutations that drives nonneutral expansion of the clone. From the relative sizes of the three constituent mutations, we can infer the likely sequence of their acquisition (Fig. 3E). Interestingly, the large dispersion of the clone bearing the original mutation in FGFR3 and its irregular spatial pattern (Fig. 3D) suggests that either mutation in FGFR3 occurred independently at the same locus or this mutation may have a developmental origin. A second clone mutant for NOTCH2 (P426S) spans five biopsies, but the majority lies within just two. In this case, its net aggregate size of suggests that it may belong to the ensemble of neutral mutations.
For patient PD13634, inspection of the mutational profile shows that one point mutation spans seven biopsies, three span five, and four span four. Inspection of the mutational profile shows these events can be traced to the expansion of just two clones and their subclones. Comparison of the VAFs of the constituent mutant clones suggests that, in one case, a consecutive sequence of five independent point mutations starting with FGFR3 (*809G), followed by PPP1R3A (P967L), ARID1A (G851D), NOTCH1 (P574S), and NOTCH1 (P745), drives nonneutral expansion, leading to a clone with an aggregate size in excess of (Fig. 3F). A second independent clone, involving a synonymous mutation in MUC17 (T3292T) followed by a nonsense mutation in SPHKAP (W308*), leads to a much smaller clone with an aggregate size of only , well within the statistical ensemble of neutral mutations. Finally, for patient PD21910, there are no mutations that extend beyond two biopsies.
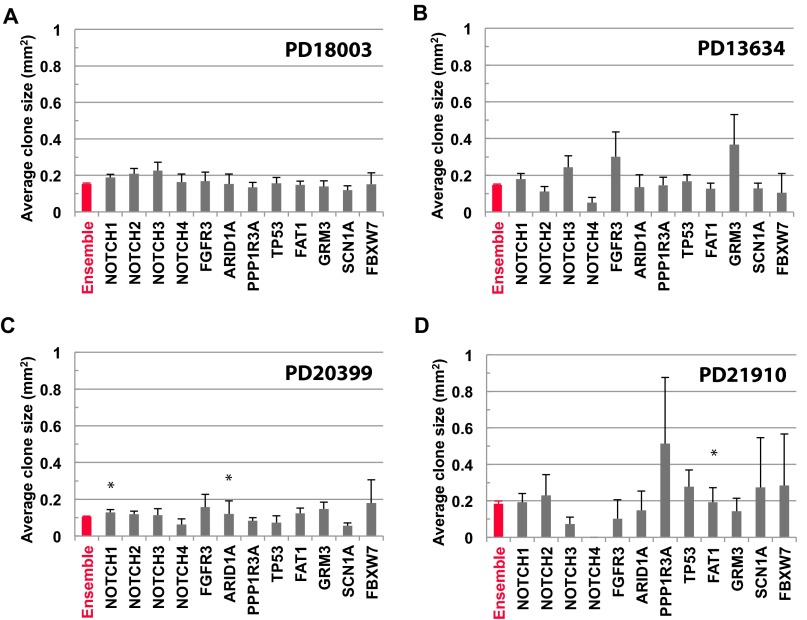
For consistency, we can further filter the ensemble of biopsies excluding those that contain the two oversized clones in patients PD13634 and PD20399. Because these clones are subject to nonneutral expansion, they may affect neighbors by either suppressing their expansion or conveying them as passengers. Once removed, we find that the first incomplete moment maintains its exponential character, whereas the total clone size distribution falls onto the predicted size dependence (Fig. S6). Finally, to further challenge the hypothesis of neutrality, we determined the average mutant clone size across a range of genes. For all four patients, we found that departures of the average clone size associated with specific cancer drivers from that of the ensemble were not statistically significant (Fig. S7).
Fig. S6.
Filtered clone size distribution confirms neutral clone dynamics. A–C and D–F show the first incomplete moment, , and clone size distribution, , for patients PD13634 and PD20399, respectively, following the removal of biopsies containing the two clones that span multiple biopsies depicted in Fig. 3. Points show data and the lines show a fit to the predicted distributions (Eqs. 1 and 2). Error bars denote SEM.
Fig. S7.
Average clone size for typical driver genes is consistent with neutral dynamics. Average size of mutant clones belonging to different cancer drivers (black) compared by the ensemble average of all genes (red) for patients (A) PD18003, (B) PD13634, (C) PD20399, and (D) PD21910. Note that, for the majority of genes and patients, the departure of the average clone size for cancer drivers from the ensemble average is not statistically significant. Error bars denote SEM. To test for inequivalence of specific genes from the ensemble average, we have used a Kolmogorov–Smirnov test to compare mutant clone size distributions. The P values from the four patients, PD18003, PD13634, PD20399, and PD21910 are, respectively, given by NOTCH1: 0.050, 0.18, 0.025, and 0.25; NOTCH2: 0.081, 0.31, 0.97, and 0.25; NOTCH3: 0.34, 0.15, 0.66, and 0.19; NOTCH4: 0.43, 0.14, 0.99, and not available (N/A); FGFR3: 0.16, 0.54, 0.012, and N/A; ARID1A: 0.51, 0.81, 0.043, and 0.92; PPP1R3A: 1.00, 0.17, 0.27, and 0.072; TP53: 0.53, 0.06, 0.33, and 0.37; FAT1: 0.46, 0.96, 0.92, and 0.044; GRM3: 0.95, 0.18, 0.64, and 0.92; SCN1A: 0.51, 0.65, 0.078, and N/A; and FBXW7: 0.84, N/A, 0.65, and N/A. These results show that, for all but three entries, the statistical equivalence of the distributions cannot be ruled out (at a significance level of 0.05).
Although these findings suggest that the majority of mutations leave neutral dynamics unperturbed, it is important to consider what would emerge if the dynamics were nonneutral. If all point mutations conferred the same proliferative advantage, the first incomplete moment would also acquire an exponential size dependence, , with and ν defining the net proliferative expansion rate of mutant progenitors (36). However, because such a size dependence would require all point mutations (synonymous and nonsynonymous) to confer precisely the same proliferative advantage, its relevance to the current study is unlikely. It is, however, important to note that, although the statistical approach provides the means to define clones that lie outside the normal size distribution, we cannot rule out the existence of a further subfraction of clones associated with nonneutral transformation that lie hidden within the bulk of the neutral distribution.
Discussion
These results demonstrate how analysis of deep sequencing data provides a general framework to study stem cell self-renewal of normal cycling adult human tissues. Applied to human IFE, we find that maintenance involves the turnover of a progenitor population following population asymmetry in which their stochastic loss through differentiation is compensated by duplication of neighbors. From a fit of the data to the exponential size dependence of , the inferred ratios are found to be broadly consistent with the predicted linear increase with the age of the patient (Table 2). With an estimated basal cell density of cells per mm2 (38) and a progenitor fraction of basal cells of one in three [extrapolated from mouse (27)], a linear fit of the measured ratio suggests a loss/replacement rate of the self-renewing population of per week. Although uncertainty in both the progenitor fraction and the relative frequency of divisions leading to symmetric or asymmetric fate undermine the predictive value of this rate, a loss/replacement time measured in weeks is broadly consistent with the expected proliferative activity of cycling keratinocyte progenitors in normal homeostasis which, on the basis of BrdU incorporation, points at an average cell division rate in human scalp epidermis of around two per week (38).
Table 2.
Fit of the first incomplete moment to the predicted exponential size dependence
| Fit parameter | Patient* | |||
| PD18003, | PD13634, | PD20399, | PD21910, | |
| 65 y old (F) | 73 y old (M) | 55 y old (F) | 58 y old (F) | |
| () (syn.) | ||||
| () (all) | ||||
| (mm2⋅y−1) | 0.0039 | 0.0032 | 0.0025 | 0.0054 |
Significantly, the deep sequencing approach also provides a quantitative assay to expose rare mutant clones that have undergone field transformation and to assess their mutational profile. Application of this approach to human epidermis shows that, despite evidence for positive selection (16), population asymmetry and neutrality of epidermal progenitor cell fate may be surprisingly robust to the acquisition of somatic point mutations, even in genes associated with cancer drivers. Indeed, the multiplicity of mutations in the minority of clones (ca. 0.1% or less) that lie outside the normal size distribution suggests that proliferative advantage may typically rely on epistasis, requiring the acquisition of multiple mutations across a range of genes.
Under conditions of normal homeostasis, clonal evolution in IFE is constrained to two dimensions, with clones expanding in cohesive clusters across the basal and suprabasal layers (Fig. 1C). Applied to higher-dimensional (volumnar) tissues, as well as other epithelial tissues, the same clone size dependence is predicted to apply without further revision (SI Text) (35). However, if occupancy of the self-renewing compartment is constrained to lower dimension, or if stem cells are restricted to closed niche domains, the same general technology applies, but the predicted mutant clone size distribution must be appropriately revised (SI Text). Therefore, applied to deep sequencing studies, the current theoretical scheme provides a general method to probe stem cell fate behavior in normal cycling adult human tissues and to identify the existence and mutational signature of rare field transformations driven by the nonneutral dynamics of mutant cells, with potential applications to the early detection of preneoplasia.
SI Text
The quantitative analysis of the probability distribution of mutant clone sizes described in the main text relies upon a robust and generic model of stem cell self-renewal in adult cycling tissues. In the following, we expand upon the theoretical basis of the modeling scheme and the derivation of the size distribution of mutant clones defined by Eq. 1 in the main text. Furthermore, we discuss generalizations of the theoretical scheme to different tissue architectures.
Background
As a starting point, it is necessary to review the constraints that restrict the possible fate behavior of progenitors that maintain cycling adult tissues. For clarity, we refer to this cycling and self-renewing population as “progenitors” rather than stem cells, noting that, in the context of epidermis as well as other tissues, these cells may be underpinned by a second quiescent “stem cell” population. To achieve long-term homeostasis, the maintenance of a cycling tissue must ultimately rely on the turnover of a single equipotent progenitor pool that divides asymmetrically so that, on average, one daughter cell stays in the self-renewing compartment and the other commits to differentiation, either directly or through a transit compartment with a strictly limited proliferative potential (35). [Note that the equipotency of progenitor cell behavior over long times does not rule out potential short-term heterogeneity in which progenitors transfer reversibly between states biased for duplication or differentiation (22).]
Although fate asymmetry may be invariant, enforced at the level of individual cell divisions, it may also follow from a stochastic pattern of behavior in which chance progenitor cell loss through differentiation is perfectly compensated by the duplication of neighboring cells (Fig. 1B). In this mode of “population asymmetric” self-renewal, neutral competition between progenitors leads to a gradual consolidation of clonal diversity, whereas the size of surviving clones continually increases (Fig. 1C and Fig. S2).
On this background, consider the impact of a neutral hereditary label (such as a synonymous point mutation) that marks a progenitor cell. In systems characterized by invariant asymmetric self-renewal, individual progenitor cells are long-lived and, once acquired, a marked cell would persist indefinitely. By contrast, in systems defined by population-asymmetric self-renewal, through neutral competition between neighboring progenitors, a marked cell and its progeny—a clone—may, by chance, be purged from the population, or the clone may expand (Fig. 1C). In a tissue defined by an ensemble of closed niche domains, such as the crypt organization of the intestinal epithelium, this process of “neutral drift” and clonal consolidation continues until the clone is lost, or cells in the given niche domain drift to monoclonality and the hereditary label (mutation) becomes locally fixed. By contrast, in systems defined by an open or facultative niche, such as the interfollicular epidermis or testis, the neutral dynamics of clones would continue unabated.
To address the quantitative dynamics of clones in an open or “facultative” niche subject to population asymmetric self-renewal, it is important to discriminate between different patterns of regulation (35). If the balance between proliferation and differentiation follows from intrinsic (cell autonomous) regulation, long-term clone dynamics of the progenitor pool becomes indistinguishable from that of the critical birth-death process,
where denotes the effective loss/replacement rate of progenitors P. Here, we have chosen our definition of the loss/replacement rate to align with the particular model of progenitor cell self-renewal in IFE, as depicted in Fig. 1B. Furthermore, we have suppressed progenitor cell divisions that lead to asymmetric fate outcome because these leave the progenitor cell number—and therefore the progenitor clone size—unchanged.
Then, if we start with a progenitor population of total size , the chance of finding a surviving clone of size n progenitors after a time t is given by (39)
In particular, at times , the distribution of “surviving” clones (i.e., those containing at least one progenitor) converges onto a hallmark exponential clone size distribution, . From this result, it follows that the cumulative distribution, defined as the chance of finding a surviving clone with a size greater than n progenitors, is given by , where defines the average size of surviving clones. That is, while the average size of surviving clones increases, the chance of finding a clone with a size given by some multiple of the average remains constant over time, and defined by an exponential distribution. The speed with which the size distribution convergences to this “scaling” limit is illustrated by the results of a stochastic simulation shown in Fig. S2.
Conversely, if the balance between proliferation and differentiation follows from extrinsic regulation (such as neutral competition for limited niche access), the long-term clonal dynamics depends on the local coordination of neighboring progenitor cells, and therefore the effective “dimensionality” of the niche (35). In dimensions of two (epithelial) and above (volumnar), the clone size distribution converges onto the same exponential size dependence as that defined above for intrinsic regulation. However, in quasi one-dimensional (ductal) tissues, for , the clone size distribution converges onto the form
where λ defines the loss/replacement rate of neighboring progenitors. In this case, the surviving clone size distribution takes the form . Once again, the chance of finding a clone with a size larger than n progenitors is given by the scaling form, , where defines the average size of surviving clones.
Mutant Clone Dynamics in Interfollicular Epidermis
With these preliminaries, let us now consider mutant clone dynamics following the acquisition of a neutral somatic point mutation in the IFE. In particular, let us suppose that cells belonging to the self-renewing progenitor pool acquire sporadic point mutations at a low rate of ω per base per progenitor cell, where ω may vary substantially with the specific locus along the genome. Later we will define what we mean by a “low mutation rate.” Each point mutation then serves as a hereditary clonal marker identifying mutant cells and their progeny. In the course of turnover, through (neutral) competition with neighbors, the clonal progeny of these mutated cells may survive and expand or they may become extinct. Formally, in this case, the dynamics is equivalent to a critical birth–death process with immigration (39). If each progenitor cell simply persisted without loss and replacement (i.e., , then for , where t denotes the time during which the population is exposed to mutations (i.e., the age of patient), the multiplicity of marked (mutated) cells, M, at any given locus would be given by a Poisson distribution,
Over time, the field of cells without mutation at this locus must steadily decrease, leading to a small adjustment of this probability. However, providing the fraction of mutated cells at a given locus remains small, , the adjustment of can be safely neglected. In this case, the average number of cells with a mutation at the given locus is given by .
With this definition, we may now construct the size distribution of mutant cells at a given locus in the population. More precisely, the chance, , of finding n mutant progenitor cells at age t is given by
Formally, the first component describes the multiplicity of mutated cells. Each of these mutations could have occurred at any time between 0 and t. Each will produce a clone with n progenitor cells with probability integrated over time t. Summing the total number of marked cells, n, for each induction event gives the total number of progenitor cells with a mutation at that locus in the genome.
Then, if we suppose that the balance between proliferation and differentiation follows from intrinsic regulation, using the results above, and setting , all time integrals and cell number summations can be performed. In particular, making use of the identity,
it follows that
Therefore, making use of this result, we have that
from which we obtain the formal expression for the probability distribution function,
In the limit , this expression can be simplified to the form
| [S1] |
where we have defined the parameter , which indexes the relative frequency of mutations to progenitor cell loss/replacement events. In the particular case that (i.e., when no cells bear a mutation at a given locus), the integral over ϕ can be performed explicitly and leads to the probability, . For , the integral cannot be performed exactly, but does admit to useful limits. Specifically, when the mutation rate is low compared with the loss/replacement rate, , the integrand can be expanded and the full distribution converges to the form
Note that, in this limit, the frequency of cells that have escaped mutation at a given locus declines only logarithmically with time. This slow (logarithmic) dependence reflects the fact that the majority of cells that acquire a mutation at a specific locus will most likely become lost through neutral competition with nonmutated neighbors.
From this result, we find that the size distribution of surviving mutant clones, , that is, clones that contain at least one mutated progenitor cell,
| [S2] |
is independent of (and therefore insensitive to genomic variations in) the mutation rate, ω. This result (Eq. 1 in the main text) is easy to understand: In the limit , there is typically at most only one clone that contributes to the frequency of mutations at the given locus. In this case, the distribution should converge to the time-integrated form of , which gives rise to the dependence.
More generally, when the rate of mutation is larger, individual point mutations may not confer a unique clonal label. Instead, contributions from independent clones associated with mutations at the same locus will contribute to a net variable allele fraction. Qualitatively, such contributions are evidenced by the acquisition of a peak in the mutant clone size distribution. To determine an estimate for , we can make use of a stationary phase approximation to evaluate the integral in Eq. S1. Varying the exponent of the integrand with respect to ϕ, we obtain the stationary phase solution,
Then, taking , , and making use of the approximation,
expansion of the integrand in fluctuations , leads to the result
Finally, using this result to construct the surviving clone size distribution, and normalizing, we obtain the general result,
| [S3] |
where denotes the Gamma function.
Although Eqs. S2 and S3 provide a prediction with which to address deep sequencing data, the nontrivial dependence of the size distribution on n makes a direct comparison with theory cumbersome. Fortunately, the size distribution is easily manipulated into a form where it translates to a simple exponential dependence. In particular, for , if we define the average mutant clone size , the first incomplete moment (cf. ref. 36)
acquires an exponential dependence on clone size n (Eq. 2 in the main text). In this form, the clone size dependence may be straightforwardly compared with experimental data. Conversely, in the limit when , if we define
the generalized incomplete moment,
also acquires a simply exponential form. Operationally, when the ratio of the mutation and loss/replacement rate, ζ, is unknown—which would typically be the case—it would be necessary to continuously adjust ζ until the incomplete moment acquires an exponential form.
Resolution Limit of Deep Sequencing
The practical implementation of this analytical scheme relies on the ability to faithfully reconstruct the mutant clone size distribution from measurements of the variable allele fraction using deep sequencing. In practice, the reliability of this approach will be compromised by several factors, some of which have been addressed in the main text. However, one significant effect which we must consider is the impact of the resolution limit of the sequencing approach which will typically place a lower limit on the size of the smallest clones that can be resolved. However, if we adjust the size distribution to accommodate a cutoff, , excluding mutant clones of size , the generalized incomplete moment takes the form
for all ζ including . Therefore, it follows that the potential limitation of the deep sequencing approach in capturing the smallest clones does not change the exponential character of the size dependence of the generalized incomplete moment. Instead, it imposes an overall constant prefactor. Therefore, although the exponential character of the generalized incomplete moment can be assessed directly, a fit to the experimental data requires the adjustment of both and the unknown size cutoff . It is this procedure that we use to fit the datasets in Fig. 2 and Figs. S5 and S6.
Alongside the resolution limit, the estimate of clone sizes from the measured variable allele fractions are subject to additional sources of error and uncertainty. First, clones may extend outside the boundaries of individual biopsies, leading to an underestimate of mutant clone size. Second, errors due to variations in the read depth of the sequencing will also compromise the accuracy of the method. Fortunately, the exponential character of the predicted clone size distribution serves to mitigate against the impact of such errors. In particular, suppose that the sequencing approach leads to a sampling error that translates to a normal distribution of clone sizes, i.e., clones of “true” size are recorded at a frequency of
where σ denotes the SD of the error. In this case, the first incomplete moment would be given by
Therefore, providing , the correction of the first incomplete moment due to fluctuations will be small. For the smallest clone sizes n, this condition cannot be met. However, such contributions are in any case below the resolution limit of the sequencing approach. Conversely, for , consistent with the typical clone sizes examined here, this condition will be safely met.
Generalizations of the Analytical Approach
Until now, we have focused our analysis on the dynamics of cycling adult tissues in which the self-renewing progenitor cell population conforms to a pattern of population asymmetry in which stochastic fate behavior follows from intrinsic (cell-autonomous) regulation. As discussed above, for systems in which population asymmetric follows from extrinsic regulation (e.g., when stem cells compete neutrally for limited niche access), in dimensions of two (epithelia) and higher (volumar), the mutant clone size distribution (and the corresponding incomplete moments) are predicted to assume the same functional dependence. That is, as with a pulse-labeling clonal assay, in dimensions of two and above, the mechanism of regulation (intrinsic vs. extrinsic) cannot be inferred from the analysis of the mutant clone size distribution alone.
However, as emphasized above, if cell dynamics follows from extrinsic regulation, in the one-dimensional or quasi one-dimensional geometry (viz. ductal or tubular tissues), the mutant clone size distribution must be revised. In particular, when the mutation rate, ω, is low compared with the rate of stem cell loss and replacement, the mutant clone size distribution takes the form
where denotes the complementary error function. In this case, the frequency of nonmutated clones diminishes more rapidly, because the clonal loss rate due to neutral competition scales only as . As a result, the size distribution of surviving mutant clones is predicted to take the form
Then, with the average clone size given by , the first incomplete moment takes the form
In particular, in the limit , when , we have
Finally, if tissues are divided into an ensemble of isolated niche domains, such as the glandular crypt structures found in the intestinal tract and stomach, the mutant clone size distribution must be revised again. In this case, the chance induction of stem cells through somatic mutation may, through neutral competition, lead to the clonal fixation of individual glands in which all constituent cells become monoclonal. With defining the (effective) stem cell number per gland, we expect the frequency of monoclonal glands associated with a specific mutation to grow as , where denotes the total number of glands in the biopsy sample, and ω denotes the locus-specific mutation rate per stem cell. Alongside this growing fraction of monoclonal glands, at any given instant in time, we expect to find a time-independent distribution of partially mutated glands corresponding to clones whose fate (extinction through neutral competition or fixation) has yet to resolve. In the quasi one-dimensional arrangement of stem cells in the intestinal crypt of the colon or small intestine, the size distribution of these partially labeled crypts is given simply by
independent of time, t.
Supplementary Material
Acknowledgments
I thank Peter Campbell, Phil Jones, and Inigo Martincorena for sharing information on the sizes of the biopsies used in their study and for making their sequencing data publically available. I also thank Trevor Graham, Philip Greulich, and Anna Philpott for valuable discussions. This work was supported by Wellcome Trust Grant 098357/Z/12/Z.
Footnotes
The author declares no conflict of interest.
This article is a PNAS Direct Submission.
This article contains supporting information online at www.pnas.org/lookup/suppl/doi:10.1073/pnas.1516123113/-/DCSupplemental.
References
- 1.Simons BD, Clevers H. Strategies for homeostatic stem cell self-renewal in adult tissues. Cell. 2011;145(6):851–862. doi: 10.1016/j.cell.2011.05.033. [DOI] [PubMed] [Google Scholar]
- 2.Van Keymeulen A, Blanpain C. Tracing epithelial stem cells during development, homeostasis, and repair. J Cell Biol. 2012;197(5):575–584. doi: 10.1083/jcb.201201041. [DOI] [PMC free article] [PubMed] [Google Scholar]
- 3.Driessens G, Beck B, Caauwe A, Simons BD, Blanpain C. Defining the mode of tumour growth by clonal analysis. Nature. 2012;488(7412):527–530. doi: 10.1038/nature11344. [DOI] [PMC free article] [PubMed] [Google Scholar]
- 4.Blanpain C. Tracing the cellular origin of cancer. Nat Cell Biol. 2013;15(2):126–134. doi: 10.1038/ncb2657. [DOI] [PubMed] [Google Scholar]
- 5.Vermeulen L, et al. Defining stem cell dynamics in models of intestinal tumor initiation. Science. 2013;342(6161):995–998. doi: 10.1126/science.1243148. [DOI] [PubMed] [Google Scholar]
- 6.Ellenbroek SIJ, van Rheenen J. Imaging hallmarks of cancer in living mice. Nat Rev Cancer. 2014;14(6):406–418. doi: 10.1038/nrc3742. [DOI] [PubMed] [Google Scholar]
- 7.Merlo LMF, Pepper JW, Reid BJ, Maley CC. Cancer as an evolutionary and ecological process. Nat Rev Cancer. 2006;6(12):924–935. doi: 10.1038/nrc2013. [DOI] [PubMed] [Google Scholar]
- 8.Bozic I, et al. Accumulation of driver and passenger mutations during tumor progression. Proc Natl Acad Sci USA. 2010;107(43):18545–18550. doi: 10.1073/pnas.1010978107. [DOI] [PMC free article] [PubMed] [Google Scholar]
- 9.Navin N, et al. Tumour evolution inferred by single-cell sequencing. Nature. 2011;472(7341):90–94. doi: 10.1038/nature09807. [DOI] [PMC free article] [PubMed] [Google Scholar]
- 10.Gerlinger M, et al. Intratumor heterogeneity and branched evolution revealed by multiregion sequencing. N Engl J Med. 2012;366(10):883–892. doi: 10.1056/NEJMoa1113205. [DOI] [PMC free article] [PubMed] [Google Scholar]
- 11.Greaves M, Maley CC. Clonal evolution in cancer. Nature. 2012;481(7381):306–313. doi: 10.1038/nature10762. [DOI] [PMC free article] [PubMed] [Google Scholar]
- 12.Vogelstein B, et al. Cancer genome landscapes. Science. 2013;339(6127):1546–1558. doi: 10.1126/science.1235122. [DOI] [PMC free article] [PubMed] [Google Scholar]
- 13.Sottoriva A, et al. A Big Bang model of human colorectal tumor growth. Nat Genet. 2015;47(3):209–216. doi: 10.1038/ng.3214. [DOI] [PMC free article] [PubMed] [Google Scholar]
- 14.Martincorena I, Campbell PJ. Somatic mutation in cancer and normal cells. Science. 2015;349(6255):1483–1489. doi: 10.1126/science.aab4082. [DOI] [PubMed] [Google Scholar]
- 15.Stratton MR, Campbell PJ, Futreal PA. The cancer genome. Nature. 2009;458(7239):719–724. doi: 10.1038/nature07943. [DOI] [PMC free article] [PubMed] [Google Scholar]
- 16.Martincorena I, et al. Tumor evolution. High burden and pervasive positive selection of somatic mutations in normal human skin. Science. 2015;348(6237):880–886. doi: 10.1126/science.aaa6806. [DOI] [PMC free article] [PubMed] [Google Scholar]
- 17.Teixeira VH, et al. Stochastic homeostasis in human airway epithelium is achieved by neutral competition of basal cell progenitors. eLife. 2013;2:e00966. doi: 10.7554/eLife.00966. [DOI] [PMC free article] [PubMed] [Google Scholar]
- 18.Baker A-M, et al. Quantification of crypt and stem cell evolution in the normal and neoplastic human colon. Cell Reports. 2014;8(4):940–947. doi: 10.1016/j.celrep.2014.07.019. [DOI] [PMC free article] [PubMed] [Google Scholar]
- 19.Martincorena I, Seshasayee ASN, Luscombe NM. Evidence of non-random mutation rates suggests an evolutionary risk management strategy. Nature. 2012;485(7396):95–98. doi: 10.1038/nature10995. [DOI] [PubMed] [Google Scholar]
- 20.Dees ND, et al. MuSiC: Identifying mutational significance in cancer genomes. Genome Res. 2012;22(8):1589–1598. doi: 10.1101/gr.134635.111. [DOI] [PMC free article] [PubMed] [Google Scholar]
- 21.Greenman C, Wooster R, Futreal PA, Stratton MR, Easton DF. Statistical analysis of pathogenicity of somatic mutations in cancer. Genetics. 2006;173(4):2187–2198. doi: 10.1534/genetics.105.044677. [DOI] [PMC free article] [PubMed] [Google Scholar]
- 22.Krieger T, Simons BD. Dynamic stem cell heterogeneity. Development. 2015;142(8):1396–1406. doi: 10.1242/dev.101063. [DOI] [PubMed] [Google Scholar]
- 23.Hsu Y-C, Li L, Fuchs E. Emerging interactions between skin stem cells and their niches. Nat Med. 2014;20(8):847–856. doi: 10.1038/nm.3643. [DOI] [PMC free article] [PubMed] [Google Scholar]
- 24.Page ME, Lombard P, Ng F, Göttgens B, Jensen KB. The epidermis comprises autonomous compartments maintained by distinct stem cell populations. Cell Stem Cell. 2013;13(4):471–482. doi: 10.1016/j.stem.2013.07.010. [DOI] [PMC free article] [PubMed] [Google Scholar]
- 25.Mackenzie IC. Relationship between mitosis and the ordered structure of the stratum corneum in mouse epidermis. Nature. 1970;226(5246):653–655. doi: 10.1038/226653a0. [DOI] [PubMed] [Google Scholar]
- 26.Potten CS, Kovacs L, Hamilton E. Continuous labelling studies on mouse skin and intestine. Cell Tissue Kinet. 1974;7(3):271–283. doi: 10.1111/j.1365-2184.1974.tb00907.x. [DOI] [PubMed] [Google Scholar]
- 27.Clayton E, et al. A single type of progenitor cell maintains normal epidermis. Nature. 2007;446(7132):185–189. doi: 10.1038/nature05574. [DOI] [PubMed] [Google Scholar]
- 28.Doupé DP, Klein AM, Simons BD, Jones PH. The ordered architecture of murine ear epidermis is maintained by progenitor cells with random fate. Dev Cell. 2010;18(2):317–323. doi: 10.1016/j.devcel.2009.12.016. [DOI] [PubMed] [Google Scholar]
- 29.Mascré G, et al. Distinct contribution of stem and progenitor cells to epidermal maintenance. Nature. 2012;489(7415):257–262. doi: 10.1038/nature11393. [DOI] [PubMed] [Google Scholar]
- 30.Lim X, et al. Interfollicular epidermal stem cells self-renew via autocrine Wnt signaling. Science. 2013;342(6163):1226–1230. doi: 10.1126/science.1239730. [DOI] [PMC free article] [PubMed] [Google Scholar]
- 31.Rheinwald JG, Green H. Serial cultivation of strains of human epidermal keratinocytes: The formation of keratinizing colonies from single cells. Cell. 1975;6(3):331–343. doi: 10.1016/s0092-8674(75)80001-8. [DOI] [PubMed] [Google Scholar]
- 32.Barrandon Y, Green H. Three clonal types of keratinocyte with different capacities for multiplication. Proc Natl Acad Sci USA. 1987;84(8):2302–2306. doi: 10.1073/pnas.84.8.2302. [DOI] [PMC free article] [PubMed] [Google Scholar]
- 33.Jones PH, Watt FM. Separation of human epidermal stem cells from transit amplifying cells on the basis of differences in integrin function and expression. Cell. 1993;73(4):713–724. doi: 10.1016/0092-8674(93)90251-k. [DOI] [PubMed] [Google Scholar]
- 34.Watt FM. Mammalian skin cell biology: At the interface between laboratory and clinic. Science. 2014;346(6212):937–940. doi: 10.1126/science.1253734. [DOI] [PubMed] [Google Scholar]
- 35.Klein AM, Simons BD. Universal patterns of stem cell fate in cycling adult tissues. Development. 2011;138(15):3103–3111. doi: 10.1242/dev.060103. [DOI] [PubMed] [Google Scholar]
- 36.Klein AM, Brash DE, Jones PH, Simons BD. Stochastic fate of p53-mutant epidermal progenitor cells is tilted toward proliferation by UV B during preneoplasia. Proc Natl Acad Sci USA. 2010;107(1):270–275. doi: 10.1073/pnas.0909738107. [DOI] [PMC free article] [PubMed] [Google Scholar]
- 37.Slaughter DP, Southwick HW, Smejkal W. Field cancerization in oral stratified squamous epithelium; clinical implications of multicentric origin. Cancer. 1953;6(5):963–968. doi: 10.1002/1097-0142(195309)6:5<963::aid-cncr2820060515>3.0.co;2-q. [DOI] [PubMed] [Google Scholar]
- 38.Jones PH, Harper S, Watt FM. Stem cell patterning and fate in human epidermis. Cell. 1995;80(1):83–93. doi: 10.1016/0092-8674(95)90453-0. [DOI] [PubMed] [Google Scholar]
- 39.Bailey NTJ. The Elements of Stochastic Processes with Applications to the Natural Sciences. Wiley; New York: 1964. [Google Scholar]
- 40.Zhang MQ. Statistical features of human exons and their flanking regions. Hum Mol Genet. 1998;7(5):919–932. doi: 10.1093/hmg/7.5.919. [DOI] [PubMed] [Google Scholar]
Associated Data
This section collects any data citations, data availability statements, or supplementary materials included in this article.


